


dbcc 删除日志
背景 (Background)
When we’re architecting or troubleshooting issues in an environment, understanding how the log is set up and its history helps us identify if improving it will carry significant impacts overall. We have some built in tools that we can use, such as DBCC LOGINFO and DBCC SQLPERF and in this tip we look at how we can use them when we’re debugging issues, designing our logs for scale, or monitoring our current setup. We also look at some ways we can retain the information these provide so that we can use this for historic measurements and benchmarking, as well as using them for potentially alerting.
当我们在环境中设计问题或对问题进行故障排除时,了解日志的设置方式及其历史记录有助于我们确定改进日志是否会对整体产生重大影响。 我们有一些内置工具可供使用,例如DBCC LOGINFO和DBCC SQLPERF,在本技巧中,我们介绍了在调试问题,设计日志规模或监视当前设置时如何使用它们。 我们还研究了一些方法,可以保留这些方法提供的信息,以便将其用于历史测量和基准测试,以及将其用于潜在警报。
讨论区 (Discussion)
DBCC LOGINFO
DBCC日志信息
When looking at DBCC LOGINFO to get an overview of the log structure, let’s look at a couple of key items:
在查看DBCC LOGINFO以获得日志结构的概述时,让我们看几个关键项:
The amount of the result, which is the VLF count.
结果的数量,即VLF计数。
The CreateLSN from an architecture point helps me quickly identify when a log has been inappropriately designed relative to the database need, as these values may be in small chunks relative to the size, or they may be individual – meaning that VLFs were created in small amounts as the database grew. For instance, assuming that both of the below databases were expecting large growth over the next year, I know the second image was well planned for this, while the first was not because large growth will often come in large batches and a log must either grow to handle these volumes or be pre-scaled:
从体系结构的角度来看,CreateLSN可以帮助我快速确定何时相对于数据库需求不恰当地设计了日志,因为这些值相对于大小可能很小,或者它们可能是单独的,这意味着VLF是少量创建的随着数据库的增长。 例如,假设下面的两个数据库都预计明年会有大的增长,我知道第二张图已为此计划好了,而第一张不是因为大张数通常会成批增长并且必须增加一个对数处理这些数量或进行预先缩放:
Log one 记录一 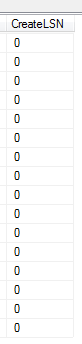
Log two 日志二 Multiple log files don’t assist, though I’ve seen this from time to time for the intent of scaling. Log operations occur sequentially, so adding more log files doesn’t help scale transactions. If we need to re-architect a log design, such as create a new log file and empty the old file for moving the file itself, be careful about naming convention; some tools are built to automatically use a standard naming convention and this might disrupt them.
多个日志文件无济于事,尽管我出于扩展的目的不时看到这一点。 日志操作是按顺序进行的,因此添加更多日志文件无助于扩展事务。 如果需要重新设计日志设计,例如创建一个新的日志文件并清空旧文件以移动文件本身,请注意命名约定; 某些工具可以自动使用标准命名约定,因此可能会破坏它们。
For VLF monitoring, we can execute the below code to save the count
对于VLF监视,我们可以执行以下代码来保存计数
DBCC SQLPERF(LOGSPACE)
DBCC SQLPERF(日志空间)
We can monitor log growth and use in many ways; one simple and effective way is to use the SQLPERF command that Microsoft provides. In the below code, I create a table that saves this information and insert the values into the table from the most recent DBCC SQLPERF:
我们可以通过多种方式监控日志的增长和使用; 一种简单有效的方法是使用Microsoft提供SQLPERF命令。 在下面的代码中,我创建一个表来保存此信息,并将值从最新的DBCC SQLPERF插入表中:
CREATE TABLE tblLogMon(
	DatabaseName VARCHAR(250),
	LogSize_MB DECIMAL(22,4),
	LogSpaceUsed DECIMAL(5,2),
	Status TINYINT,
	---- Added column to track time
	RecordStamp DATETIME DEFAULT GETDATE()
)


INSERT INTO tblLogMon (DatabaseName,LogSize_MB,LogSpaceUsed,Status)
EXEC ('DBCC SQLPERF(LOGSPACE)')


SELECT *
FROM tblLogMon
The added RecordStamp column makes it useful to track the time, as this can be useful to highlight when a log fills as evidence that the drive may need to be grown (see later in this tip). For an example, suppose that I wanted to track the growth of a log for a database CryptoCurrencyMeasure where the log used was greater than my concern threshold of 75%, I could query the table:
添加的RecordStamp列使跟踪时间很有用,因为这可以突出显示何时填充日志,以作为可能需要增加驱动器的证据(请参阅本技巧的后面部分)。 例如,假设我想跟踪数据库CryptoCurrencyMeasure的日志增长情况,其中使用的日志大于我的关注阈值75%,我可以查询表:
SELECT *
FROM tblLogMon
WHERE DatabaseName = 'CrytoCurrencyMeasure'
	---- If my threshold concern is 75.00
	AND LogSpaceUsed > 75.00
ORDER BY RecordStamp DESC
This example is one way to make a stronger case if the design does not match the log needs. In addition, this can help show why a separate drive for the log is needed if we see significant movements in each measuring time period, even after a transaction log backup. The actual insert statement from SQLPERF should be at a measuring window that matches your environment, such as every fifteen minutes to an hour.
如果设计与日志需求不匹配,则此示例是一种提出更严格案例的方法。 此外,这可以帮助说明,即使在备份事务日志之后,如果在每个测量时间段内都有明显的变化,为什么需要一个单独的日志驱动器。 SQLPERF的实际插入语句应位于与您的环境匹配的度量窗口中,例如每十五分钟到一个小时。
一些有用的提示和问题 (Some Useful Tips and Questions)
From the start, does your log reflect what you expect your database to look like one year from now? I’ve listened to many individuals explain that “while we knew the database would grow, we didn’t expect large transactions, so log growth wasn’t expected” even though a larger data set may have larger transactions because a transaction runs against larger data sets. For a simple example of this, consider that a delete transaction against a portion of a table won’t have as much of an effect on a smaller table, while possibly having a large effect on a larger table (relative to the filter).
从一开始,您的日志是否反映了您希望从现在开始一年后数据库的外观? 我听过很多人的解释,“尽管我们知道数据库会增长,但我们并不预期会有大笔交易,因此就不会期望日志增长”,即使更大的数据集可能会有更大的交易,因为交易会遇到更大的交易。数据集。 对于一个简单的示例,请考虑针对表的一部分进行的删除事务对较小的表没有太大的影响,而对较大的表可能有较大的影响(相对于过滤器)。
Does your log have its own drive? The most obvious benefit of this is a reduction in contention. It also gives us the ability to track and measure the performance of the one drive without interpreting the data we have that’s mixed with other possibilities, like transactions in tempdb.
您的日志是否有自己的驱动器? 最明显的好处是减少了争用。 它还使我们能够跟踪和测量一个驱动器的性能,而无需解释我们拥有的数据以及其他可能性,例如tempdb中的事务。
Have you benchmarked the performance of the log drive relative to the environment? This question is especially important in high volume, OLTP environments. If we expect our logs to receive a high volume of transactions, we’ll want to make sure that the hardware to support them is optimized to handle the load.
您是否已对日志驱动器相对于环境的性能进行了基准测试? 这个问题在大容量OLTP环境中尤其重要。 如果我们希望日志能够接收大量事务,那么我们将确保对支持日志的硬件进行优化以处理负载。
What type of write transactions do you tend to receive in your environment and are these the most efficient way of how they’re run? For an example, do your developers tend to remove all records from a table using a delete over truncate because they don’t know that a truncate is available to them, or because they are removing a subset of the full data set each time? Do on-the-fly changes to tables that involve heavy write operations, such as setting a default to column when millions/billions/trillions records already exist, occur (in this case, it may not feel like a heavy write operation to the developer, but it can be)?
您倾向于在您的环境中接收哪种类型的写事务,这些是最有效的运行方式吗? 例如,您的开发人员是否倾向于使用truncate删除功能从表中删除所有记录,因为他们不知道他们可以使用truncate,还是因为他们每次都删除全部数据集的一部分? 对涉及繁重写入操作的表进行动态更改,例如在已经存在数百万/数十亿/万亿记录时将默认值设置为列(在这种情况下,对于开发人员而言,这可能感觉不像是繁重的写入操作,但是可以)?
One key point for large environment is that it’s often difficult to obtain more space or more resources even if those items will reduce problems – and this isn’t only limited to log space or log drives. DBAs and developers might be frustrated that their requests have been pushed back and I’ve witnessed situations where it was “expected” that the DBAs and developers would wake up overnight and fix the problem, along with other problems. In these situations, I highly recommend keeping a history of the following:
大型环境的一个关键点是,即使这些项目可以减少问题,通常也很难获得更多的空间或更多的资源-而且不仅限于日志空间或日志驱动器。 DBA和开发人员可能对他们的请求被推迟感到沮丧,我亲眼目睹了“预期” DBA和开发人员将在一夜之间醒来并解决问题以及其他问题的情况。 在这种情况下,我强烈建议您保留以下历史记录:
What log changes need to be made to the environment with problems.
需要对有问题的环境进行哪些日志更改。
Why you think these changes need to be made – and show historic information when stating the why as it strengthens your case. In the above code, I show one way of tracking information so that you can provide your case for why the log files may need to be grown. This doesn’t only include metrics, but a history of the problems you and others have solved related to the issue and the times (like overnight, etc).
为什么您认为需要进行这些更改-并在说明原因时显示历史信息,以加强您的案子。 在上面的代码中,我展示了一种跟踪信息的方法,以便您可以说明为什么可能需要增加日志文件的情况。 这不仅包括指标,还包括您和其他人已解决的与问题和时间(例如一整夜等)相关的问题的历史记录。
The consequences of not making the changes.
不进行更改的后果。
Who you sent the documentation to will help you track who received the information in case of mix-ups, or people moving from their department or environment.
文档发送给谁的人将帮助您跟踪谁收到信息,以防混淆,或者人员从其部门或环境迁离。
最后的想法 (Final Thoughts)
These commands help us monitor and track information related to our logs, especially how they’re being used, growing, their size, etc. Depending on what we find, we may want to pre-scale more growth, teach our developers to batch more frequently, expand or build a drive solely for the log, change the drive for the log to handle the volume, or other techniques that will improve our environment’s performance. With a history of this information, we can make a stronger case to our environment, especially when working with other teams.
这些命令可帮助我们监视和跟踪与日志有关的信息,尤其是日志的使用方式,增长方式,大小等。根据发现的内容,我们可能希望预先扩展更多的规模,教我们的开发人员增加批处理量通常,仅针对日志扩展或构建驱动器,更改日志驱动器以处理卷,或使用其他可改善环境性能的技术。 有了这些信息的历史记录,我们可以对我们的环境做出更充分的说明,尤其是在与其他团队合作时。
dbcc 删除日志


 1626
1626

 被折叠的 条评论
为什么被折叠?
被折叠的 条评论
为什么被折叠?
 到【灌水乐园】发言


