


 本文介绍了如何结合使用SQLServer查询和导出到Excel功能,创建复杂的数据透视表和图表,以便于数据分析和呈现。通过实际示例,展示了在Excel中进行数据透视和图形制作的过程。
In the previous article, Learn SQL: SQL Server Pivot Tables, we’ve discussed how to create a report using a PIVOT table query. We’ve created such a report directly in the SQL Server. In this article, we’ll do the same, but this time we’ll use SQL Server export to Excel. So, let’s start.
在上一篇文章学习SQL:SQL Server数据透视表中 ,我们讨论了如何使用PIVOT表查询创建报告。 我们已经在SQL Server中直接创建了这样的报告。 在本文中,我们将做同样的事情,但是这次我们将使用SQL Server导出到Excel。 所以,让我们开始吧。
数据模型和一般思路 (Data model and the general idea)
The data model we’ll use is the same that we’ve been using throughout this series. Even the queries used are the ones we’ve analyzed in the previous article and therefore I won’t explain them in-depth here. In case, you’ve missed the previous article, I strongly recommend taking a look at how these queries work.
我们将使用的数据模型与本系列中一直使用的数据模型相同。 甚至使用的查询都是我们在上一篇文章中分析过的查询,因此在这里我将不对其进行深入解释。 如果您错过了上一篇文章,我强烈建议您看一下这些查询的工作方式。
The goal of this article is to show how we could combine data returned using SQL query and SQL Server export to Excel. This combination could prove to be very powerful. One of the main reasons is that MS Excel provides many additional options like graphs, calculations, formatting results. Also, you could use one “master” Excel workbook where you would join data from multiple sources, much easier than you could do it in case you read these data from original sources. And, worth to mention, that Excel is widespread and people are usually much more familiar with it than with databases.
本文的目的是说明如何结合使用SQL查询和SQL Server导出到Excel所返回的数据。 这种组合可以证明是非常强大的。 主要原因之一是MS Excel提供了许多其他选项,例如图形,计算,格式设置结果。 另外,您可以使用一个“主” Excel工作簿,在其中可以从多个来源合并数据,比从原始来源读取这些数据时要容易得多。 而且,值得一提的是,Excel十分普及,人们通常比使用Excel更加熟悉它。
SQL Server导出到Excel –使用PIVOT查询 (SQL Server export to Excel – Using PIVOT Query)
We want to create a report that contains a list of all cities from our database. For each city, we need to know a number of calls grouped by their outcome.
我们要创建一个报告,其中包含数据库中所有城市的列表。 对于每个城市,我们需要知道根据呼叫结果分组的多个呼叫。
To achieve that, we’ll use the final query from the previous article. This query shall always return all combinations of cities and call outcomes (we’ve used CROSS JOIN to create reporting categories). Also, we’ll be able to pivot by outcome (name), because our query is dynamic (we’re adding outcomes to the pivot part of the query based on the current contents of the dictionary). Therefore, our query shall work in all cases – even if we add new outcomes to the dictionary.
为此,我们将使用上一篇文章中的最终查询。 此查询应始终返回城市和呼叫结果的所有组合(我们已使用CROSS JOIN创建报告类别)。 此外,由于查询是动态的(我们将根据字典的当前内容将结果添加到查询的枢轴部分),因此我们将能够按结果(名称)进行透视。 因此,即使在字典中添加了新的结果,我们的查询也将在所有情况下均有效。
-- 1 -- report (including dynamic PIVOT)
DECLARE
    @columns	NVARCHAR(MAX) = '',
    @query		NVARCHAR(MAX) = '';

-- get all column names for the table we need for pivot
SELECT
    @columns += QUOTENAME(TRIM(co.outcome_text)) + ','
FROM
    call_outcome co
ORDER BY
    co.outcome_text;

-- remove "," from the end of the string
SET @columns = LEFT(@columns, LEN(@columns) - 1);

-- dynamic SQL query
SET @query ='
SELECT * FROM
(
    SELECT
        -- rc.city_id,
        rc.city_name,
        -- rc.call_outcome_id,
        rc.outcome_text,
        rd.call_duration
    FROM
    (
        SELECT
            c.id AS city_id,
            c.city_name,
            co.id AS call_outcome_id,
            co.outcome_text
        FROM call_outcome co
        CROSS JOIN city c
    ) rc

    LEFT JOIN

    (
        SELECT
            ci.id AS city_id,
            co.id AS call_outcome_id,
            DATEDIFF(SECOND, c.start_time, c.end_time) AS call_duration
        FROM call c
        INNER JOIN call_outcome co ON c.call_outcome_id = co.id
        INNER JOIN customer cu ON c.customer_id = cu.id
        INNER JOIN city ci ON cu.city_id = ci.id
    ) rd ON rc.city_id = rd.city_id AND rc.call_outcome_id = rd.call_outcome_id
) report_data
PIVOT(
    COUNT(call_duration)
    FOR outcome_text IN ('+ @columns +')
) AS pivot_table;';

-- execute dynamic query
EXECUTE sp_executesql @query;
Let’s take a look at the query result now. As expected, the result is the pivot table with all the data we need. Now is the time to use SQL Server export to Excel.
现在让我们看一下查询结果。 正如预期的那样,结果是包含我们所需所有数据的数据透视表。 现在是时候使用SQL Server导出到Excel了。
SQL Server is a great tool and it has many addons you could use for specific purposes. Still, one of the frequently used options are to simply copy the SQL Server query result to MS Excel and make desired additional transformations there. The reason for that is that MS Excel provides a variety of options to present data. Some of the most commonly used are tables, pivot tables, many different graph types, etc. Also, you could use MS Excel workbook as a central place where you will gather data from different sources (based on different formats or technologies) and combine them to get an overall insight at your business. One more thing worth mentioning here is that MS Excel is widespread and people are used to working with it. I don’t have an actual statistic related to SQL Server and MS Excel usage, and I guess it would be hard to have actual numbers, so I’ll go with estimations available online. Around 750 million people worldwide use Excel, while in 2019 we had around 26.5 million developers (database developers are a small part of that number).
SQL Server是一个很棒的工具,它具有许多可以用于特定目的的插件。 尽管如此,最常用的选项之一就是简单地将SQL Server查询结果复制到MS Excel并在那里进行所需的其他转换。 原因是MS Excel提供了多种显示数据的选项。 一些最常用的表格,数据透视表,许多不同的图形类型等。此外,您可以将MS Excel工作簿用作中心位置,从不同来源(基于不同格式或技术)收集数据并将其组合全面了解您的业务。 值得一提的是,MS Excel广泛使用,人们已经习惯使用它。 我没有与SQL Server和MS Excel使用有关的实际统计信息,并且我想很难拥有实际数字,因此我将在线提供估计值。 全球约有7.5亿人使用Excel,而在2019年,我们约有2650万开发人员(数据库开发人员只是其中的一小部分)。
After you run the query, you can simply select the whole query result by clicking in the upper left corner (above row numbers and left of the column names). The next thing to do is to select the “Copy with headers” option from the drop-down list.
运行查询后,只需单击左上角(行号上方和列名左侧),即可选择整个查询结果。 下一步是从下拉列表中选择“带标题复制”选项。
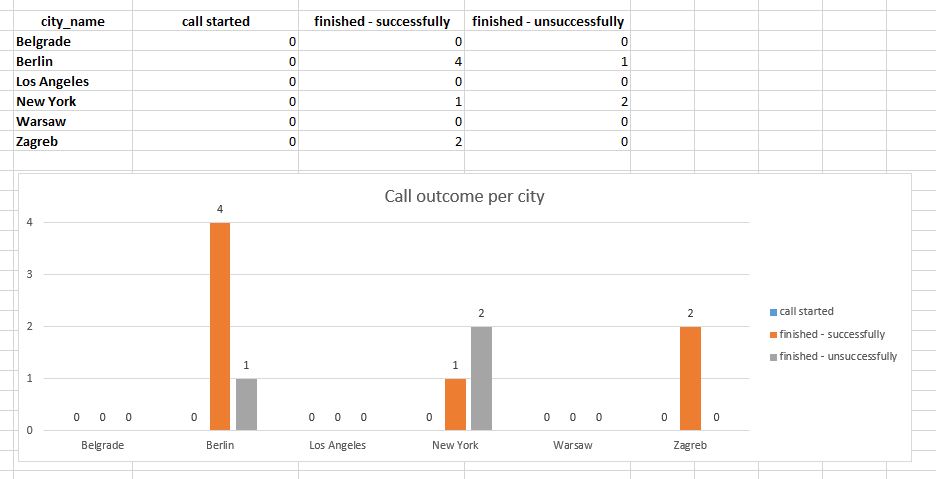
We’ve pasted the query result in the MS Excel worksheet. In real-life examples, we could have more formatting than just applying bold to the categories. The graph below the table with data is prepared and formatted so it will change accordingly changes in the data.
我们已将查询结果粘贴到MS Excel工作表中。 在实际的示例中,我们可以有更多的格式设置,而不仅仅是对类别应用粗体。 带有数据的表格下面的图形已准备好并设置了格式,因此它将相应更改数据中的更改。
There are a few more things we could have done differently here:
在这里,我们可以做其他一些事情:
- We could paste data (pivot table) in a separate worksheet and have the “presentation” worksheet formatted additionally 我们可以将数据(数据透视表)粘贴到单独的工作表中,并另外格式化“演示文稿”工作表
- In case we have more details, we could prepare several different graphs, as well as calculate parameters relevant to our business 如果我们有更多详细信息,我们可以准备几个不同的图形,以及计算与业务相关的参数
I’ve used this approach on real-world data as it enables you to create very complex dashboards after running a few queries. Of course, you’ll spend a lot of time to prepare dashboards (and adjust them accordingly changes in reporting requirements), but once you do that, you’ll profit a lot each time you need to create a new report.
我在现实世界的数据上使用了这种方法,因为它使您可以在运行一些查询后创建非常复杂的仪表板。 当然,您将花费大量时间准备仪表板(并相应地调整它们以更改报表要求),但是一旦这样做,每次需要创建新报表时,您都会受益匪浅。
And even better, this is not only limited to SQL Server export to Excel combination, but you could extract data from different sources (other DBMSs, files, text…) and use your dashboard as a central place to get an overall insight.
甚至更好的是,这不仅限于将SQL Server导出到Excel组合,而且您可以从不同的源(其他DBMS,文件,文本等)中提取数据,并将仪表板用作获取总体见解的中心位置。
SQL Server导出到Excel –无PIVOT查询 (SQL Server export to Excel – Without PIVOT Query)
The final goal of our task is to create a pivot table as well as a graph to visually represent the result. The approach in the previous section was to create a PIVOT table query directly in SQL and paste this query to Excel. There are (at least) 4 good reasons when you won’t always be able to use this approach:
我们任务的最终目标是创建一个数据透视表以及一个图形以直观地表示结果。 上一节中的方法是直接在SQL中创建PIVOT表查询,然后将此查询粘贴到Excel。 至少有4个好的理由使您不能总是使用此方法:
- You have the SQL query ready and you don’t want to waste additional time turning this query into the PIVOT table query, but rather spend that time manipulating the result in the Excel 您已经准备好SQL查询,并且不想浪费额外的时间将此查询转换为PIVOT表查询,而是花时间在Excel中处理结果
- Maybe you don’t use SQL Server (and MS Excel) and your DBMS simply doesn’t support PIVOT table queries (and dynamic queries which is what we need) 也许您不使用SQL Server(和MS Excel),并且您的DBMS根本不支持PIVOT表查询(以及我们所需要的动态查询)
- You want to have data in the raw format because you’ll need it for other purposes as well. Maybe you’ll create more than 1 pivot table from the data returned. Maybe you’ll combine these data with other data directly in Excel 您想要原始格式的数据,因为您也将其用于其他目的。 也许您将根据返回的数据创建多个1个数据透视表。 也许您将直接在Excel中将这些数据与其他数据合并
- You simply don’t know how to create a PIVOT table query in SQL Server but you know how to do it in MS Excel. OK, this is not an excuse, but still, this is a common case in real life 您根本不知道如何在SQL Server中创建PIVOT表查询,但是您知道如何在MS Excel中创建它。 好的,这不是借口,但这仍然是现实生活中的常见情况
Let’s now see what can be done if we go with the option that we don’t use the SQL Server pivot query. Once more we’ll use the query described in the previous article. It’s almost the same as the previous query, with the main difference that we lack the PIVOT part of the query.
现在,让我们看看如果使用不使用SQL Server数据透视查询的选项,该怎么办。 我们将再次使用上一篇文章中描述的查询。 它与先前的查询几乎相同,主要区别在于我们缺少查询的PIVOT部分。
-- 2 -- report categories & data (without pivot)
SELECT
    rc.city_id,
    rc.city_name,
    rc.call_outcome_id,
    rc.outcome_text,
    rd.call_duration
FROM
(
    SELECT
        c.id AS city_id,
        c.city_name,
        co.id AS call_outcome_id,
        co.outcome_text
    FROM call_outcome co
    CROSS JOIN city c
) rc

LEFT JOIN

(
    SELECT
        ci.id AS city_id,
        co.id AS call_outcome_id,
        DATEDIFF(SECOND, c.start_time, c.end_time) AS call_duration
    FROM call c
    INNER JOIN call_outcome co ON c.call_outcome_id = co.id
    INNER JOIN customer cu ON c.customer_id = cu.id
    INNER JOIN city ci ON cu.city_id = ci.id
) rd ON rc.city_id = rd.city_id AND rc.call_outcome_id = rd.call_outcome_id

ORDER BY
    rc.city_id,
    rc.call_outcome_id;
The first step is done. We’ve successfully returned all the data we need. Our result contains all combinations of cities and possible outcomes (we’ve used CROSS JOIN) and one row per each call (NULL where we had no call).
第一步完成。 我们已成功返回所需的所有数据。 我们的结果包含城市和可能结果的所有组合(我们使用了CROSS JOIN)以及每个调用一行(在没有调用的情况下为NULL)。
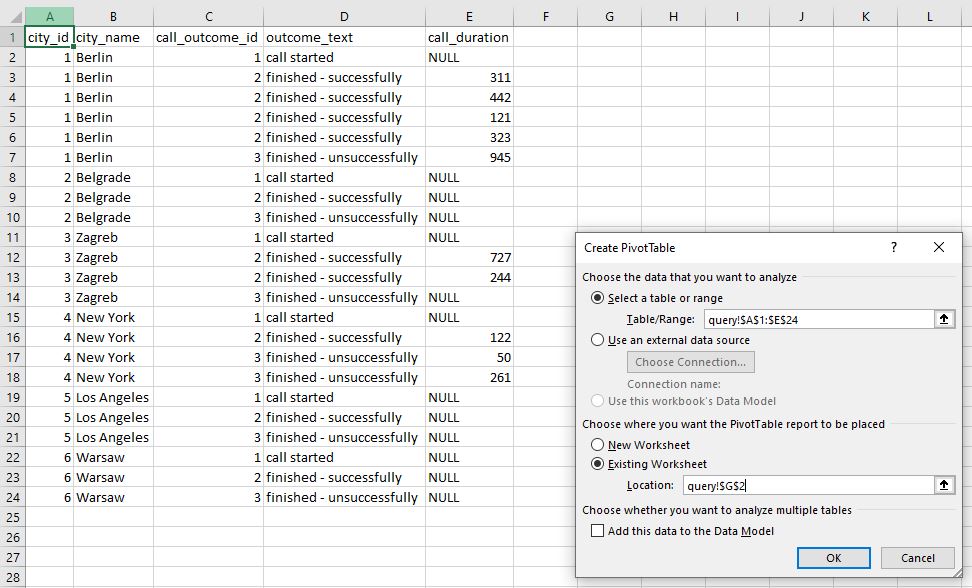
Now we’re ready to create a PIVOT table directly in Excel. After clicking on the “Insert” -> “Pivot Table” (in Tab List and Ribbon) the window like the one on the picture above shall appear. We’ll “Select a table or range” containing the data and the location where we want to place our pivot table (in our case that is “Existing Worksheet”, starting from cell G2).
现在,我们准备直接在Excel中创建PIVOT表。 单击“插入”->“数据透视表”(在选项卡列表和功能区中)后,将显示如上图所示的窗口。 我们将“选择一个表或范围”,其中包含数据以及要放置数据透视表的位置(在本例中为“现有工作表”,从单元格G2开始)。
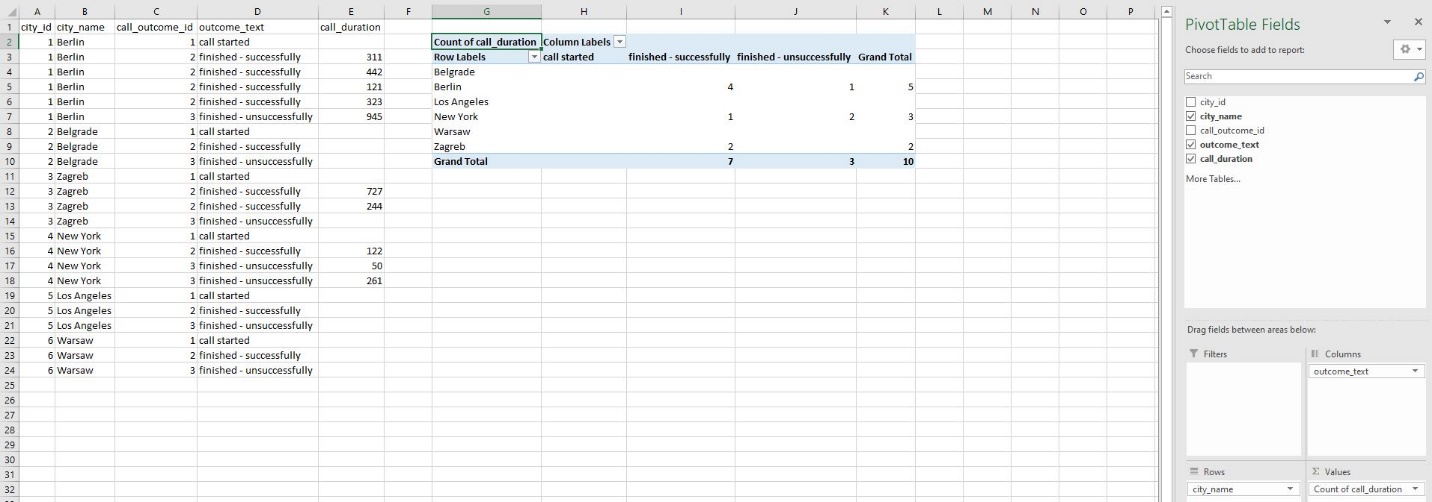
The next thing we did was to define what goes where. City names shall be “Rows” of our table, outcome texts shall go into “Columns” and we’ll count call duration (“Values”). Please notice that in the original table (output), I’ve replaced NULL values in column E, with blank spaces. This is important because the count function shall count 1 if the row contains any non-empty value.
我们要做的下一件事是定义去哪里。 城市名称应为表格的“行”,结果文本应归入“列”,我们将计算通话时间(“值”)。 请注意,在原始表(输出)中,我已将E列中的NULL值替换为空格。 这很重要,因为如果行包含任何非空值,则count函数将计数1。
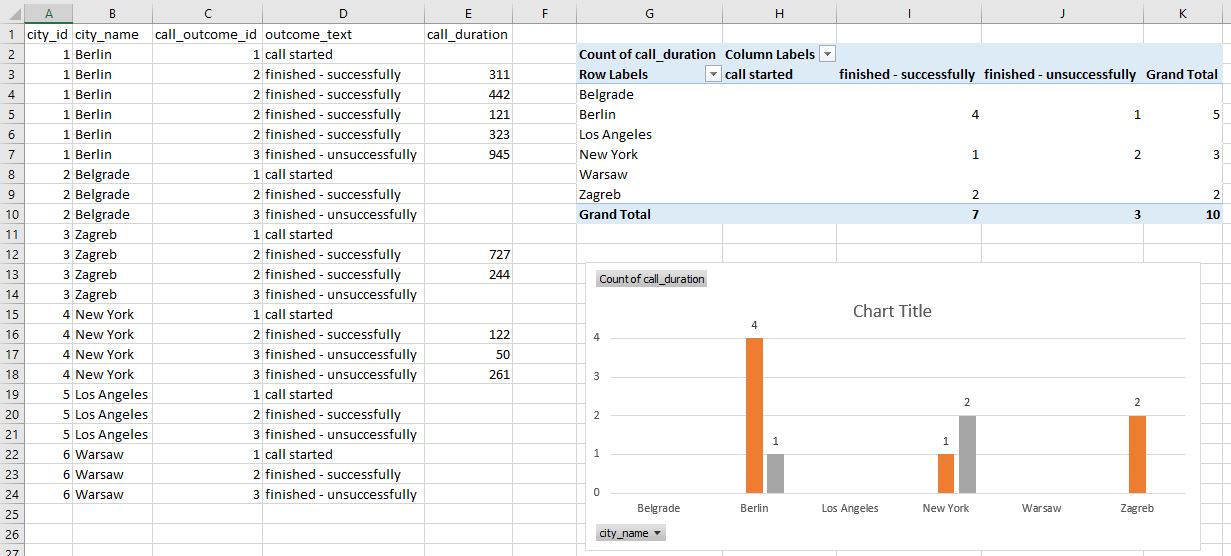
The last thing we’ll do is to create a graph. The data source for our graph is the pivot table created in the previous step. We’ll apply formatting to our graph (graph style, labels, axis, etc.), and we’re done.
我们要做的最后一件事是创建一个图形。 图的数据源是在上一步中创建的数据透视表。 我们将格式应用于图表(图表样式,标签,轴等),然后完成。
This approach could be applied more generally compared to the approach when the pivot table is created directly in SQL Server. And that’s it – we’ve used SQL Server export to Excel to pull data from the database and create a simple dashboard.
与在SQL Server中直接创建数据透视表时相比,可以更普遍地应用此方法。 就是这样–我们已使用SQL Server导出到Excel来从数据库中提取数据并创建一个简单的仪表板。
结论 (Conclusion)
Today we’ve seen how we could combine the powers of SQL Server export to Excel – using the SQL query to grab data, importing it to MS Excel, and making additional changes there. This is something you could easily do for various purposes and the limit is only your imagination (and, of course, business needs). The next step could be automating exports of tables or graphs created in MS Excel, directly to Word or PowerPoint.
今天,我们已经看到了如何结合使用SQL Server导出到Excel的功能-使用SQL查询来获取数据,将其导入到MS Excel,并在那里进行其他更改。 您可以轻松地出于各种目的执行此操作,并且限制仅在于您的想像力(当然还有业务需求)。 下一步可能是自动将在MS Excel中创建的表或图形直接导出到Word或PowerPoint。
目录 (Table of contents)
翻译自: https://www.sqlshack.com/learn-sql-sql-server-export-to-excel/


 2454
2454

 被折叠的 条评论
为什么被折叠?
被折叠的 条评论
为什么被折叠?
 到【灌水乐园】发言


