


 本文详细介绍了如何通过SQL Server错误日志、C2跟踪文件、临时查询和SQL Server Profiler等手动方法,对SQL Server实例进行审核。这些方法涵盖了从登录活动到数据库级别的各种操作,虽然耗时但能提供详细的审核信息。
A SQL Server audit can be performed using various number of methods. This includes using the built-in SQL Server Audit feature, using third party tools from the SQL Server market or simply perform the audit task using the legacy methods manually. In the previous article of this series, SQL Server audit overview, we discussed the main concept of a SQL Server audit, the importance of auditing the SQL Server instance changes and the SQL server audit checklists. In this article, we will go through the manual procedures for auditing the SQL Server instance.
可以使用多种方法来执行SQL Server审核。 这包括使用内置SQL Server审核功能,使用SQL Server市场上的第三方工具,或仅使用旧方法手动执行审核任务。 在本系列的上一篇文章“ SQL Server审核概述”中 ,我们讨论了SQL Server审核的主要概念,审核SQL Server实例更改的重要性以及SQL Server审核清单。 在本文中,我们将介绍审核SQL Server实例的手动过程。
SQL错误日志和C2跟踪文件 (SQL Error Logs and C2 Trace files)
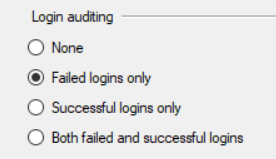
The SQL Server Engine writes number of useful events that can be used to audit the SQL Server instance. For example, the failed logins are audited by default and written to the SQL Server error logs. You can edit both successful and failed logins by changing the default configuration, from the Security tab of the SQL Server instance properties window, as below:
SQL Server引擎写入许多有用的事件,这些事件可用于审核SQL Server实例。 例如,默认情况下将审核失败的登录,并将其写入SQL Server错误日志。 您可以通过从SQL Server实例属性窗口的“ 安全性”选项卡更改默认配置来编辑成功和失败的登录,如下所示:
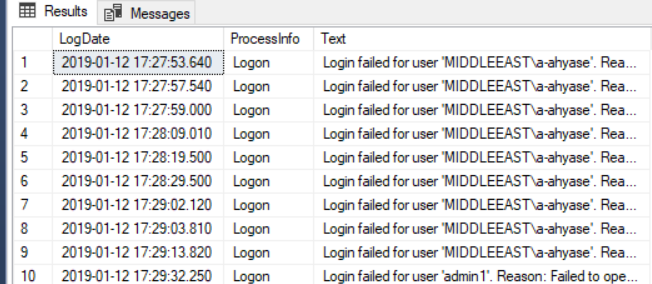
You can easily read the SQL Server error log using SQL Server Management Studio with the customizable query below:
您可以使用SQL Server Management Studio通过以下可自定义的查询轻松读取SQL Server错误日志:
EXEC sp_readerrorlog 0, 1, 'Login failed'
And the result in our case will be as follows:
在我们的案例中,结果将如下所示:
In SQL Server, you can also enable the C2 auditing feature, available since SQL Server 2000, to for a SQL Server audit of all instance and database level activities performed on that instance. This includes the execution of any DDL or DML query and login or logout activities. A C2 SQL Server audit can be enabled by checking the C2 Audit check box from the Security tab of the SQL Server instance properties window then restart the SQL Server service, as shown below:
在SQL Server中,还可以启用C2审核功能(自SQL Server 2000开始可用),以对在该实例上执行的所有实例和数据库级别的活动进行SQL Server审核。 这包括执行任何DDL或DML查询以及登录或注销活动。 可以通过在SQL Server实例属性窗口的“安全性”选项卡中选中“ C2审核”复选框来启用C2 SQL Server审核,然后重新启动SQL Server服务,如下所示:
There are two limitations of the C2 Auditing feature. One is that there is no option to choose what to audit, as it audits everything, and two, there is an issue of where to save the generated TRC files, because they will be automatically saved into the default DATA folder of the installed instance. It is recommended to keep an eye on the generated files, where a new trace file will be created when the size of the current file reaches 200MB. If there is no purging task configured to control these trace files, the database folder may run out of free space.
C2审核功能有两个限制。 一是无法选择要审核的内容,因为它审核了所有内容,二是存在将生成的TRC文件保存在何处的问题,因为它们将自动保存到已安装实例的默认DATA文件夹中。 建议注意生成的文件,当当前文件的大小达到200MB时,将在其中创建新的跟踪文件。 如果没有配置用于控制这些跟踪文件的清除任务,则数据库文件夹可能会用完可用空间。
To perform a SQL Server audit by reading the generated TRC files is a time consuming process, as you need to go through all files generated during the period of time you plan to audit, in order to find the activity, you are interested in. You can imagine the time and effort spent checking the trace files generated from a heavy transactional system.
通过读取生成的TRC文件来执行SQL Server审核是一个耗时的过程,因为您需要遍历计划审核的时间段内生成的所有文件,以便查找活动。可以想象检查由繁重的事务系统生成的跟踪文件所花费的时间和精力。
临时查询 (Ad Hoc Queries)
Each database administrator has a secret library of scripts, that helps them in administrating and monitoring the different aspects of a SQL Server instance. This includes queries used to monitor SQL Server performance and track the activities and changes performed at both the SQL Server and database levels for auditing purposes. The same approach can be used for a SQL Server audit.
每个数据库管理员都有一个秘密的脚本库,可以帮助他们管理和监视SQL Server实例的不同方面。 这包括用于监视SQL Server性能并跟踪SQL Server和数据库级别执行的活动和更改以进行审核的查询。 可以将相同的方法用于SQL Server审核。
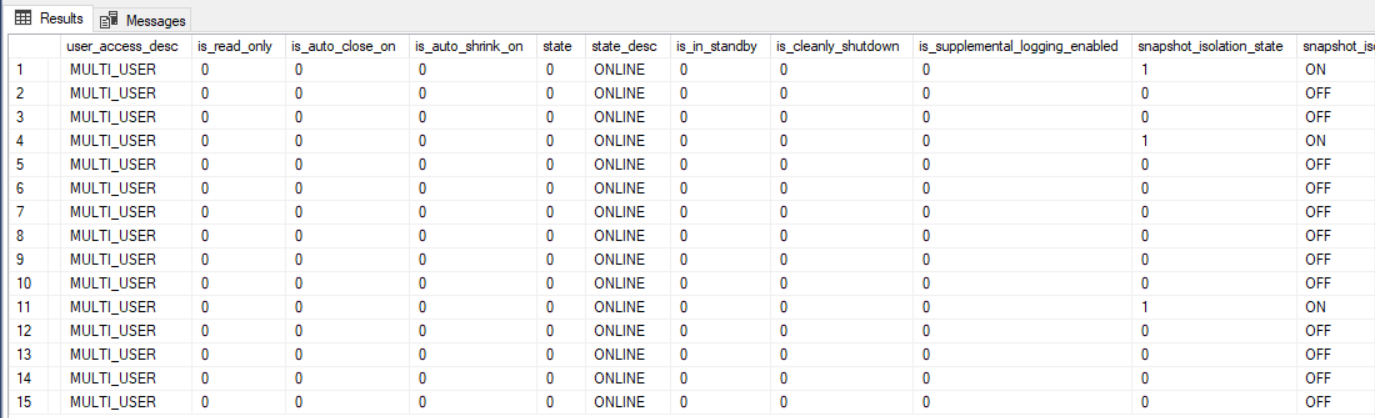
For example, you can run the below query to check all the databases properties on the SQL Server instance, and compare it with your baselines to make sure if there is any change performed on it:
例如,您可以运行以下查询来检查SQL Server实例上的所有数据库属性,并将其与基线进行比较,以确保是否对其执行了任何更改:
USE master
GO
SELECT *
FROM    sys.databases ;
GO
And the result will be as follows:
结果将如下所示:
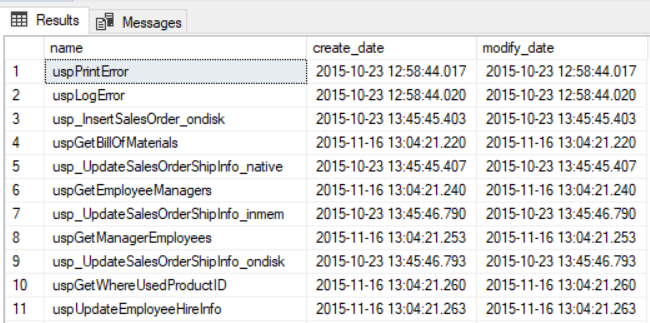
Another example of an ad hoc SQL Server audit query is tracking the changes performed on the database stored procedures. The below query can be used to check the creation date and last modified date for each stored procedure under the selected database:
临时SQL Server审核查询的另一个示例是跟踪对数据库存储过程执行的更改。 以下查询可用于检查所选数据库下每个存储过程的创建日期和最后修改日期:
SELECT name, create_date, modify_date
FROM sys.objects
WHERE type = 'P'
GO
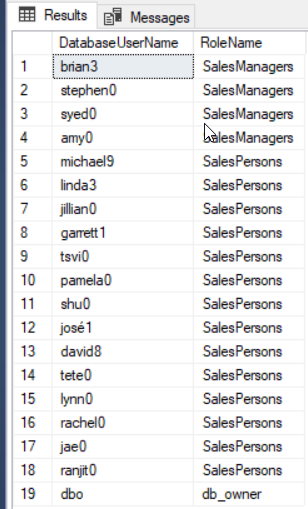
The members of each database role, which is an important part of the SQL Server audit process, can be also listed using the query below:
每个数据库角色的成员(这是SQL Server审核过程的重要组成部分)也可以使用以下查询列出:
SELECT USER_NAME(memberuid) As DatabaseUserName, USER_NAME(groupuid) AS RoleName
FROM   sys.sysmembers
And the result will be as follows:
结果将如下所示:
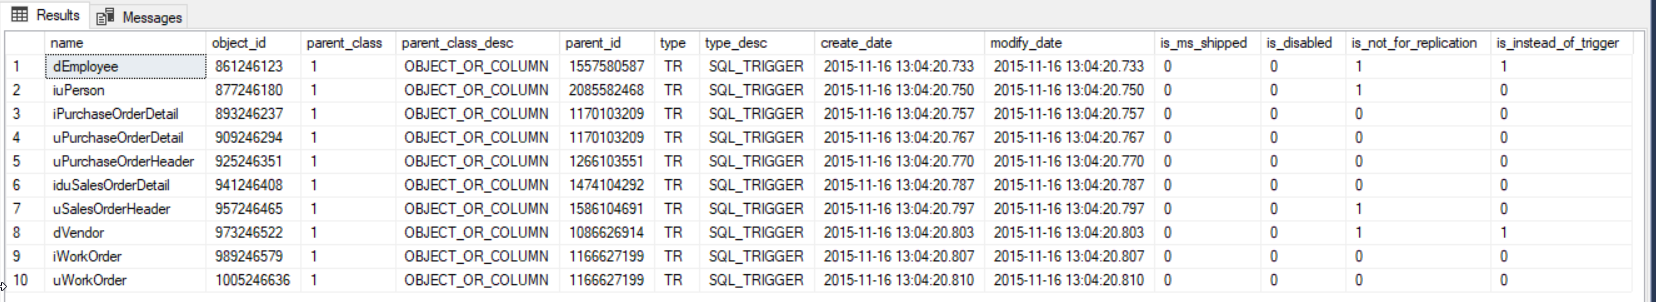
Triggers also should be included in your SQL Server audit in order to monitor if any change is performed on the data before or after any DML or DDL operation and if the data is copied to another place. This can be easily done by listing all existing triggers with its properties, using the script below:
SQL Server审核中还应包含触发器,以监视是否在任何DML或DDL操作之前或之后对数据执行了任何更改,以及是否将数据复制到了另一个位置。 通过使用以下脚本列出所有现有触发器及其属性,可以轻松完成此操作:
select * from sys.triggers
The result in our case will be as follows:
在我们的案例中,结果将如下所示:
At the SQL Server instance level, you can audit different aspects using T-SQL queries. For example, the last restart for the SQL Server service can be retrieved using the simple query below:
在SQL Server实例级别,您可以使用T-SQL查询审核不同方面。 例如,可以使用以下简单查询来检索SQL Server服务的上一次重新启动:
SELECT sqlserver_start_time FROM sys.dm_os_sys_info
And the result will be as follows:
结果将如下所示:
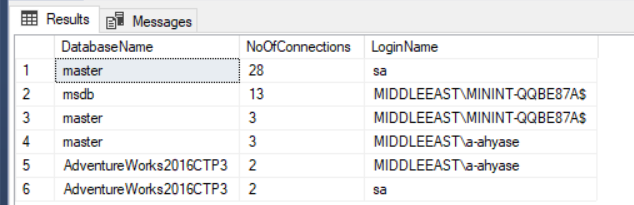
The opened sessions on the SQL Server instance can be also listed using the query below:
也可以使用以下查询列出在SQL Server实例上打开的会话:
SELECT db_name(dbid) AS DatabaseName, count(dbid) AS NoOfConnections,
loginame as LoginName
FROM sys.sysprocesses
WHERE dbid > 0
GROUP BY dbid, loginame
order by NoOfConnections desc
The result in our case will be as follows:
在我们的案例中,结果将如下所示:
If you are interested in including the TCP port and the IP address of the active connected sessions in your SQL Server audit, the below query will help:
如果您有兴趣在SQL Server审核中包括TCP端口和活动连接的会话的IP地址,则以下查询将有所帮助:
SELECT local_tcp_port,session_id,connect_time,client_net_address
FROM sys.dm_exec_connections
WHERE local_tcp_port <> 50000
order by connect_time desc
With no result in my scenario, as below:
在我的方案中没有任何结果,如下所示:
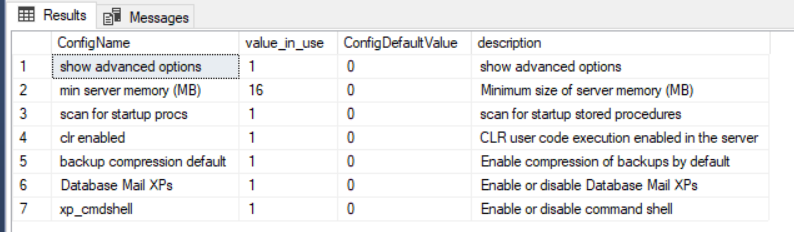
The below query also can be used to audit the changes in the SQL Server default configurations:
以下查询还可以用于审核SQL Server默认配置中的更改:
DECLARE @DefaultconfigValues TABLE (
    ConfigName nvarchar(35),
    ConfigDefaultValue sql_variant
)

INSERT INTO @DefaultconfigValues (ConfigName, ConfigDefaultValue) VALUES
('access check cache bucket count',0),
('access check cache quota',0),
('Ad Hoc Distributed Queries',0),
('affinity I/O mask',0),
('affinity64 I/O mask',0),
('affinity mask',0),
('affinity64 mask',0),
('Agent XPs',1),
('allow updates',0),
('awe enabled',0),
('backup compression default',0),
('blocked process threshold (s)',0),
('c2 audit mode',0),
('clr enabled',0),
('common criteria compliance enabled',0),
('contained database authentication', 0),
('cost threshold for parallelism',5),
('cross db ownership chaining',0),
('cursor threshold',-1),
('Database Mail XPs',0),
('default full-text language',1033),
('default language',0),
('default trace enabled',1),
('disallow results from triggers',0),
('EKM provider enabled',0),
('filestream access level',0),
('fill factor (%)',0),
('ft crawl bandwidth (max)',100),
('ft crawl bandwidth (min)',0),
('ft notify bandwidth (max)',100),
('ft notify bandwidth (min)',0),
('index create memory (KB)',0),
('in-doubt xact resolution',0),
('lightweight pooling',0),
('locks',0),
('max degree of parallelism',0),
('max full-text crawl range',4),
('max server memory (MB)',2147483647),
('max text repl size (B)',65536),
('max worker threads',0),
('media retention',0),
('min memory per query (KB)',1024),
('min server memory (MB)',0),
('nested triggers',1),
('network packet size (B)',4096),
('Ole Automation Procedures',0),
('open objects',0),
('optimize for ad hoc workloads',0),
('PH timeout (s)',60),
('precompute rank',0),
('priority boost',0),
('query governor cost limit',0),
('query wait (s)',-1),
('recovery interval (min)',0),
('remote access',1),
('remote admin connections',0),
('remote login timeout (s)',10),
('remote proc trans',0),
('remote query timeout (s)',600),
('Replication XPs',0),
('scan for startup procs',0),
('server trigger recursion',1),
('set working set size',0),
('show advanced options',0),
('SMO and DMO XPs',1),
('SQL Mail XPs',0),
('transform noise words',0),
('two digit year cutoff',2049),
('user connections',0),
('user options',0),
('Web Assistant Procedures', 0),
('xp_cmdshell',0)

SELECT SysConfig.name AS ConfigName, SysConfig.value_in_use, DefConfig.ConfigDefaultValue , SysConfig.description
FROM sys.configurations SysConfig
INNER JOIN @DefaultconfigValues DefConfig ON SysConfig.name = DefConfig.ConfigName
WHERE SysConfig.value <> SysConfig.value_in_use
OR SysConfig.value_in_use <> DefConfig.ConfigDefaultValue
GO
And the list of changed configurations will be as follows:
更改的配置列表如下:
You can see that SQL Server provides us with large number of ad hoc queries that can be used for SQL Server instance level and database level audit purposes. Auditing the SQL Server instances manually by executing the T-SQL ad ho queries is a time-consuming auditing process and not easy to cover all possible auditing events. In addition, you can automate that auditing method by combining it with other reporting tools, or simply the SQL Server Reporting Service, to receive the auditing reports periodically and automatically without the need to run it manually by the database administrator. For low budget auditing projects, it is a good option.
您可以看到,SQL Server为我们提供了大量可用于SQL Server实例级别和数据库级别审核目的的临时查询。 通过执行T-SQL ad ho查询手动审核SQL Server实例是一个耗时的审核过程,并且不容易涵盖所有可能的审核事件。 另外,您可以通过将该审计方法与其他报告工具(或简单地与SQL Server Reporting Service组合)进行自动化,以定期自动接收审计报告,而无需数据库管理员手动运行它。 对于预算较低的审计项目,这是一个不错的选择。
SQL事件探查器 (SQL Profiler)
SQL Server Profiler can be used to monitor the performance of the queries and tune them to enhance query performance. In addition, it can be used to audit the different activities at the SQL Server instance and database levels. With the large variety of events, properties and filters available in the SQL Profiler, you can easily use it to audit who is logging to the SQL Server, from which machine and what activities done by a specific user:
SQL Server Profiler可用于监视查询的性能并对其进行调整以增强查询性能。 此外,它还可用于审核SQL Server实例和数据库级别的不同活动。 通过SQL事件探查器中可用的各种事件,属性和筛选器,您可以轻松地使用它来审核谁正在登录SQL Server,特定用户从哪台计算机进行了哪些活动以及进行了哪些活动:
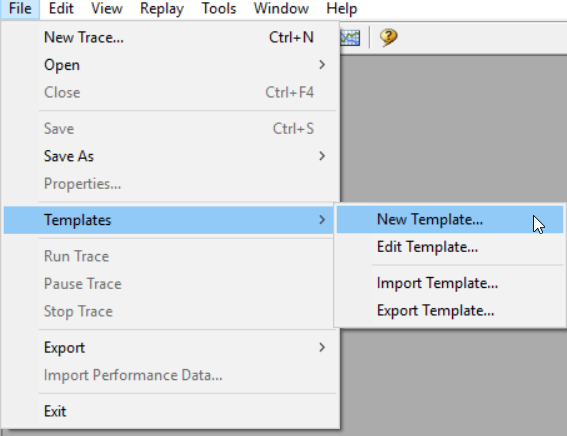
For example, to audit the events of adding the server logins and the database users on a SQL Server instance, you can edit the events of an existing template, or add a new template that you can use it directly for SQL Server audit purposes. To add a new template, choose the New Template option from the Templates list of the File menu, as shown below:
例如,要审核在SQL Server实例上添加服务器登录名和数据库用户的事件,您可以编辑现有模板的事件,或添加新模板,您可以将其直接用于SQL Server审核目的。 要添加新模板,请从“文件”菜单的“模板”列表中选择“ 新建模板”选项,如下所示:
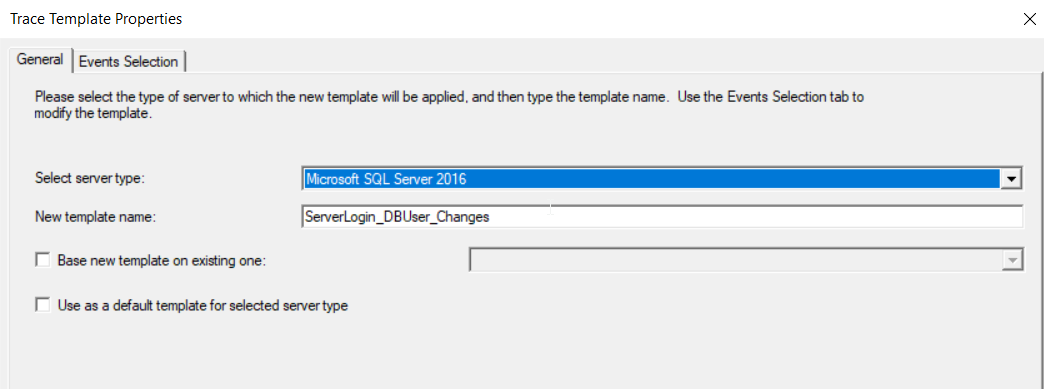
In the General tab of the New Template, choose the type of the SQL Server on which this template applies to and the name of the customized name, as below:
在“新模板”的“ 常规”选项卡中,选择此模板应用于SQL Server的类型以及自定义名称的名称,如下所示:
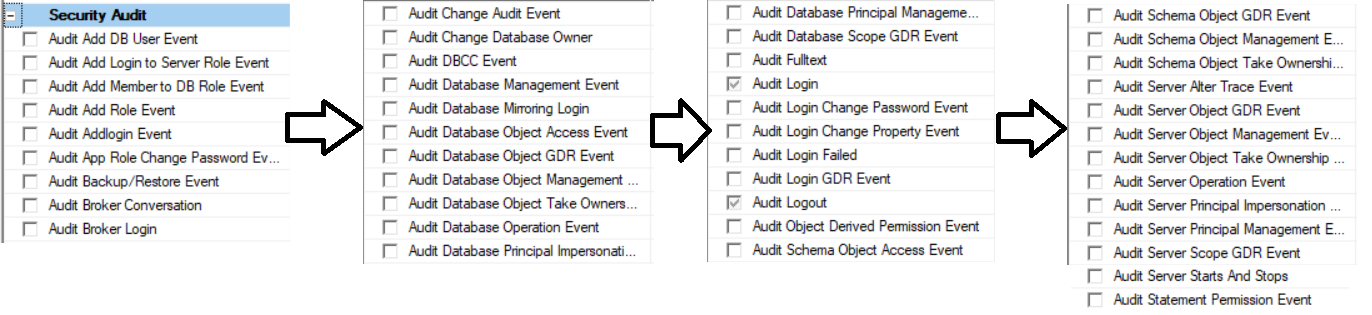
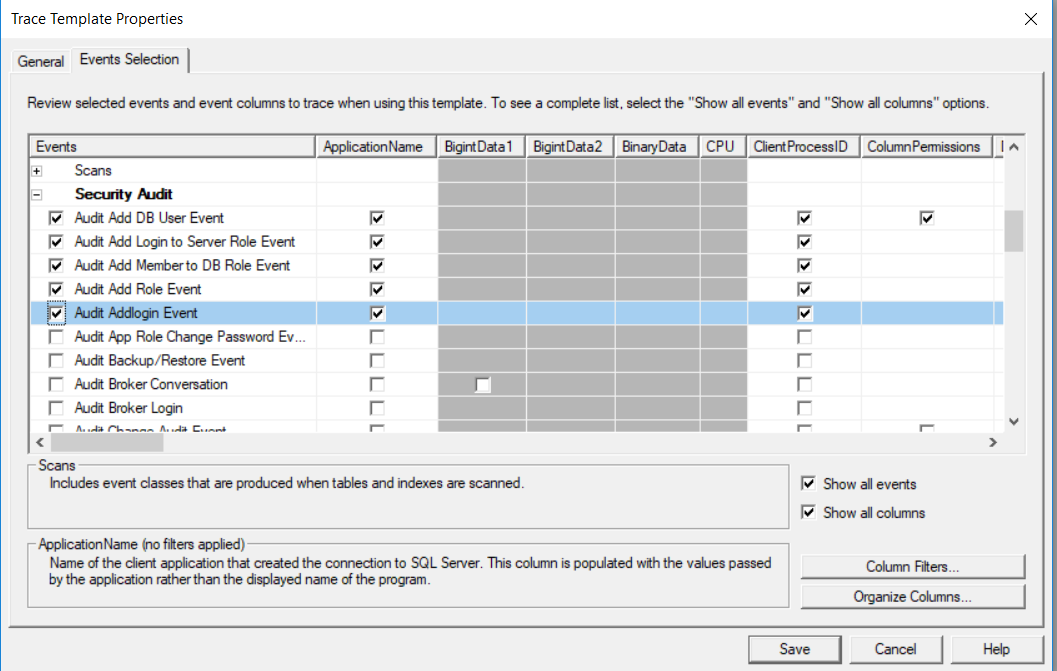
In the Events Selection tab, choose the events that you are interested in and the retrieved properties for each event. In our example, we will audit the events related to adding a sever login, database user or role, under the Security Audit events category. To create the template, click on the Save button, as shown below:
在“ 事件选择”选项卡中,选择您感兴趣的事件以及每个事件的检索属性。 在我们的示例中,我们将在“ 安全审核事件”类别下审核与添加服务器登录名,数据库用户或角色有关的事件。 要创建模板,请单击“ 保存”按钮,如下所示:
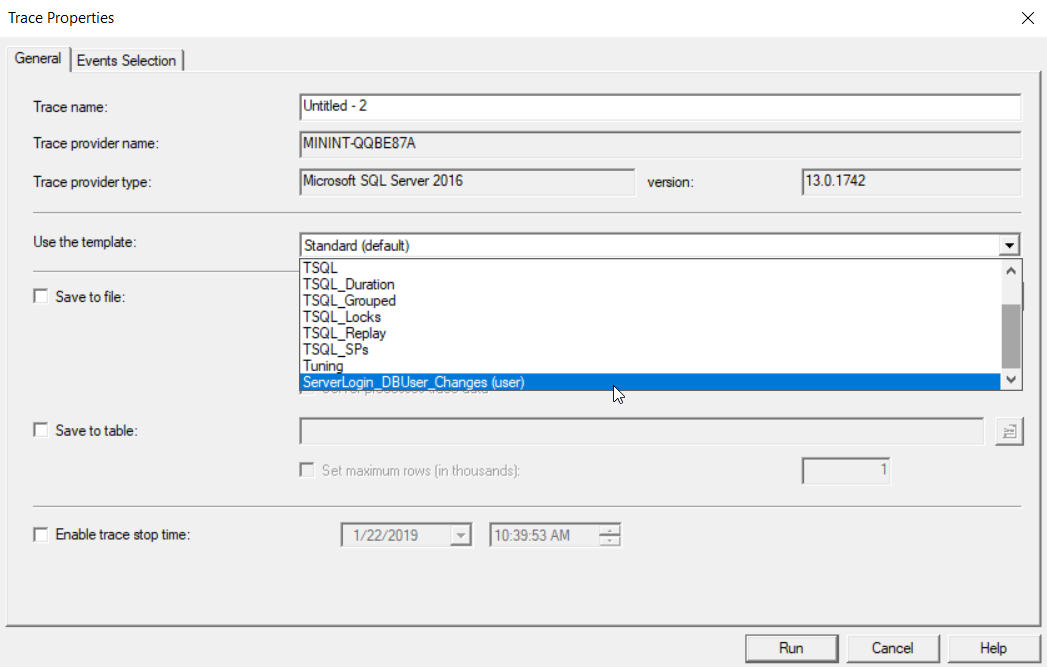
To use the new template for auditing the server logins and database users’ changes, open a new tracing session on the SQL Profiler, and select the new template from the available templates list, as shown below:
要使用新模板审核服务器登录名和数据库用户的更改,请在SQL Profiler上打开一个新的跟踪会话,然后从可用模板列表中选择新模板,如下所示:
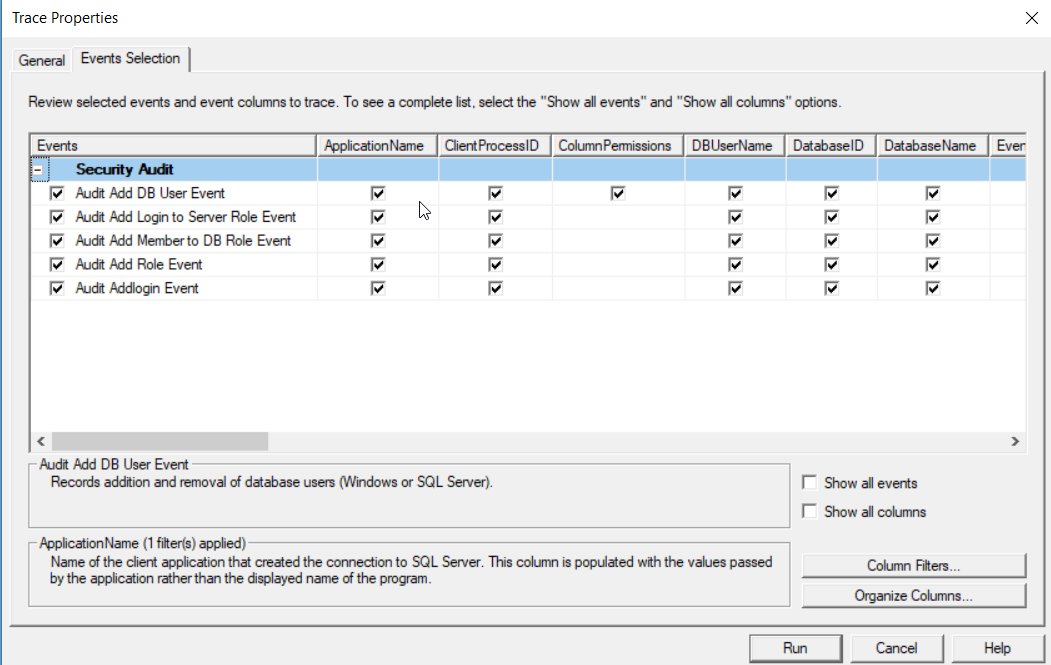
From the Events Selection tab, you can review the default events and properties of that custom template, and add a filter to trace a specific database, server or user. Click on the Run button to start the session, as shown below:
在“事件选择”选项卡中,您可以查看该自定义模板的默认事件和属性,并添加过滤器以跟踪特定的数据库,服务器或用户。 单击运行按钮以开始会话,如下所示:
On SQL Server Management Studio, run the below query that creates a new server login, add the login to an existing server role, create a database user for that login and grant it permission on a specific database, as below:
在SQL Server Management Studio上,运行以下查询以创建新的服务器登录名,将登录名添加到现有服务器角色,为该登录名创建数据库用户并授予其对特定数据库的权限,如下所示:
USE [master]
GO
CREATE LOGIN [test] WITH PASSWORD=N'123123', DEFAULT_DATABASE=[master], CHECK_EXPIRATION=OFF, CHECK_POLICY=OFF
GO
ALTER SERVER ROLE [serveradmin] ADD MEMBER [test]
GO
USE [AdventureWorks2016CTP3]
GO
CREATE USER [test] FOR LOGIN [test]
GO
USE [AdventureWorks2016CTP3]
GO
ALTER ROLE [db_datareader] ADD MEMBER [test]
GO
USE [AdventureWorks2016CTP3]
GO
ALTER ROLE [db_datawriter] ADD MEMBER [test]
GO
USE [AdventureWorks2016CTP3]
GO
ALTER ROLE [db_owner] ADD MEMBER [test]
GO
On the SQL Profiler trace, you will see that all these events are captured in the opened session, as shown below:
在SQL Profiler跟踪上,您将看到所有这些事件都在打开的会话中捕获,如下所示:
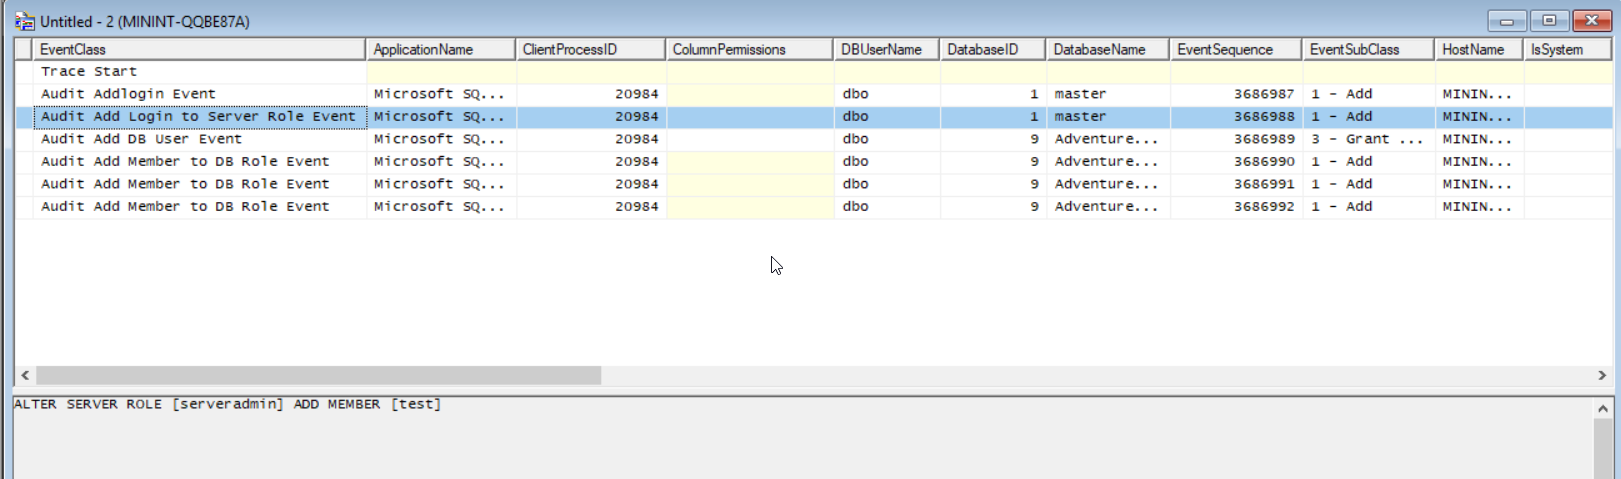
Auditing the SQL Server instance using the SQL Profiler is a great option, especially when the events and properties are selected properly and filtered to collect the requested information only. This will help minimizing the size of generated trace file and making it easier to analyze the events. The trace also can be written to a specified database table for future analysis.
使用SQL事件探查器审核SQL Server实例是一个不错的选择,尤其是在正确选择事件和属性并进行过滤以仅收集所请求的信息时。 这将有助于最小化生成的跟踪文件的大小,并使分析事件更加容易。 跟踪也可以写入指定的数据库表中,以供将来分析。
SQL Server Profiler cannot be considered as a long-term auditing solution though, as it will be eventually deprecated by Microsoft. But the happy news is that it can be easily replaced by a most powerful feature, called Extended Events that will be covered in the next article.
但是,不能将SQL Server Profiler视为长期审核解决方案,因为Microsoft最终会弃用它。 但令人欣喜的是,它可以很容易地被称为扩展事件的最强大功能所取代,该功能将在下一篇文章中介绍。
目录 (Table of contents)
翻译自: https://www.sqlshack.com/implementing-a-manual-sql-server-audit/


 2965
2965

 被折叠的 条评论
为什么被折叠?
被折叠的 条评论
为什么被折叠?
 到【灌水乐园】发言


