


ssis行计数变量
SSIS性能计数器 (SSIS performance counters)
Although there is no real standardized classification of SQL Server Integration Services performance counters, the two main types are:
尽管没有真正SQL Server Integration Services性能计数器的标准化分类,但是两种主要类型是:
SSIS Service performance counters, which are the main topic of this article, and
SSIS服务性能计数器 ,这是本文的主要主题,以及
SSIS Pipeline performance counters, which regard the processes around package execution, management and specific data flow engine options.
SSIS管道性能计数器 ,用于围绕程序包执行,管理和特定数据流引擎选项的流程。
SSIS服务性能计数器 (SSIS Service performance counters )
SSIS Service performance counters are system-obtained registers that include CPU, logical disks and memory usage, or simply, the hardware activities that involve SSIS service as a main process. These counters are strictly dependent on the hardware resources which SQL Server, with active Integration Services service, is using, but also can show the data trace of SSIS data workflow itself, while reading/writing to disk resources. Some of the SSIS performance counters are more important for analyzing, because they show memory consumption during processing. Therefore, monitoring these resources is crucial, in order to prevent CPU/storage/memory overriding/leaking and to pre-empt potential issues that can slow down or interrupt a normal data flow.
SSIS服务性能计数器是系统获得的寄存器,包括CPU,逻辑磁盘和内存使用情况,或者简单地讲,涉及将SSIS服务作为主要过程的硬件活动。 这些计数器严格取决于具有活动Integration Services服务SQL Server正在使用的硬件资源,但在读取/写入磁盘资源时,它们也可以显示SSIS数据工作流本身的数据跟踪。 一些SSIS性能计数器对于分析更重要,因为它们显示处理期间的内存消耗。 因此,监视这些资源至关重要,以防止CPU /存储/内存覆盖/泄漏,并防止可能减慢或中断正常数据流的潜在问题。
Informally, there are three groups of SSIS Service performance counters: 1) CPU, 2) Logical disks and 3) Memory performance counters.
非正式地,有三组SSIS服务性能计数器:1)CPU,2)逻辑磁盘和3)内存性能计数器。
CPU performance counters
CPU性能计数器
Processor Time (Total): indicates actual amount of time which the processor is allocating two Windows processes (sqlservr.exe and dtexec.exe, SQL Server instance and Integration Services Utility instance respectively), while packages execution tasks are simultaneously operating. There are several subtypes of this particular counter, but this is mentioned for monitoring SSIS in general, because it summarizes and aggregates all the aspects of processor usage.
处理器时间(总计) :指示处理器分配两个Windows进程( sqlservr.exe和dtexec.exe, SQL Server的实际时间) 实例和Integration Services Utility实例),而程序包执行任务同时运行。 该特定计数器有几种子类型,但是通常会在监视SSIS时提到它,因为它总结并汇总了处理器使用的所有方面。
Logical disks performance counters
逻辑磁盘性能计数器
Note: The logical disk is a virtual volume consisted of physical storage partitions, which provides a wider area for reading/writing data.
注意 :逻辑磁盘是由物理存储分区组成的虚拟卷,它为读取/写入数据提供了更大的区域。
Disk Read Bytes/sec: calculates the speed of reading/moving data from the logical disk or disks.
磁盘读取字节数/秒 :计算从一个或多个逻辑磁盘读取/移动数据的速度。
Average Disk Bytes/Read: indicates the average speed of reading/moving data from the logical disk or disks.
平均磁盘字节数/读取 :指示从一个或多个逻辑磁盘读取/移动数据的平均速度。
Disk Writes Bytes/sec: calculates the speed of writing data from the logical disk or disks.
磁盘写入字节数/秒 :计算从一个或多个逻辑磁盘写入数据的速度。
Average Disk Bytes/Write: indicates the average speed of writing data from the logical disk or disks.
平均磁盘字节数/写入 :指示从一个或多个逻辑磁盘写入数据的平均速度。
Disk Queue Length: this performance counter matters when it comes to disk overload, and it indicates the amount of non-processed transactions in waiting. Disk Queue Length was more relevant when most SQL servers were running from local systems with limited resources (physical disks, small RAM e.g.), but it is still helpful when executing large packages and it is needed to see any performance pressures in the execution process.
磁盘队列长度 :此性能计数器在磁盘过载时很重要,它指示等待中的未处理事务量。 当大多数SQL Server从资源有限的本地系统(例如物理磁盘,较小的RAM)运行时,“磁盘队列长度”更为相关,但是在执行大程序包时仍然有用,并且需要查看执行过程中的任何性能压力。
Memory performance counters
内存性能计数器
The most important SSIS related performance counters are memory-related. The reason is simple: although SSIS processes acquire some of the logical disk resources, while reading from the source and writing to the destination, they rely heavily on system memory, physical or virtual.
与SSIS相关的最重要的性能计数器与内存相关。 原因很简单:尽管SSIS进程获取了一些逻辑磁盘资源,但在从源读取并写入目标时,它们仍然严重依赖物理或虚拟系统内存。
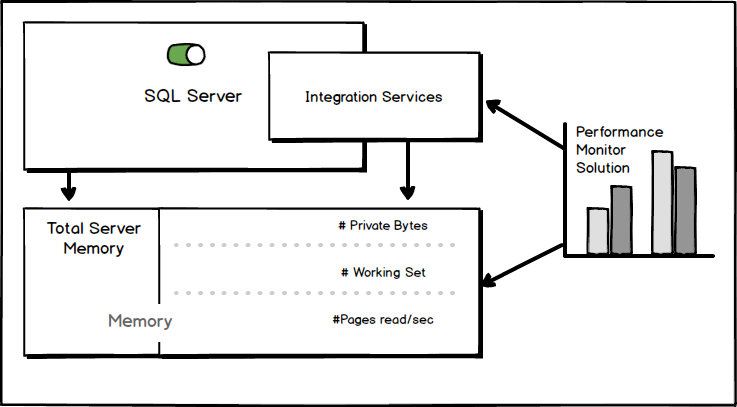
To help illustrate this better, the image below shows the relations between the elements and what is happening “under the hood” when Integration Services service is running.
为了更好地说明这一点,下图显示了元素与运行Integration Services服务时“幕后”所发生的事情之间的关系。
As can be seen, memory is virtually “occupied” by four performance counters: Total Server Memory (which relates to SQL Server process), and three performance counters which regards the Integration Services process: Private Bytes, Working Set and Pages Read/sec. Interaction of these two processes can be monitored through Processor Time (Total) performance counter. The Performance Monitor solution is a theoretical application which is tracing all of these calculations and graphically represents them according to the monitored sources.
可以看出,内存实际上是由四个性能计数器“占用”的: 服务器总内存 (与SQL Server进程有关),和三个与Integration Services进程有关的性能计数器: 专用字节 , 工作集和页面读取/秒 。 可以通过“ 处理器时间(总)”性能计数器监视这两个进程的交互。 性能监视器解决方案是一种理论应用程序,它可以跟踪所有这些计算并根据监视的源以图形方式表示它们。
The details about each of the performance counter are as follows:
有关每个性能计数器的详细信息如下:
Private Bytes (dtexec.exe): it indicates the actual amount of memory, including pagefile usage, specifically allocated by the Integration Services service process. The Private Bytes performance counter acquires memory resources only for a dedicated process, and it cannot be shared. The dtexec.exe process should be in normal priority, otherwise the SSIS workflow could be interrupted or slowed down.
专用字节(dtexec.exe) :它指示由Integration Services服务进程专门分配的实际内存量,包括页面文件使用率。 专用字节性能计数器仅为专用进程获取内存资源,并且不能共享。 dtexec.exe进程应具有通常的优先级,否则SSIS工作流可能会中断或减慢。
Working Set (dtexec.exe): this performance counter is similar to the Private bytes, but it shows the full amount of physical memory allocated by the Integration Services service process. Memory consumption of the dtexec.exe process can range from 2GB (32-bit SSIS service process on 32-bit system, or 64-bit SSIS service process on 64-bit system) to 4 GB (32-bit SSIS service process on 64-bit system) in full capacity. The Working set performance counter’s resources can be allocated by other process.
工作集(dtexec.exe) :此性能计数器类似于专用字节,但是它显示了Integration Services服务进程分配的全部物理内存。 dtexec.exe进程的内存消耗范围从2GB(32位系统上的32位SSIS服务进程,或64位系统上的64位SSIS服务进程)到4 GB(64位上的32位SSIS服务进程)位系统)。 工作集性能计数器的资源可以由其他进程分配。
Total Server Memory (sqlservr.exe): it indicates a full volume of memory allocated by SQL Server instance only. This process can overwhelm RAM, which could interrupt the flow of the other processes, unless it has a configured limitation.
服务器总内存(sqlservr.exe) :它表示仅由SQL Server实例分配的全部内存。 除非有配置的限制 ,否则此进程可能使RAM瘫痪,这可能会中断其他进程的流程。
Page Reads/sec: this performance counter shows the total amount of memory pressure on the system. It accesses file data (in a form of pagefiles) for applications (in this case, dtexec.exe) by resolving memory references (like cache memory) for those pagefiles which are not present at that moment in the memory. High values of this performance counter does not reflect the true reason of high memory pressure – various counters can be the real cause of overloading, and it is case-related. One case could be, if Page reads/sec counter frequently shows value beneath 500/sec for SSIS service instance, the system is pressurized.
页面读取数/秒 :此性能计数器显示系统上的内存压力总量。 它通过解析当时在内存中不存在的那些页面文件的内存引用(如高速缓存)来访问应用程序(在本例中为dtexec.exe)的文件数据(以页面文件的形式)。 该性能计数器的高值并不反映内存压力高的真正原因-各种计数器可能是导致过载的真正原因,并且与大小写有关。 一种情况可能是,如果SSIS服务实例的Page reads / sec计数器的值经常显示低于500 / sec,则系统处于加压状态。
有用的链接: (Useful links:)
- SQL Server processor performance metrics – Part 1 – the most important CPU metrics SQL Server处理器性能指标–第1部分–最重要的CPU指标
- SQL Server memory performance metrics – Part 1 – Memory pages/sec and Memory page faults/sec SQL Server内存性能指标–第1部分–内存页/秒和内存页故障/秒
- Top 10 SQL Server Integration Services Best Practices 十大SQL Server集成服务最佳实践
翻译自: https://www.sqlshack.com/ssis-service-performance-counter-guide/
ssis行计数变量


 5016
5016


 被折叠的 条评论
为什么被折叠?
被折叠的 条评论
为什么被折叠?
 到【灌水乐园】发言


