


 本文详细介绍了如何在Azure Data Studio中查看查询的估计和实际执行计划。通过图形化和XML格式,数据库管理员可以更好地分析和解决查询性能问题。文章还提到了Azure Data Studio的其他功能,如查看最耗时的操作,以及使用`Run Current Query with Actual Plan`命令获取实际执行计划。
This article gives an overview of viewing execution plans in the Azure Data Studio.
本文概述了在Azure Data Studio中查看执行计划。
介绍 (Introduction)
Database administrators use a query execution plan for troubleshooting query performance issues. Suppose one day a user calls you and says my query is running slow. You might perform several checks such as blocking, deadlock, CPU, memory, IO utilization, waits etc. You can also capture the query execution plan to check the overall flow of the query internally. You get detailed information in the plan.
数据库管理员使用查询执行计划来解决查询性能问题。 假设某天某用户打电话给您,并说我的查询运行缓慢。 您可能会执行一些检查,例如阻塞,死锁,CPU,内存,IO利用率,等待等。您还可以捕获查询执行计划,以在内部检查查询的总体流程。 您将在计划中获得详细信息。
We can get two formats of a query execution plan:
我们可以获得查询执行计划的两种格式:
Graphical: it gives a graphical representation of all operators, their properties, tooltip information. We can interpret results quickly in a graphical format
图形化:它以图形方式表示所有操作员,其属性和工具提示信息。 我们可以以图形格式快速解释结果
XML format: It shows a query plan in an XML format. It gives detailed information, but you should be an experienced DBA to understand it
XML格式:它以XML格式显示查询计划。 它提供了详细的信息,但是您应该是有经验的DBA才能理解它
You can check out the following articles to get a detailed knowledge of execution plans.
您可以查看以下文章以获得执行计划的详细知识。
- SQL Server Execution Plans overview SQL Server执行计划概述
- How to Analyze SQL Execution Plan Graphical Components 如何分析SQL执行计划图形组件
SQL Server provides the following types of query plans:
SQL Server提供以下类型的查询计划:
- Estimated execution plan: SQL Server generates the query plan without actually executing the query 估计执行计划 :SQL Server生成查询计划,而无需实际执行查询
- Actual execution plan: It is an actual representation of a query plan that SQL Server generates by executing the query 实际执行计划:这是SQL Server通过执行查询生成的查询计划的实际表示。
You can go through SQL Server Execution Plans types for comparison of an estimated and actual query plan. Usually, DBA uses SQL Server Management Studio or third-party tools such as ApexSQL Plan to check query plans.
您可以浏览SQL Server执行计划类型,以比较估计的查询计划和实际的查询计划。 通常,DBA使用SQL Server Management Studio或第三方工具(例如ApexSQL Plan)来检查查询计划。
Azure Data Studio is a new tool from Microsoft that you can install on Linux as well. It also provides several useful features such as code snippets, Integrated terminals (SSH and PowerShell), extensions, query charts, various results format, server dashboard. SQLShack has many useful articles for Azure Data Studio.
Azure Data Studio是Microsoft的新工具,也可以在Linux上安装。 它还提供了一些有用的功能,例如代码段,集成终端(SSH和PowerShell),扩展,查询图表,各种结果格式,服务器仪表板。 SQLShack有许多有关Azure Data Studio的有用文章。
Suppose you are using Azure Data Studio and you need to view both estimated and actual query plans. Do we have a way to check a query plan in ADS? Does it provide any additional features in comparison with SSMS plans? Let’s check it out.
假设您正在使用Azure Data Studio,并且需要查看估计和实际查询计划。 我们是否可以检查ADS中的查询计划? 与SSMS计划相比,它是否提供任何其他功能? 让我们来看看。
You should install Azure Data Studio’s latest release before going through this article. Launch URL, choose your platform and download installer. You can also use the Windows user installer (recommended) because it does not require a user with administrative rights.
在阅读本文之前,您应该安装Azure Data Studio的最新版本。 启动URL ,选择您的平台并下载安装程序。 您也可以使用Windows用户安装程序(推荐),因为它不需要具有管理权限的用户。
Launch ADS and connect to a SQL Server instance. In this article, I am using the [AdventureWorks] sample database.
启动ADS并连接到SQL Server实例。 在本文中,我正在使用[AdventureWorks]示例数据库。
Expand the database and right-click on [HumanResources].[vEmployee] view to select the top 1000 rows using the highlighted option below.
展开数据库,然后右键单击[HumanResources]。[vEmployee]视图,使用下面的突出显示的选项选择前1000行。
It executes the query, and you get results in a grid format, as shown below.
它执行查询,并以网格格式获得结果,如下所示。
In the Query menu, click on the Explain option at the top of the query window.
在查询菜单中,单击查询窗口顶部的解释选项。
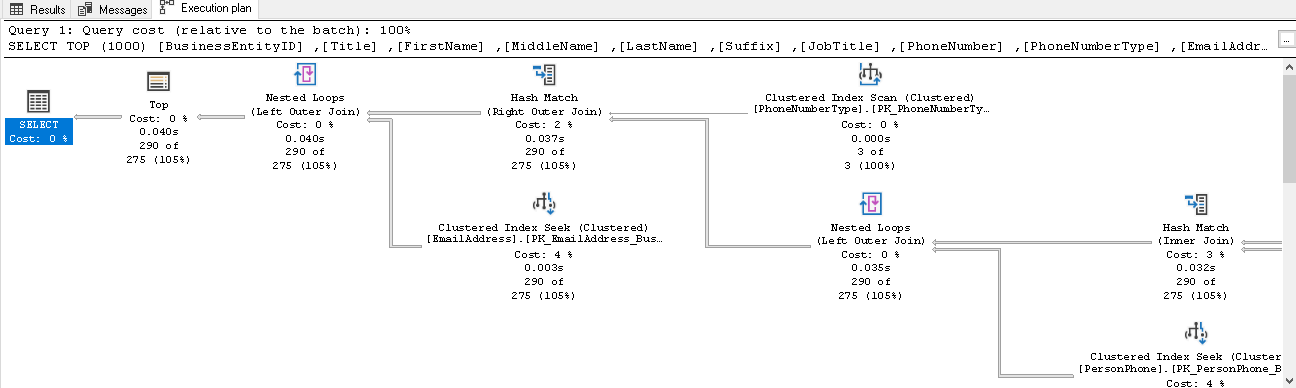
Click on the Explain, and it shows the execution plan in a Query Plan tab.
单击“ 说明”,它会在“ 查询计划”选项卡中显示执行计划。
We get an estimated execution plan in graphical format using this Explain option. You do not see query results (output) because SQL Server does not execute the query in the estimated query plan. If we want to see the XML query plan, we can get it from the Result tab.
使用此Explain选项,我们可以获得图形格式的估计执行计划。 您看不到查询结果(输出),因为SQL Server不在估计的查询计划中执行查询。 如果要查看XML查询计划,可以从“ 结果”选项卡中获取它。
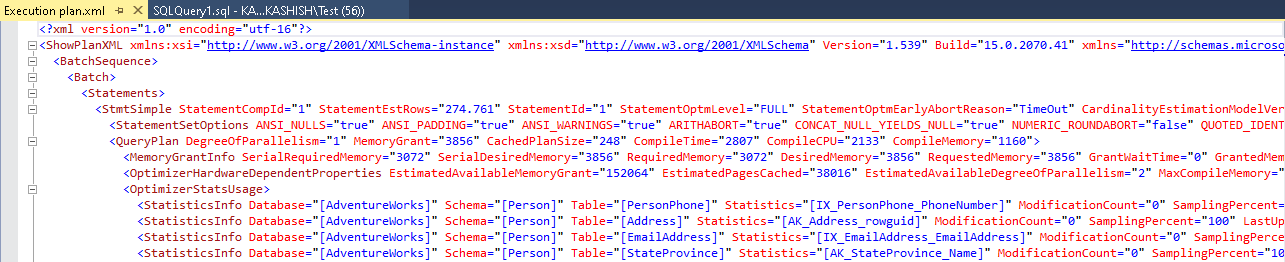
To view completed XML plan, click on the XML and you get the full XML view with a beautiful color coding.
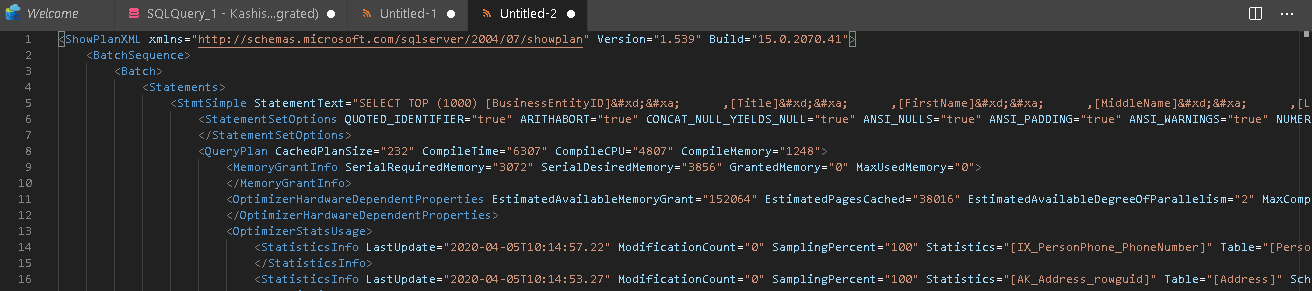
要查看完整的XML计划,请单击XML,您将获得完整的XML视图以及漂亮的颜色编码。
We can save this XML plan with a *.sqlplan extension for future usage. To save this plan, go to File-> Save As.
我们可以使用* .sqlplan扩展名保存此XML计划,以备将来使用。 要保存该计划,请转到“文件”->“另存为”。
Specify a file name with *.sqlplan extension in a required directory.
在所需目录中指定带有* .sqlplan扩展名的文件名。
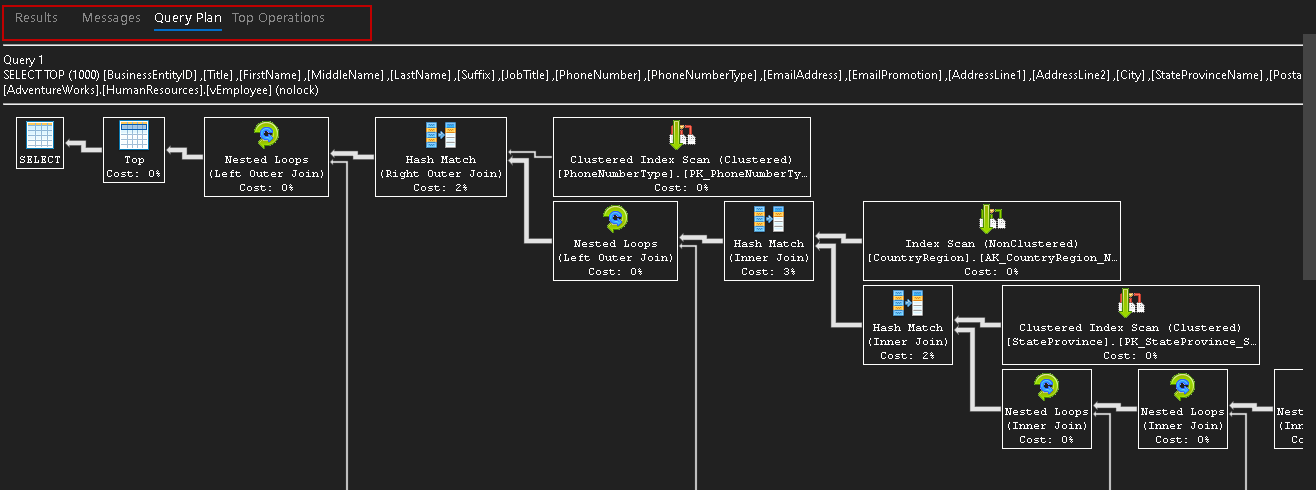
Once you save the execution plan, it opens the following graphical format. We cannot get the top operators from this saved plan.
保存执行计划后,它将打开以下图形格式。 我们无法从此保存的计划中获取顶级操作员。
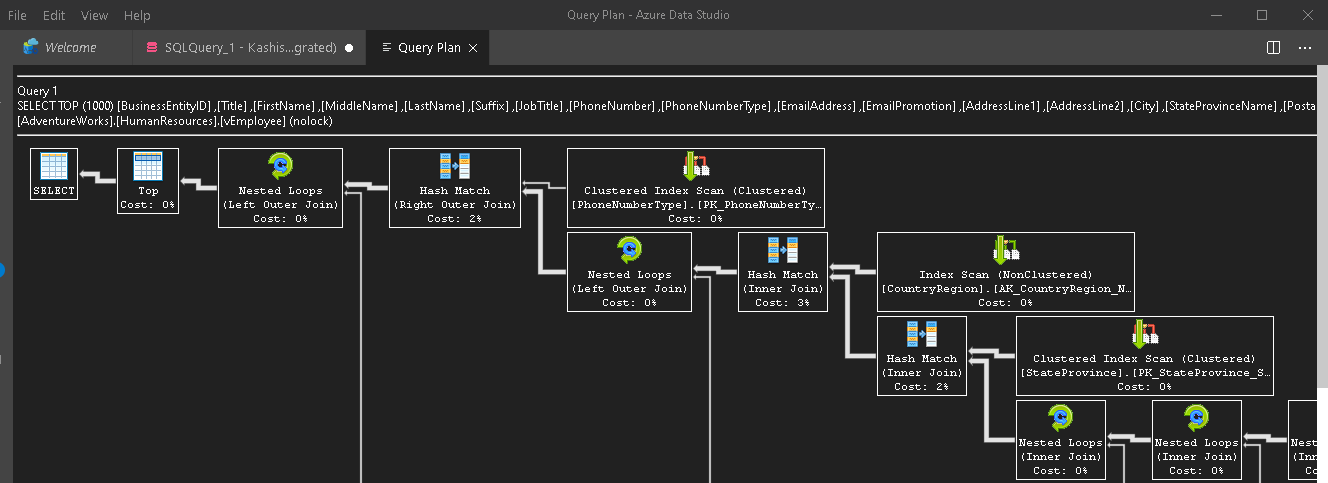
You should read a graphical execution plan from right to left direction because data flow happens in that direction. You can go through the article How to Analyze SQL Execution Plan Graphical Components to understand it in a detailed manner.
您应该从右到左阅读图形执行计划,因为数据流是在那个方向发生的。 您可以阅读文章“ 如何分析SQL执行计划图形组件”以详细了解它。
For a long query, we might see a complicated execution plan with a large window. You might face difficulty to analyze the costly operators associated with the query. Azure Data Studio provides a solution for this as well. You see an additional tab Top Operations to check all operators and their costs in a tabular format.
对于较长的查询,我们可能会看到一个带有大窗口的复杂执行计划。 您可能难以分析与查询关联的昂贵运算符。 Azure Data Studio也为此提供了一个解决方案。 您会看到一个附加的顶部操作选项卡,以表格形式检查所有操作员及其费用。
Click on the Top Operations, and you get the following output.
单击“ 主要操作”,您将获得以下输出。
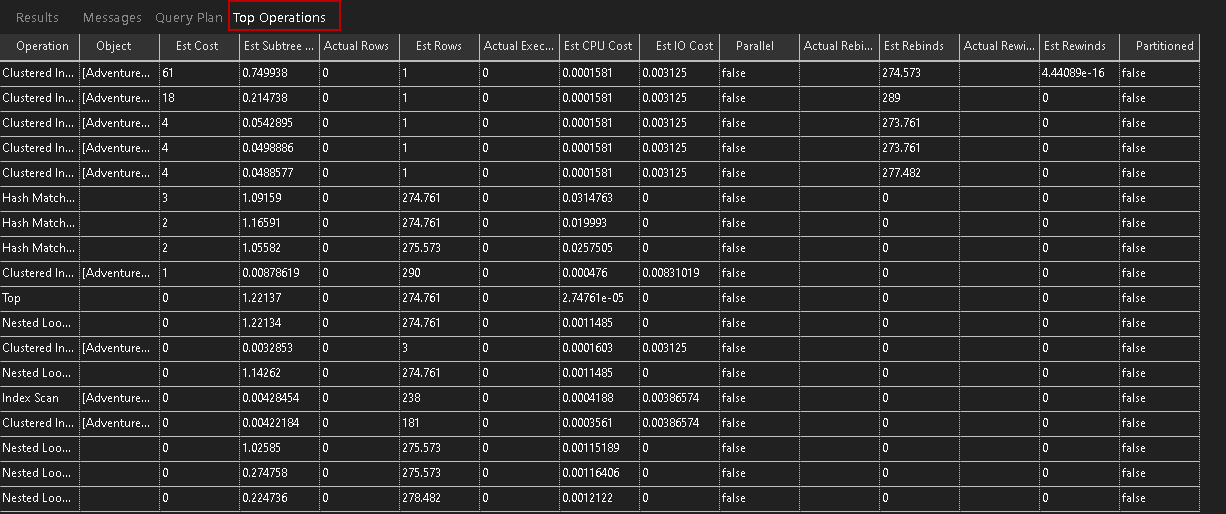
It is an interactive window to check the operators. You can click on any column and sort the output in a descending or ascending order.
它是检查操作员的交互式窗口。 您可以单击任何列,然后按降序或升序对输出进行排序。
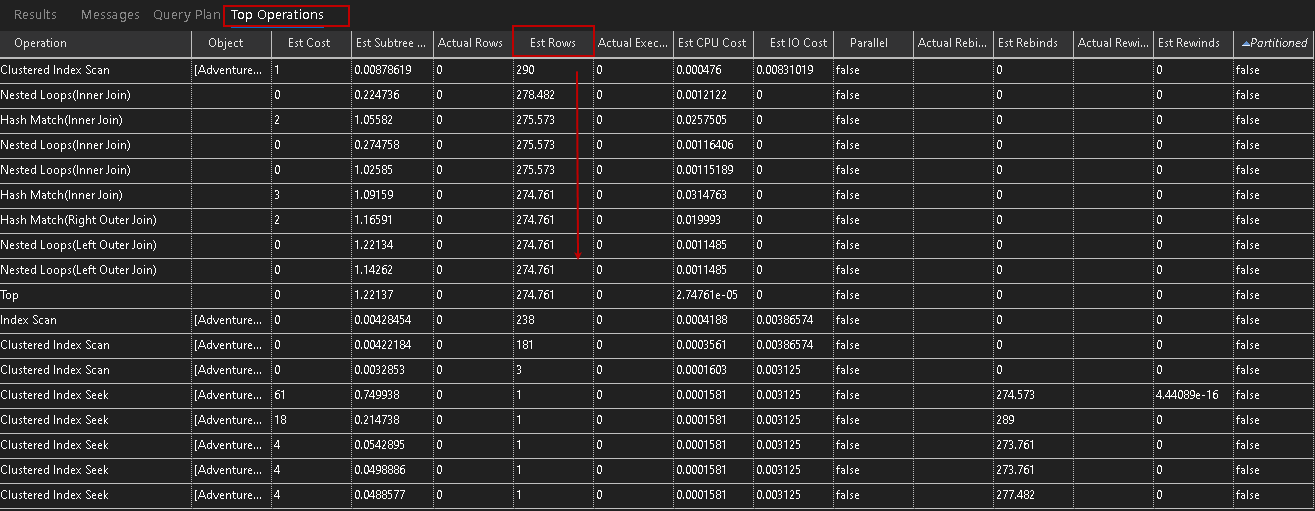
For example, if we want to sort this table based on estimated rows flowing through each operator. Click on the Est Rows column, and it sorts results accordingly.
例如,如果我们要基于流经每个运算符的估计行对该表进行排序。 单击“ 估计行”列,然后对结果进行排序。
Similarly, we can sort results according to the Est Costs of plan operators.
同样,我们可以根据计划运营商的估计成本对结果进行排序。
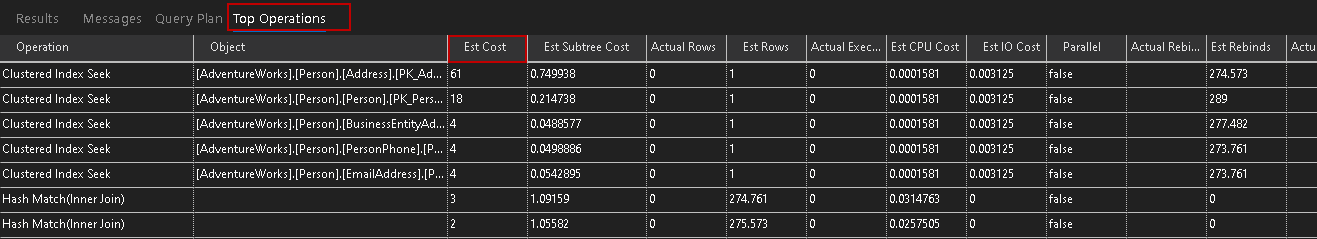
It is an excellent way to identify the costly operators taking most of the resources and time. You can go back to the graphical plan to check more details around that identified operator.
这是一种识别占用大量资源和时间的昂贵运营商的绝佳方法。 您可以返回图形化计划,以检查有关该已识别操作员的更多详细信息。
在Azure Data Studio中获取实际的执行计划 (Get Actual Execution Plan in Azure Data Studio)
As we see earlier, the Explain option gives you an estimated query plan. In most cases, we prefer to get the actual execution plan and investigate it further. I would recommend to use the actual execution plan as well so that you can get an idea of what caused the query to behave slowly.
正如我们前面所看到的,“ 解释”选项为您提供了一个估计的查询计划。 在大多数情况下,我们倾向于获取实际的执行计划并进行进一步调查。 我建议也使用实际的执行计划,以便您了解导致查询运行缓慢的原因。
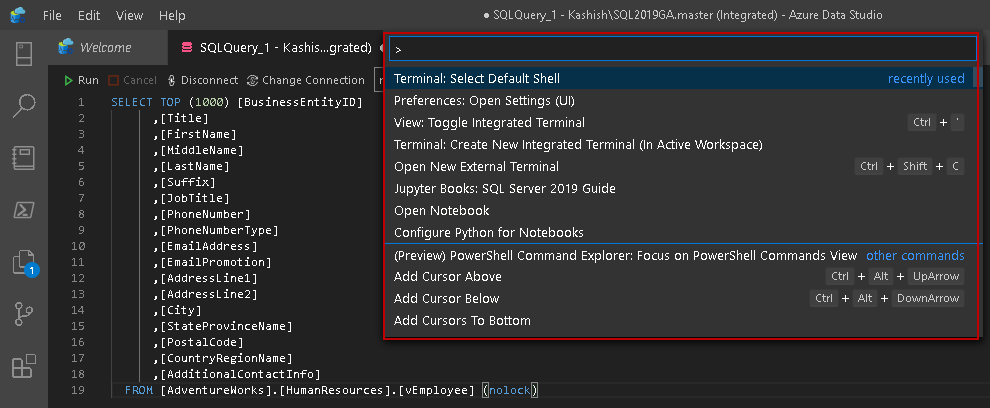
To get an actual query plan, first, write the query in a new query window and then go to View -> Command Palette.
要获取实际的查询计划,请首先在新的查询窗口中编写查询,然后转到“ 视图”->“命令面板”。
It opens the list of available commands, as shown below.
它将打开可用命令的列表,如下所示。
Type Run Current Query with Actual Plan and click on the highlighted option.
键入运行带有实际计划的当前查询和 单击突出显示的选项。
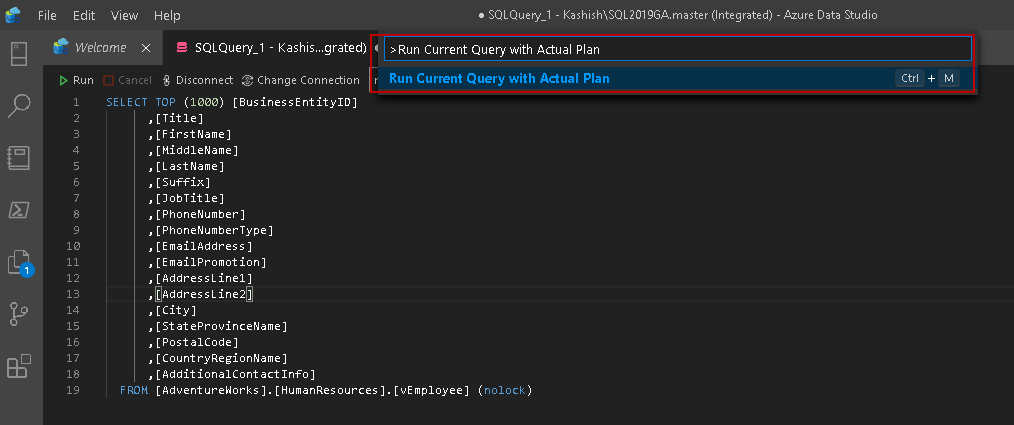
You can use keyboard shortcut CTRL+M to execute the query and get an actual execution plan, as shown below.
您可以使用键盘快捷键CTRL + M来执行查询并获取实际的执行计划,如下所示。
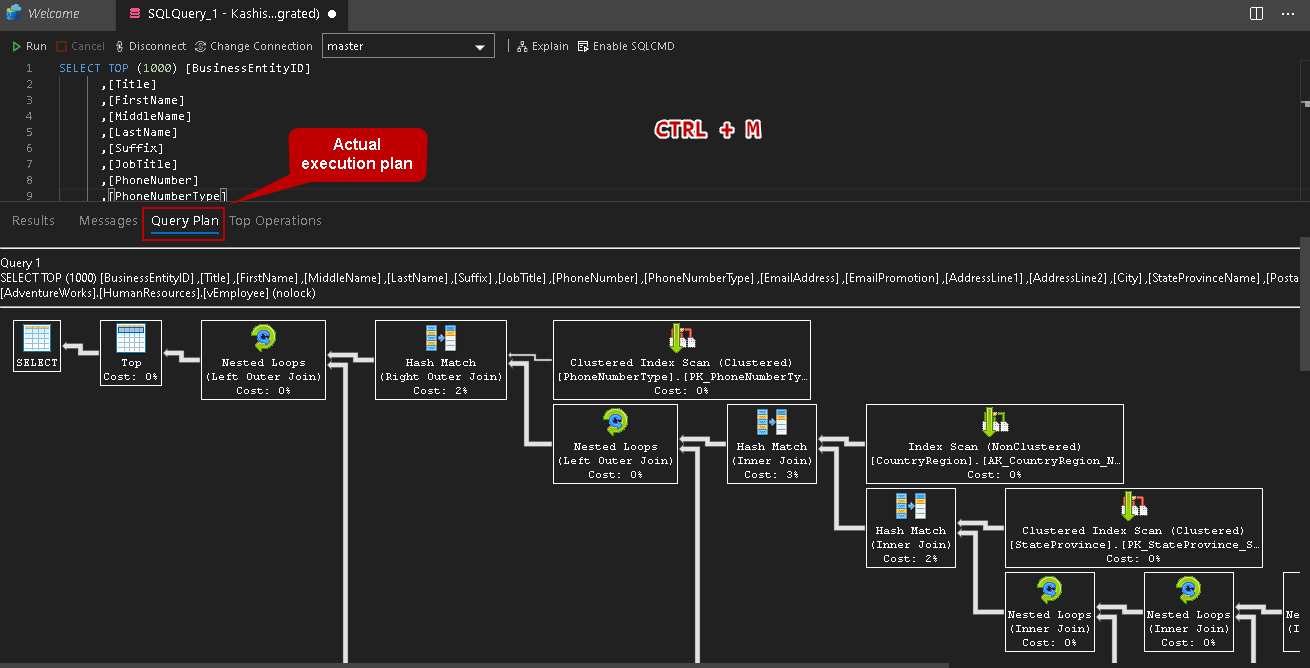
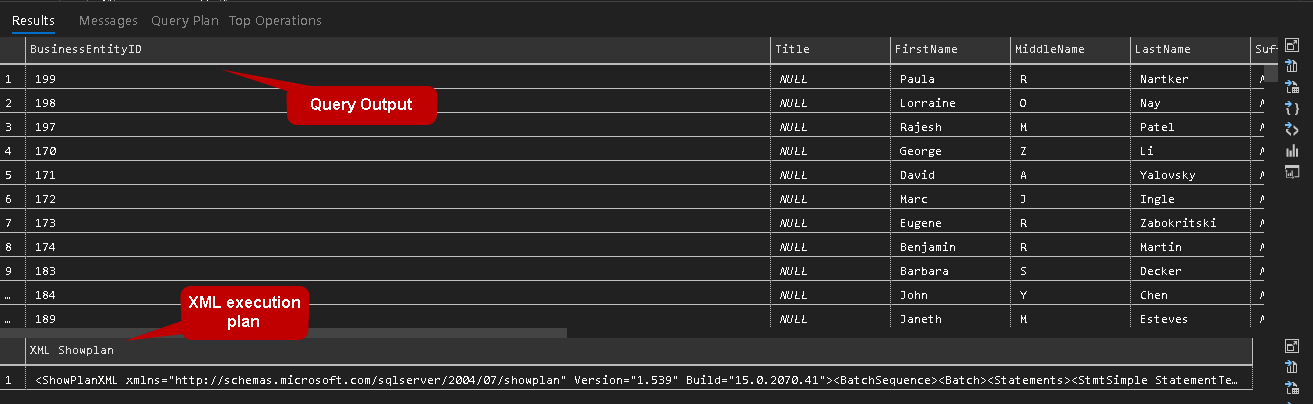
You get similar options as of the estimated query plan. In the result pane, you get the query result as well as the XML query plan in Azure Data Studio.
您将获得与估计查询计划相似的选项。 在结果窗格中,您将获得查询结果以及Azure Data Studio中的XML查询计划。
结论 (Conclusion)
In this article, we explored ways to view the estimated and actual execution plans in the Azure data studio. We also viewed ways to get graphical and XML plan using this ADS.
在本文中,我们探索了在Azure数据工作室中查看估计和实际执行计划的方法。 我们还查看了使用此ADS获取图形和XML计划的方法。
翻译自: https://www.sqlshack.com/view-execution-plans-in-azure-data-studio/


 961
961

 被折叠的 条评论
为什么被折叠?
被折叠的 条评论
为什么被折叠?
 到【灌水乐园】发言


