


介绍 ( Introduction )
The indexes in many cases are great solutions to solve performance problems. For some problems, they are magical and very cheap solutions. In this chapter, we will show a demo of the SQL Server Tuning Advisor, which is a tool that comes with the SQL Server Installation. We will also use the SQL Server Profiler to generate the information for the Tuning Advisor.
在许多情况下,索引是解决性能问题的理想解决方案。 对于某些问题,它们是神奇且非常便宜的解决方案。 在本章中,我们将展示SQL Server Tuning Advisor的演示,这是SQL Server安装随附的工具。 我们还将使用SQL Server Profiler为Tuning Advisor生成信息。
调音顾问 ( The Tuning Advisor )
The Tuning Advisor is a tool used to recommend and apply indexes, statistics and partitions in our SQL Server, based on the information from a sql script, from a xml file or a Profiler trace file. This tool analyzes queries and recommends indexes, statistics and partitions for our tables and views.
Tuning Advisor是一种工具,用于基于sql脚本,xml文件或Profiler跟踪文件中的信息来建议和应用SQL Server中的索引,统计信息和分区。 该工具分析查询并为我们的表和视图推荐索引,统计信息和分区。
SQL Server探查器 ( SQL Server Profiler )
In order to record daily database activity, you can use the SQL Server Profiler tool. The SQL Server Profiler will store the T-SQL queries that will be used for the Tuning Advisor to start.
为了记录日常数据库活动,可以使用SQL Server Profiler工具。 SQL Server Profiler将存储T-SQL查询,这些查询将用于启动Tuning Advisor。
The SQL Server Profiler is a great tool to monitor long queries and monitor the performance of the daily database activities. It is also used to monitor database activities for security purposes.
SQL Server Profiler是监视长时间查询和监视日常数据库活动性能的好工具。 它还出于安全目的用于监视数据库活动。
You can use SQL Profiler to monitor Relational Databases (our scenario) or Multidimensional databases (SSAS).
您可以使用SQL Profiler来监视关系数据库(我们的方案)或多维数据库( SSAS )。
要求 ( Requirements )
- The Tuning Advisor, which is included in all the SQL Server Editions except in the Express editions Tuning Advisor,除Express版本外,所有SQL Server版本都包含
- The SQL Server Profiler, which is included in all the SQL Server Editions except the Web and express editions SQL Server Profiler,包括在除Web和Express版本之外的所有SQL Server版本中
- We are using SQL Server 2014, but earlier versions can be used 我们正在使用SQL Server 2014,但是可以使用早期版本
To detect the SQL Server edition, you can use this query:
要检测SQL Server版本,可以使用以下查询:
select SERVERPROPERTY('Edition') AS Edition- AdventureWorks database installed. In our example, the AdventureWorks 2014 is being usedAdventureWorks数据库 。 在我们的示例中,正在使用AdventureWorks 2014
入门 ( Getting started )
In SQL Server Profiler, we are going to record the Database Activity in a trace file. This file will be later used by the Tuning Advisor to give recommendations.
在SQL Server Profiler中,我们将数据库活动记录在跟踪文件中。 此文件稍后将由Tuning Advisor使用以提供建议。
In order to start, open SQL Server Profiler:
为了开始,请打开SQL Server Profiler:
Figure 1. The SQL Server Profiler 图1. SQL Server Profiler To trace the information, go to File>New Trace:
要跟踪信息,请转到“文件”>“新建跟踪”:
Figure 2. 图2. Create a New Trace 创建一个新的跟踪 Enter the SQL Server authentication information and press connect:
输入SQL Server身份验证信息,然后按connect:
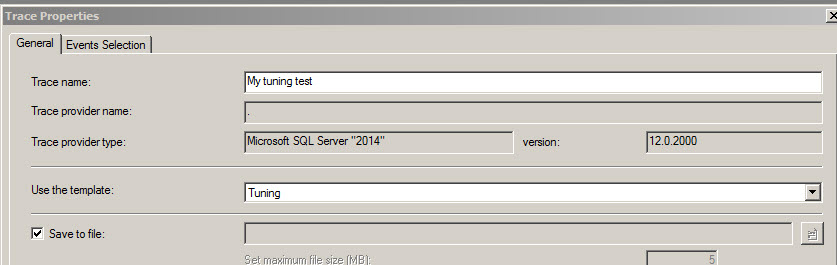
Figure 3. 图3. The SQL Server credentials SQL Server凭据 The General section allow us to specify the Trace name and we can specify the template. The template allows us to specify the type of the activity to monitor. In this case, we want to record information for the tuning wizard. For this purpose, the Tuning template can be used. Optionally, you can create your own template, but this is out of the scope of this article:
“ 常规”部分允许我们指定跟踪名称,也可以指定模板。 该模板使我们可以指定要监视的活动的类型。 在这种情况下,我们要记录有关调整向导的信息。 为此,可以使用调整模板。 (可选)您可以创建自己的模板,但这超出了本文的范围:
Figure 4. The 图4. Tuning template 调优模板 You can store the trace in a trace file or store in a SQL Server table. Storing in a file is faster, but storing in a table is useful to create advanced queries for tracking purposes. In this sample, we will store in a file:
您可以将跟踪存储在跟踪文件中,也可以存储在SQL Server表中。 存储在文件中速度更快,但是存储在表中对于创建用于跟踪目的的高级查询很有用。 在此示例中,我们将存储在一个文件中:
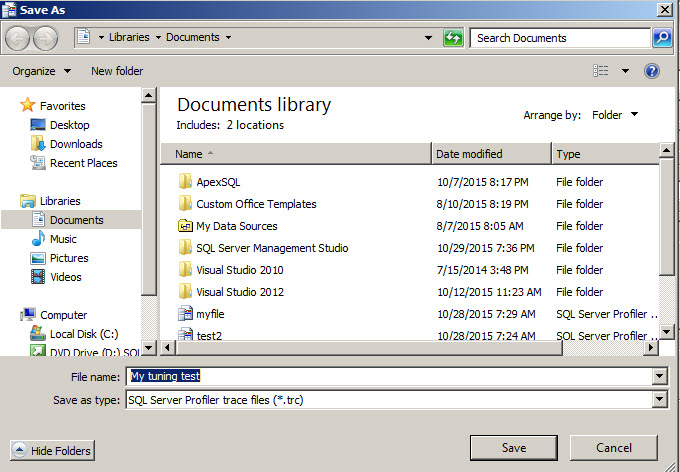
Figure 5. The trace file 图5.跟踪文件 - Once you have the trace properties defined, run the trace 定义跟踪属性后,运行跟踪
In order to generate activity, open SQL Server Management Studio (SSMS):
为了生成活动,请打开SQL Server Management Studio(SSMS):
Figure 6. The SSMS and the Adventure W orks 图6. SSMS 和 AdventureW¯¯ 兽人 We are going to work with the Person.Person table:
我们将使用Person.Person表:
Figure 7. The 图7. Person. 人员。 P P erson erson table 表 To simulate the lack of indexes, we are going to remove an existing index of the table Person.Person:
为了模拟缺少索引的情况,我们将删除表Person.Person的现有索引:
DROP INDEX [IX_Person_LastName_FirstName_MiddleName] ON [Person].[Person]
GO
Now, run these queries in order to generate some information:
现在,运行这些查询以生成一些信息:
SELECT BusinessEntityID, FirstName, MiddleName, LastName
from Person.Person
where LastName = 'Allison'


SELECT COUNT(*) FROM Person.Person
This is a simulation to learn how to work with the tuning advisor. Usually, you will run the profiler and the users will work on the daily tasks and the Profiler will be loading the queries with real activities and at the end of the day, the trace will be stopped (you can specify the time to stop the trace in Profiler). In the SQL Server Profiler, stop the trace:
这是一个模拟学习如何使用调整顾问的模拟。 通常,您将运行探查器,用户将处理日常任务,探查器将使用实际活动加载查询,并在一天结束时停止跟踪(您可以指定停止跟踪的时间)在Profiler中)。 在SQL Server Profiler中,停止跟踪:
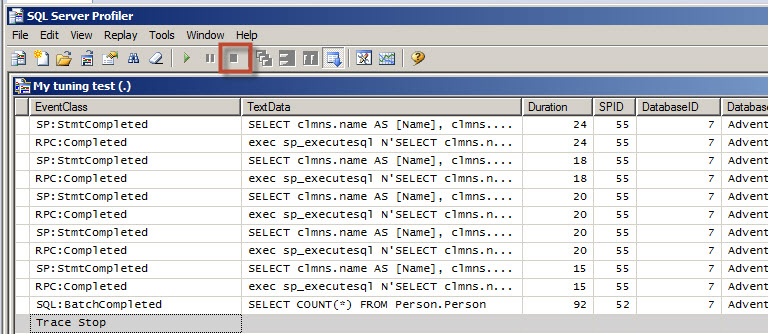
Figure 8 . Stopping the trace 图8 。 停止追踪 If you check TextData you will notice that a lot of internal queries were generated when you used the SQL Server Profiler. The Profiler stores all the activity and you can filter some information to reduce the workload:
如果检查TextData,您会注意到使用SQL Server Profiler时会生成许多内部查询。 事件探查器存储所有活动,您可以过滤一些信息以减少工作量:
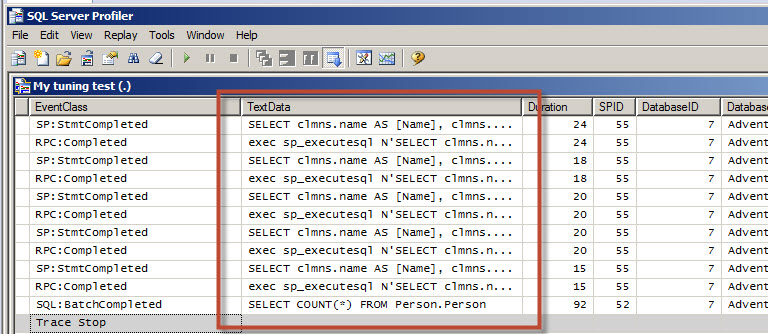
Figure 9. The trace information 图9.跟踪信息 If we check the trace information, we will see the query run on step 10. The duration of the query execution is 1888 ms:
如果我们检查跟踪信息,我们将看到查询在步骤10上运行。查询执行的持续时间为1888 ms:
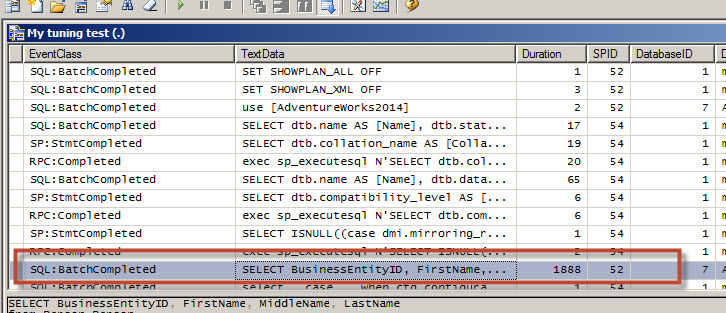
Figure 10. 图10. The query run 查询运行 Now that we have the information collected in a trace file, it is time to open the Database Engine Tuning Advisor:
现在,我们已经在跟踪文件中收集了信息,是时候打开数据库引擎优化顾问了:
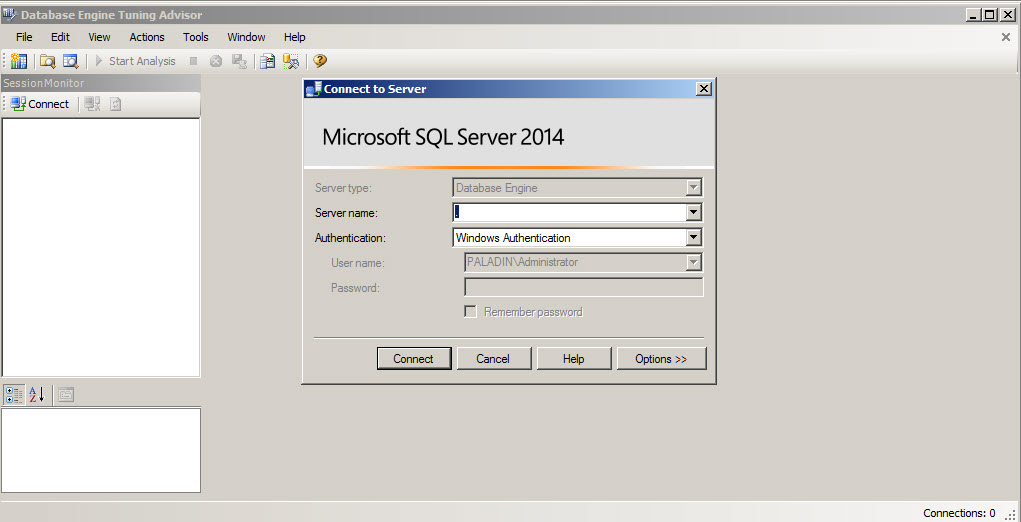
Figure 11. The Tuning Advisor 图11. Tuning Advisor By default, the session name is the user name and the date:
默认情况下,会话名称是用户名和日期:
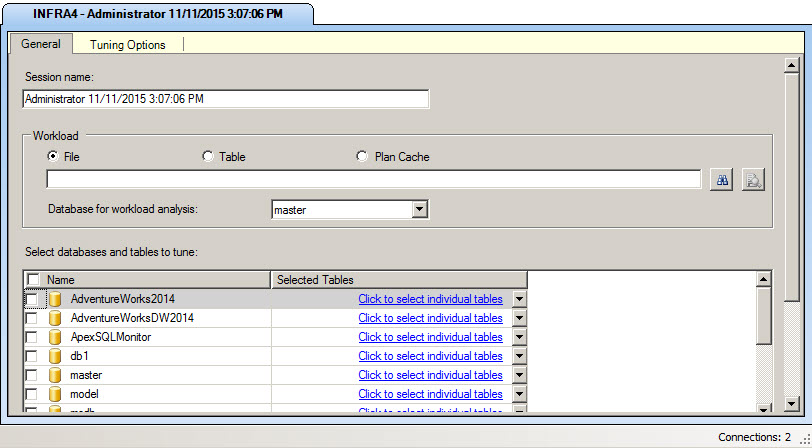
Figure 12. The Advisor Session 图12. Advisor会话 You can upload information from a .trc file from Profiler (our scenario), from a sql script, from a xml file, from a table and from the Plan Cache. You can also choose where to do the analysis. In this example, the workload will be done in the master database. Finally, we will select the database to tune. We used the AdventureWorks database:
您可以从Profiler(我们的方案)的.trc文件,SQL脚本,xml文件,表格和计划缓存中上传信息。 您还可以选择在何处进行分析。 在此示例中,工作量将在master数据库中完成。 最后,我们将选择要调整的数据库。 我们使用了AdventureWorks数据库:
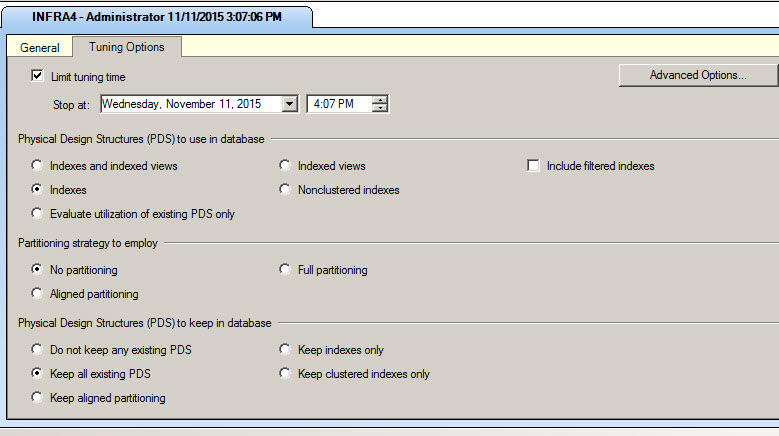
Figure 13. 图13. The session options 会话选项 The tuning options tab will help you to configure some options like the stop time of the analysis. If your workload is huge, analyzing all the information may take several hours. That is why you can limit the time to analyze the information.
调整选项选项卡将帮助您配置一些选项,例如分析的停止时间。 如果您的工作量很大,分析所有信息可能需要几个小时。 因此,您可以限制分析信息的时间。
You can also limit your analysis to just Index, just index views or limit the analysis to non-clustered indexes. All these options will reduce the analysis time. You have also options to analyze the partitioning strategy and the Physical design structure to keep in the database. You can decide which structures to keep.
您还可以将分析限制为仅索引,仅索引视图,或者将分析限制为非聚集索引。 所有这些选项将减少分析时间。 您还可以选择分析分区策略和要保留在数据库中的物理设计结构。 您可以决定保留哪些结构。
Figure 14 . The tuning options 图14 。 调整选项 Once you have all the configurations ready, you can start the analysis:
准备好所有配置后,即可开始分析:
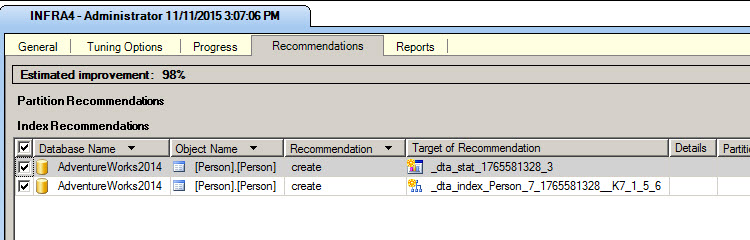
Figure 15. Starting the analysis 图15.开始分析 Once the Analysis is done, you will be able to see the Recommendations. In this example, the estimated improvement with the changes will be 98 %. It shows the Database, the object Name (in this case the Person.Person table). The recommendations are to create statistics and to create an index:
分析完成后,您将可以看到建议。 在此示例中,估计的更改带来的改进将是98%。 它显示数据库,对象名称(在本例中为Person.Person表)。 建议创建统计信息并创建索引:
Figure 16. The Tuning Advisor recommendations 图16. Tuning Advisor建议 In the reports tab, there are several reports. The Statement cost report will show the T-SQL statements and the percentage of improvement when we apply the changes:
在“报告”选项卡中,有几个报告。 当我们应用更改时,对帐单成本报告将显示T-SQL帐单和改进百分比:
Figure 17. The statement cost report 图17.报表成本报告 The event frequency report shows how frequently the queries are used. This is very important because an excessive number of indexes can decrease the performance. You cannot blindly apply the recommendations, you need to analyze the reports first and choose wisely, the queries most frequently used. You should prioritize frequently used queries:
事件频率报告显示查询的使用频率。 这非常重要,因为过多的索引会降低性能。 您不能盲目地应用建议,您需要首先分析报告并明智地选择最常用的查询。 您应该确定常用查询的优先级:
Figure 图 18. 18. The Event frequency report 事件频率报告 The statement detail report shows the current cost and the cost of the query applying the recommendations. The lowest cost, the best performance
报表明细报告显示当前成本和应用建议的查询成本。 最低成本,最佳性能
Figure 19. The Statement detail report 图19.语句详细报告 In addition, there are more reports available. Use them wisely to select the best recommendations:
此外,还有更多报告可用。 明智地使用它们来选择最佳建议:
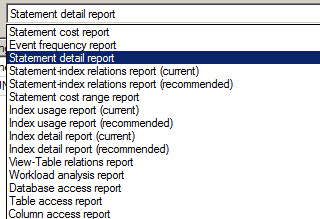
Figure 20. 图20. The Tuning Advisor reports Tuning Advisor报告 In the Actions menu, you can apply the recommendation, which will create the indexes, statistics or any other recommendation. The Save Recommendations will save the recommendations in a .sql script. The Evaluation option evaluates the recommendations:
在“操作”菜单中,您可以应用建议,这将创建索引,统计信息或任何其他建议。 保存建议会将建议保存在.sql脚本中。 评估选项评估建议:
Figure 21. The Tuning Advisor actions 图21. Tuning Advisor操作 In this example, we will save the recommendations in a sql script:
在此示例中,我们将建议保存在sql脚本中:
Figure 22. The script with the recommendations 图22. 带有建议 的脚本 Open the script created on step 25 and execute the sentences. The script will create 1 index and 1 statistic:
打开在步骤25中创建的脚本并执行句子。 该脚本将创建1个索引和1个统计信息:
use [AdventureWorks2014]
go

SET ANSI_PADDING ON

go

CREATE NONCLUSTERED INDEX [_dta_index_Person_7_1765581328__K7_1_5_6] ON [Person].[Person]
(
	[LastName] ASC
)
INCLUDE ( 	[BusinessEntityID],
	[FirstName],
	[MiddleName]) WITH (SORT_IN_TEMPDB = OFF, DROP_EXISTING = OFF, ONLINE = OFF) ON [PRIMARY]
go

CREATE STATISTICS [_dta_stat_1765581328_3] ON [Person].[Person]([NameStyle])
go
Now, run again the query of the step 10, but activate the Actual Execution Plan icon. The execution plan will show if the new index created is being used:
现在,再次运行步骤10的查询,但是激活“实际执行计划”图标。 执行计划将显示是否正在使用创建的新索引:
Figure 23. Activating the actual execution plan 图23.激活实际的执行计划 As you can see, the Index created in the step 26 is being used by the query:
如您所见,查询正在使用步骤26中创建的索引:
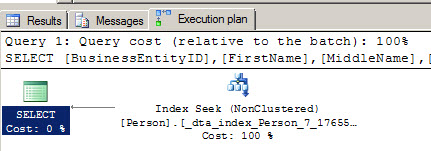
Figure 24. 图24. The Execution Plan 执行计划 结论 ( Conclusion )
As you can see, the Tuning Advisor is a nice and simple tool. You just need to run the profiler store the trace in a file or a table or just pass a sql script with the queries to analyze or simply you can analyze the plan cache.
如您所见,Tuning Advisor是一个很好的简单工具。 您只需要运行探查器将跟踪存储在文件或表中,或者仅将带有查询的sql脚本传递给分析,或者简单地就可以分析计划缓存。
The recommendations done by the Tuning Advisor should be carefully analyzed. You should analyze the indexes and check the reports before implementing them.
应该仔细分析Tuning Advisor所做的建议。 在实施索引之前,您应该分析索引并检查报告。
Read the next chapter and learn how to use the command line tool called DTA.
阅读下一章 ,了解如何使用称为DTA的命令行工具。
翻译自: https://www.sqlshack.com/a-great-tool-to-create-sql-server-indexes/


 745
745

 被折叠的 条评论
为什么被折叠?
被折叠的 条评论
为什么被折叠?
 到【灌水乐园】发言


