


 本文介绍了如何设置Grafana仪表板进行实时数据分析和监控。通过模拟SQL Server中的实时数据,展示了如何创建和配置Grafana,以及如何从SQL数据源获取并可视化数据。Grafana是一款免费且灵活的开源工具,适用于生产环境的资源监控。
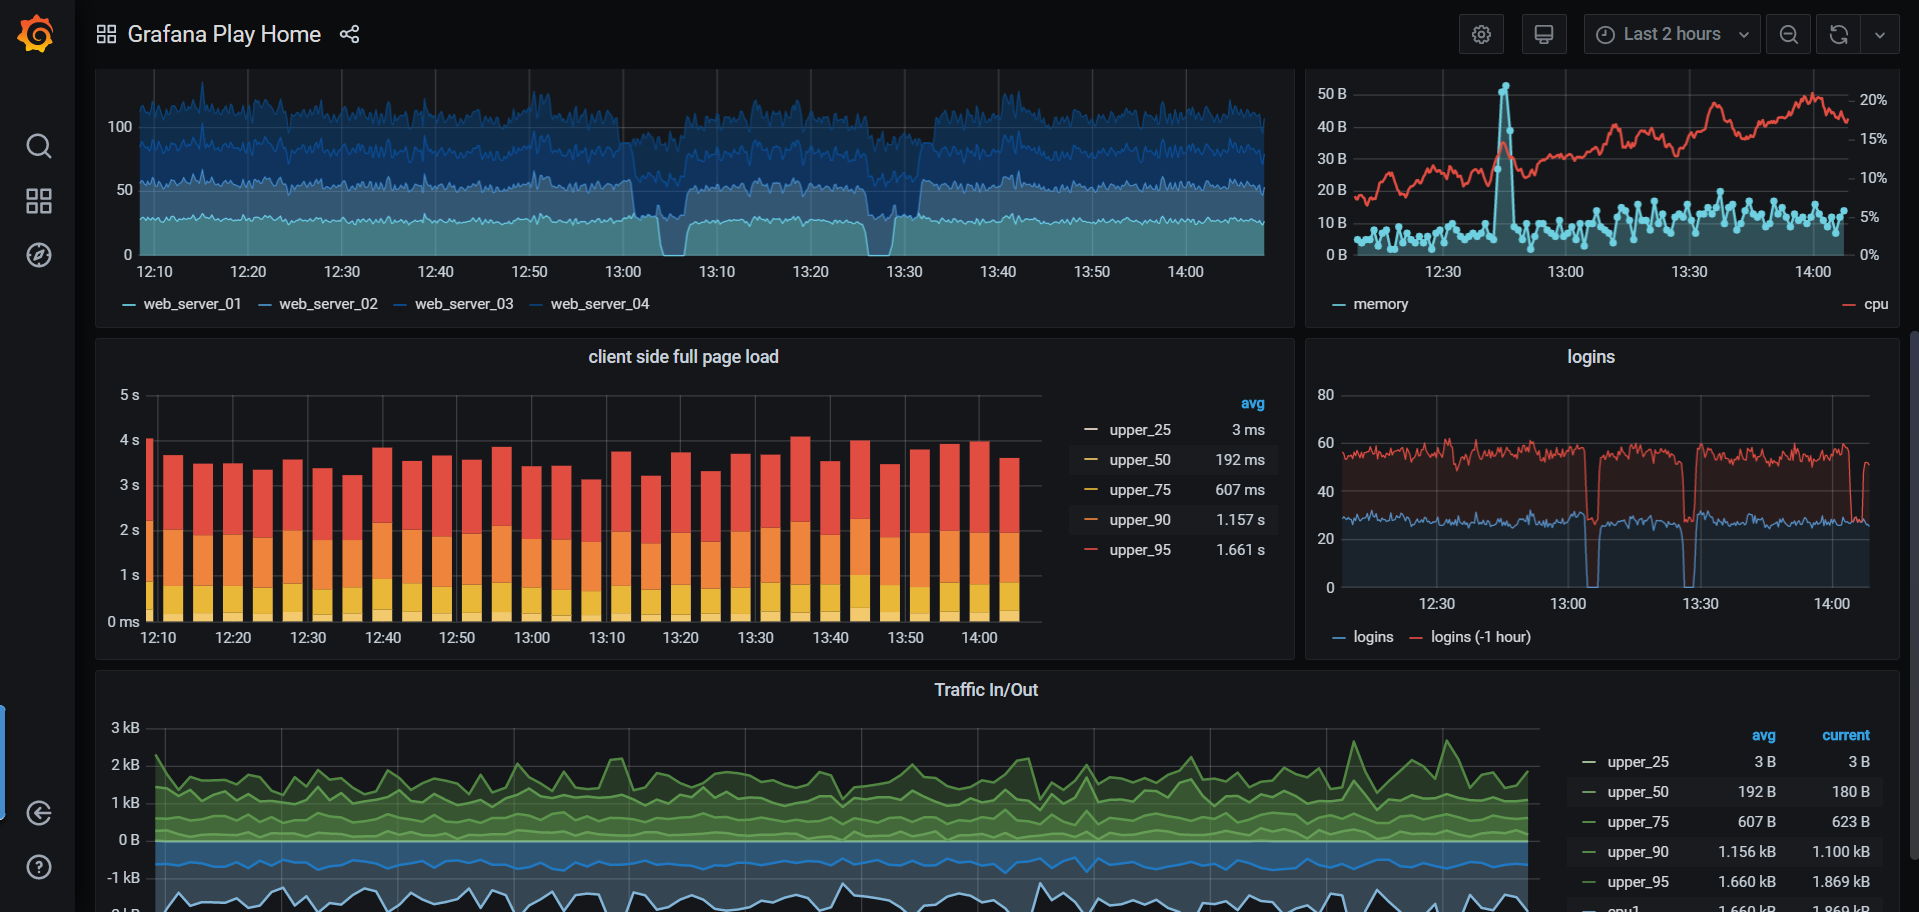
grafana sql
In this article, I am going to demonstrate how to set up Grafana Dashboard for real-time analytics or data monitoring purposes. Grafana is an open-source, cross-platform analytics service tool that can be used to fetch data from several data sources, and then the data can be visualized in a much intuitive way in the form of bars and graphs. This is quite a useful feature for the DevOps or the IT team as it can make their job easier to find abnormalities or spikes in the production environment by observing the logs generated.
在本文中,我将演示如何设置Grafana仪表板以进行实时分析或数据监视。 Grafana是一种开放源代码,跨平台的分析服务工具,可用于从多个数据源中获取数据,然后可以以非常直观的方式以条形图和图形形式显示数据。 对于DevOps或IT团队来说,这是一个非常有用的功能,因为它可以通过观察生成的日志使他们的工作更容易在生产环境中发现异常或高峰。
Grafana was first released in 2014 and now has the ability to connect to multiple data sources, including MySQL, SQL Server, Graphite, Prometheus, etc. The most common usage of this tool is to create a time-series data visualization, which depicts the health or usage of a resource over a period of time. These dashboards can be deployed on-premises or on the cloud as required. For the sake of this tutorial, I’m going to use the on-premise version of the tool.
Grafana于2014年首次发布,现在可以连接到多个数据源,包括MySQL,SQL Server,Graphite,Prometheus等。此工具最常见的用法是创建时间序列数据可视化,以描述一段时间内的健康状况或资源使用情况。 这些仪表板可以根据需要部署在本地或云中。 为了本教程的缘故,我将使用该工具的内部版本。
We will divide this article into two parts. In the first part, we will create a dummy table in SQL Server, which will simulate live data over time. And in the second part, we will see how to install Grafana on-premises and how to create live dashboards using the dummy data from SQL Server.
我们将把本文分为两部分。 在第一部分中,我们将在SQL Server中创建一个虚拟表,该虚拟表将随着时间的推移模拟实时数据。 在第二部分中,我们将看到如何在本地安装Grafana以及如何使用SQL Server中的虚拟数据创建实时仪表板。
在SQL中模拟实时数据 (Simulating the Real-Time Data in SQL)
We will try to simulate live data from a physical sensor that sends temperature and humidity data points every ten seconds. Let us first create a table in which we will write the data generated. You can use the script below to create the table.
我们将尝试模拟物理传感器的实时数据,该传感器每十秒钟发送一次温度和湿度数据点。 让我们首先创建一个表,在其中写入生成的数据。 您可以使用下面的脚本创建表。
CREATE TABLE GrafanaDemo(
[DataID]                INT                                IDENTITY,
[Metric]                VARCHAR(20),
[Value]                        INT,
[TimeStamp]                DATETIME
)
GO
Let us go ahead and create a stored procedure that will generate random data like temperature and humidity values when executed.
让我们继续创建一个存储过程,该过程将在执行时生成诸如温度和湿度值之类的随机数据。
CREATE PROCEDURE usp_GenerateGrafanaData
AS

WITH cte_Demo AS(
SELECT
'Temperature'                                AS [Metric]
,FLOOR(RAND()*(80-20+1))+20 AS [Value]
,GETDATE()                                        AS [TimeStamp]

UNION

SELECT
'Humidity'                                        AS [Metric]
,FLOOR(RAND()*(80-20+1))+20 AS [Value]
,GETDATE()                                        AS [TimeStamp]
)

INSERT INTO GrafanaDemo ([Metric],[Value],[TimeStamp])
SELECT * FROM cte_Demo;

GO
Finally, we will create an SQL Agent job that will execute the stored procedure and schedule it to run every ten seconds. This will populate the table with random values for temperature and humidity and will have sufficient values to develop the dashboard. You can use the following script to create the SQL Agent Job or create the same using the UI.
最后,我们将创建一个SQL Agent作业,该作业将执行存储过程并将其安排为每十秒钟运行一次。 这将在表中填充温度和湿度的随机值,并且将具有足够的值来开发仪表板。 您可以使用以下脚
 最低0.47元/天 解锁文章


 615
615

 被折叠的 条评论
为什么被折叠?
被折叠的 条评论
为什么被折叠?
 到【灌水乐园】发言


