


 本文介绍如何使用PowerShell从Microsoft SQL Server中的数据生成图表,重点介绍了DataVisualization命名空间的使用,包括图表组件、类和属性,以及如何加载和使用.NET Framework中的程序集。
powershell
介绍 (Introduction)
Intended audience
目标听众
This document is intended for application developers and database administrators who are willing to learn how to generate charts from data stored in Microsoft SQL Server using PowerShell.
本文档适用于愿意学习如何使用PowerShell从Microsoft SQL Server中存储的数据生成图表的应用程序开发人员和数据库管理员。
Context
语境
Let’s say you have some data stored in a SQL Server box and you want to build a chart. The easiest way to do it will be to:
假设您有一些数据存储在SQL Server框中,并且想要构建图表。 最简单的方法是:
- SQL Server Management Studio SQL Server管理Studio
- Connect to the SQL Server Instance of you choice 连接到您选择SQL Server实例
- Run a T-SQL query that returns exactly the data you want 运行一个T-SQL查询,该查询将完全返回您想要的数据
- In SSMS results data grid, select everything, hit CTRL+C 在SSMS结果数据网格中,选择所有内容,然后按CTRL + C
- Open a Microsoft Excel (or OpenOffice Calc) spreadsheet 打开一个Microsoft Excel(或OpenOffice Calc)电子表格
- Paste the results in that spreadsheet 将结果粘贴到该电子表格中
- Build a chart inside the spreadsheet 在电子表格中构建图表
While these steps are pretty simple, it requires manual intervention and quite a long time to get what we want. What if there were a solution that would cover your needs and do the job in such a simple step like running a PowerShell Script?
尽管这些步骤非常简单,但需要人工干预并且需要很长时间才能获得我们想要的。 如果有一种解决方案可以满足您的需求,并且可以通过运行PowerShell脚本这样的简单步骤来完成工作,该怎么办?
It’s actually possible using the System.Windows.Forms.DataVisualization assembly from .NET Framework.
实际上,可以使用.NET Framework中的System.Windows.Forms.DataVisualization程序集。
For a better reading experience, it has been decided to publish two articles: one that is more likely to explain the tool used to build charts and the other one to provide more practical examples.
为了获得更好的阅读体验,已决定发表两篇文章:一篇更可能解释构建图表的工具,另一篇提供更实际的示例。
In this article, we will discuss how to load an assembly, what classes, which properties and methods of the DataVisualisation assembly should be considered to create a chart and either display it on screen or store it into an image (JPG, PNG…) file. Practical examples will come in a separate article.
在本文中,我们将讨论如何加载程序集,应考虑使用DataVisualisation程序集的哪些类,哪些属性和方法来创建图表并将其显示在屏幕上或将其存储到图像(JPG,PNG…)文件中。 实际示例将在另一篇文章中提供。
Let’s get it charted!
让我们绘制图表!
什么是程序集以及如何在PowerShell中加载程序集 (What is an assembly and how to load one in PowerShell)
What is a namespace
什么是名称空间
Before going any longer in this document, let’s define a word that will come out frequently: namespace.
在继续阅读本文档之前,让我们定义一个经常出现的单词:名称空间。
A namespace is a collection of classes that are grouped for logical code organization, like we would do in any object-oriented programming language, and name collision avoidance.
命名空间是为逻辑代码组织而分组的类的集合,就像我们在任何面向对象的编程语言中所做的那样,并且避免名称冲突。
Here are some common namespaces in .NET Framework:
这是.NET Framework中的一些常见名称空间:
- System 系统
- System.IO 系统
- System.Security 系统安全
- System.Speech 系统语音
- System.Windows.Forms System.Windows.Forms
What is an assembly
什么是组装
If we look at Microsoft’s documentation page on the subject, we will see that an assembly is a collection of types and resources that are grouped to make a logical unit of functionality.
如果我们查看有关该主题的Microsoft文档页面 ,我们将看到程序集是类型和资源的集合,这些集合被组合为功能的逻辑单元 。
In short, it’s some precompiled code that can be executed by .NET RunTime. Physically speaking, each assembly is stored as an executable file (.exe) or a library file (.dll). Logically speaking, an assembly can contain one or more namespace(s-.
简而言之,它是可以由.NET RunTime执行的一些预编译代码。 从物理上讲,每个程序集都存储为可执行文件(.exe)或库文件(.dll)。 从逻辑上讲,程序集可以包含一个或多个名称空间。
Whenever we create a Windows Application, a Windows Service or any other piece of software and we want to be able to take advantage of the features provided by an assembly, we need to tell .NET runtime to load it.
每当我们创建Windows应用程序,Windows服务或任何其他软件,并且希望能够利用程序集提供的功能时,都需要告知.NET运行时以进行加载。
As PowerShell is a Windows Application itself, it’s launched by .NET RunTime and already loads some assemblies that it needs to actually be able to start successfully. As a result, a PowerShell user can use methods like [string]::isNullOrEmpty() or [System.IO.File]::ReadAllBytes() inside PowerShell.
由于PowerShell本身是Windows应用程序,因此它是由.NET RunTime启动的,并且已经加载了一些程序集,它们实际上必须能够成功启动。 结果,PowerShell用户可以在PowerShell中使用[string] :: isNullOrEmpty()或[System.IO.File] :: ReadAllBytes()之类的方法。
How to load an assembly inside PowerShell
如何在PowerShell中加载程序集
PowerShell features can be extended using some of these .NET Methods and that’s exactly what we will do in order to load the System.Windows.Forms.DataVisualization assembly!
可以使用其中一些.NET方法扩展PowerShell功能,而这正是我们为加载System.Windows.Forms.DataVisualization程序集所做的工作!
In first PowerShell versions, we will use a method called LoadWithPartialName from the System.Reflection.Assembly namespace.
在第一个PowerShell版本中,我们将使用System.Reflection.Assembly命名空间中的一个名为LoadWithPartialName的方法。
Here is the way we can call it.
这是我们可以称之为的方式。
[void][System.Reflection.Assembly]::LoadWithPartialName(
    "System.Windows.Forms.DataVisualization"
)
But this method is marked as “obsolete” by Microsoft.
但是此方法被Microsoft标记为“过时”。
A replacement method could be to use following command:
一种替代方法是使用以下命令:
Add-Type -AssemblyName "<AssemblyName>"
Example:
例:
Add-Type -AssemblyName "System.Windows.Forms.DataVisualization"
DataVisualization命名空间概述 (Overview of DataVisualization Namespace)
Dissecting a simple chart example
剖析一个简单的图表示例
Before diving into the details of this namespace, let’s first review what are the components of a chart, conceptually speaking.
从概念上讲,在深入研究此命名空间的细节之前,让我们首先回顾一下图表的组成部分。
You will find below a sample chart.
您将在下面的示例图表中找到。
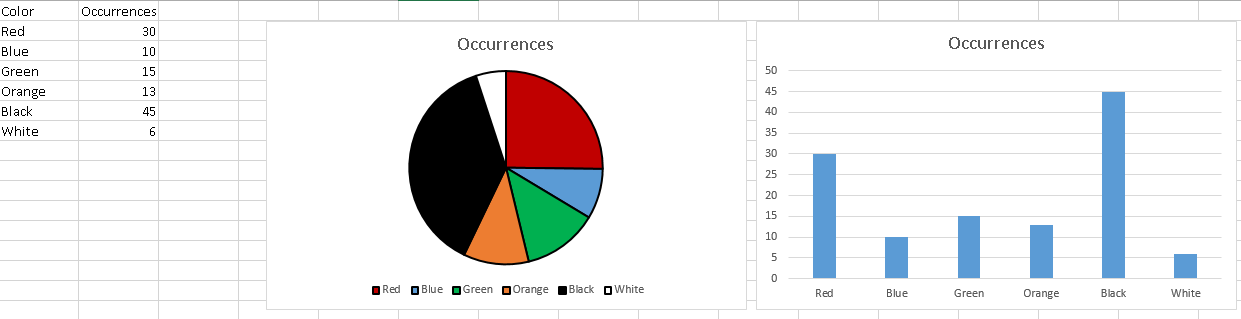
First, there is a title in this chart, then there is a chart area, a grid with at least two axes in which one or more data series will be found. Each data series consists in a set of (key,value) pairs. Finally, we can put a legend to our chart so that it tells which data series corresponds to which data type.
首先,此图表中有一个标题,然后是一个图表区域,即至少具有两个轴的网格,在其中可以找到一个或多个数据系列。 每个数据系列由一组(键,值)对组成。 最后,我们可以在图例中放置一个图例,以告诉您哪些数据系列与哪种数据类型相对应。
PowerShell classes we need to know in order to build a chart
我们需要了解的PowerShell类以构建图表
The developers of DataVisualization assembly did the same kind of work and segmented their code somewhat the same way.
DataVisualization程序集的开发人员执行相同的工作,并且以某种相同的方式对代码进行分段。
First, they defined a Chart class. All other objects presented below are attached to this object as direct attributes or attributes of its attributes (cascading dependency). It has a lot of properties that governs the way the chart will be displayed so as chart width and chart length or background color properties.
首先,他们定义了一个Chart类。 下面介绍的所有其他对象都作为直接属性或该属性的属性(级联依赖性)附加到此对象。 它具有许多控制图表显示方式的属性,例如图表宽度和图表长度或背景颜色属性。
They also defined a ChartArea class which defines the way the chart grid will look like, what will be the titles for each axis of the chart and so on. There can be multiple ChartAreas for a single Chart object instance. We can define properties like intervals or data types for each axis per ChartArea object instance.
他们还定义了一个ChartArea类,该类定义了图表网格的外观,图表各轴的标题等等。 一个Chart对象实例可以有多个ChartAreas。 我们可以为每个ChartArea对象实例的每个轴定义属性,例如间隔或数据类型。
Obviously, we will also find a Series class which holds the actual data that will be plotted in a given chart area.
显然,我们还将找到一个Series类,其中包含将在给定图表区域中绘制的实际数据。
As explained above, series are like a set of (key,value) pair which are referred to as data points. In DataVisualization namespace, these points have a corresponding object class called DataPoint.
如上所述,序列就像一组(键,值)对,称为数据点。 在DataVisualization命名空间中,这些点具有一个称为DataPoint的对应对象类。
Each series can be assigned a chart type. These types are defined in an enumeration called System.Windows.Forms.DataVisualization.Charting.SeriesChartType.
每个系列都可以分配一个图表类型。 这些类型在名为System.Windows.Forms.DataVisualization.Charting.SeriesChartType的枚举中定义。
Here are some common chart types that will eventually be used in following sections:
以下是一些最终将在以下各节中使用的常见图表类型:
- Bar 酒吧
- Line 线
- Pie 馅饼
- StackedArea(100) 堆积面积(100)
- StackedBar(100) StackedBar(100)
For a complete list, check the documentation page.
有关完整列表,请查看文档页面 。
In our dissection of a chart, we also noticed that a chart had a legend. There is also a class called Legend to materialize it.
在对图表的剖析中,我们还注意到图表具有图例。 还有一个称为Legend的类来实现它。
To sum up, here are the object classes we defined so far with a link to its corresponding documentation page:
综上所述,这是到目前为止我们定义的对象类,并带有指向其相应文档页面的链接:
NB: we could also create charts in 3D using a class called ChartArea3DStyle, but it’s not covered in this article.
注意:我们还可以使用称为ChartArea3DStyle的类在3D中创建图表,但本文未涉及。
结论 (Conclusion)
In this article, we’ve just covered some of the aspects of a Chart, presenting the namespace defined in the System.Windows.Forms.DataVisualization assembly and some of the classes that will be helpful in the creation of charts.
在本文中,我们仅介绍了Chart的某些方面,展示了System.Windows.Forms.DataVisualization程序集中定义的名称空间以及一些有助于创建图表的类。
Stay tuned because we will put into practice what we’ve learned so far in another article entitled “How to create charts for SQL Server data in PowerShell” that will come up in a few days!
请继续关注,因为我们将在几天后发表的题为“如何在PowerShell中为SQL Server数据创建图表”的文章中实践到目前为止所学到的知识!
In next article, you’ll be able to build these kinds of charts using PowerShell:
在下一篇文章中,您将能够使用PowerShell构建这些类型的图表:
Next article in this series:
本系列的下一篇文章:
翻译自: https://www.sqlshack.com/overview-powershell-charting-capabilities/
powershell


 963
963

 被折叠的 条评论
为什么被折叠?
被折叠的 条评论
为什么被折叠?
 到【灌水乐园】发言


