Power BI desktop helps to create interactive reports and dashboards from a high and complex volume of the data. The Power BI desktop is an integrated tool where we can get the data from different sources.
Power BI桌面有助于从大量复杂数据中创建交互式报告和仪表板。 Power BI桌面是一个集成工具,在这里我们可以从不同来源获取数据。
In this article, we are going to explore the below points
在本文中,我们将探讨以下几点
- Power BI Data Sources Power BI数据源
- Importing data into Power BI 将数据导入Power BI
- Adding Chord diagram for Power BI Visualizations 为Power BI可视化添加弦图
- Examples of to create and learn Chord diagram 创建和学习和弦图的示例
将数据导入Power BI Desktop (Importing Data into Power BI Desktop)
We can get the data from the different sources as mentioned above and transform them into business intelligence reports, charts, different kinds of visualization etc.
我们可以如上所述从不同的来源获取数据,并将其转换为商业智能报告,图表,各种可视化等。
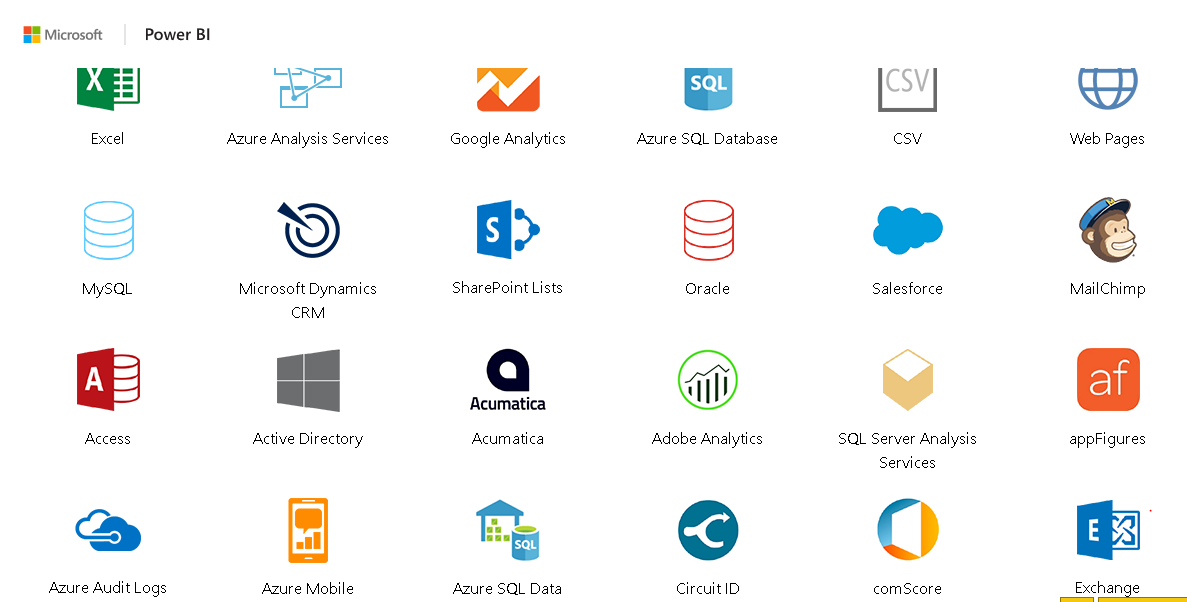
As per the PowerBI Microsoft, the sources we can pull data are:
根据PowerBI Microsoft,我们可以提取数据的来源是:
File |
Excel Text, CSV, XML, JSON, Folder, Sharepoint folder. |
Database |
- SQL Server, SQL Server Analysis service database,
- Oracle
- IBM DB2, IBM Informix, IBM Netezza
- MySQL
- PostgreSQL
- Sybase
- Teradata
- SAP Hana Database,
- SAP Business Warehouse application and Message server
- Amazon RedShift
- Impala
- Google Bigquery
- Snowflake
|
PowerBI |
- Power BI datasets
- Power BI data flows
|
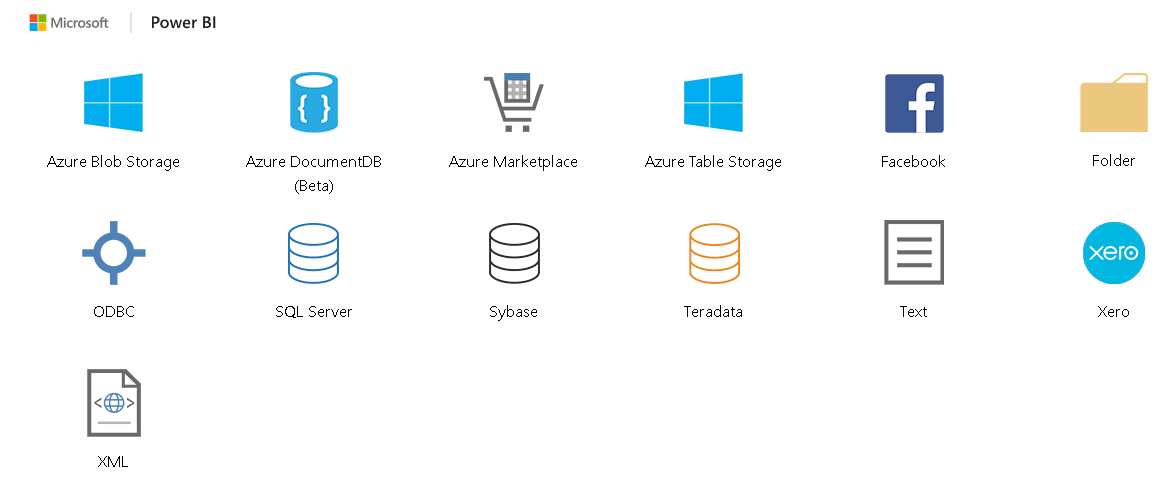
Azure |
- Azure SQL database
- Azure SQL Data Warehouse
- Azure Analysis Service databases
- Azure Blob Storage
- Azure table storage
- Azure Cosmos DB
- Azure Data lake Store
- Azure HDInsight
- Azure HDInsight Spark
- HDInsight Interactive Query
- Azure kusto
|
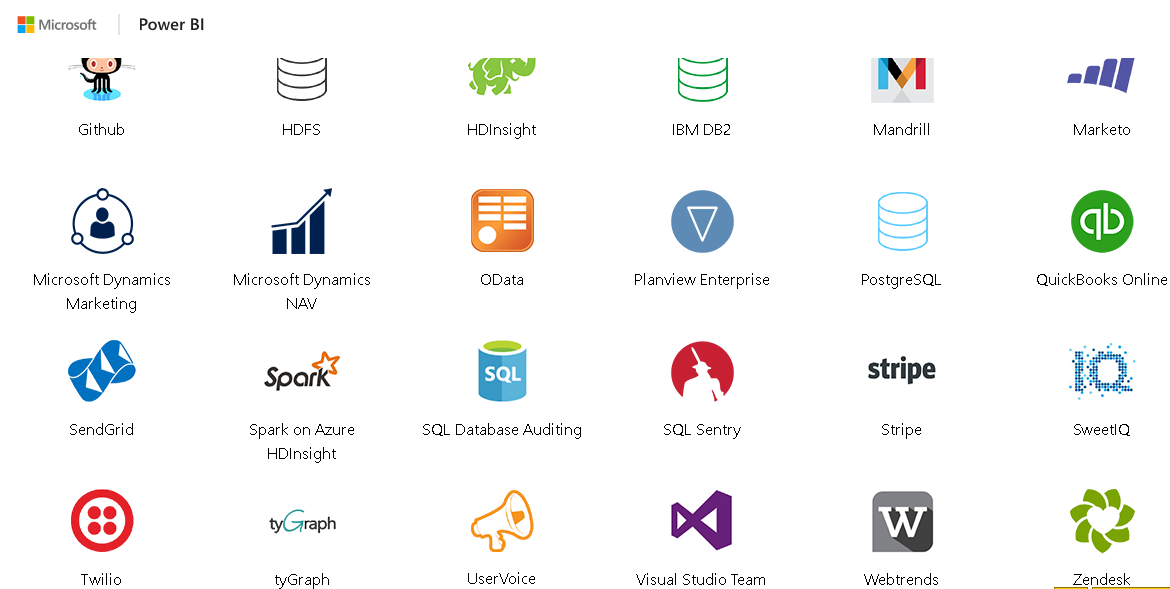
Online Services |
- SharePoint online list
- Microsoft Exchange Online
- Dynamics 365
- Dynamics NAV
- Microsoft Dynamics 365 Business Central
- Microsoft Azure Consumption Insight
- Visual Studio Team Services
- SalesForce objects and Reports
- Google Analytics
- Adobe Analytics
- Facebook
- Github
- Smartsheet
- Stripe
- SweetIQ
- Twilio
- tyGraph
- Webtrends
- Zendesk
|
Other |
- Vertica
- Web
- SharePoint list
- OData feed
- Active Directory
- Microsoft Exchange
- Hadoop File
- Spark
- RScript
- ODBC
- OLE DB
- Blank Query
|
文件 |
Excel文本,CSV,XML,JSON,文件夹,Sharepoint文件夹。 |
数据库 |
- SQL Server,SQL Server Analysis服务数据库,
- Oracle
- IBM DB2,IBM Informix,IBM Netezza
- MySQL
- PostgreSQL
- Sybase公司
- Teradata
- SAP Hana数据库,
- SAP Business Warehouse应用程序和消息服务器
- 亚马逊RedShift
- 黑斑羚
- Google Bigquery
- 雪花
|
PowerBI |
|
蔚蓝 |
- Azure SQL数据库
- Azure SQL数据仓库
- Azure Analysis Service数据库
- Azure Blob存储
- Azure表存储
- Azure Cosmos数据库
- Azure Data Lake商店
- Azure HDInsight
- Azure HDInsight Spark
- HDInsight交互式查询
- Azure库斯托
|
在线服务 |
- SharePoint在线列表
- Microsoft Exchange Online
- 动态365
- 动态资产净值
- Microsoft Dynamics 365商业中心
- Microsoft Azure消费见解
- Visual Studio团队服务
- SalesForce对象和报表
- 谷歌分析
- Adobe分析
- 脸书
- Github
- 智能表
- 条纹
- SweetIQ
- 特威里奥
- tyGraph
- 网络趋势
- Zendesk
|
其他 |
- Vertica
- 网页
- SharePoint列表
- OData提要
- 活动目录
- Microsoft Exchange
- Hadoop文件
- 火花
- 脚本
- ODBC
- OLE DB
- 空白查询
|


 Power BI desktop helps to create interactive reports and dashboards from a high and complex volume of the data. The Power BI desktop is an integrated tool where we can get the data from different ...
 最低0.47元/天 解锁文章


 1027
1027


 被折叠的 条评论
为什么被折叠?
被折叠的 条评论
为什么被折叠?
 到【灌水乐园】发言


