


As these reports don’t provide enough information for SQL Server performance monitoring and troubleshooting, Microsoft has created a set of performance dashboard reports that provide more insight into what’s going on with your SQL Server.
由于这些报告不能为SQL Server性能监视和故障排除提供足够的信息,因此Microsoft创建了一组性能仪表板报告,这些报告可提供有关SQL Server所发生情况的更多信息。
Although there are still no Performance Dashboard Reports for SQL Server 2014, we used the reports for SQL Server 2012 and tested them on SQL Server 2014.
尽管仍然没有SQL Server 2014的性能仪表盘报告,但我们使用了SQL Server 2012的报告并在SQL Server 2014上对其进行了测试。
Performance Dashboard Reports入门 (Getting started with Performance Dashboard Reports)
SQL Server Performance Dashboard Reports are custom reports made to make performance monitoring easier. Keep in mind that these are ready to use reports and SQL Server Reporting Services don’t have to be installed on the SQL Server where you will use them.
SQL Server性能仪表板报告是自定义报告,旨在简化性能监视。 请记住,这些报表可以立即使用,并且不必在要使用它们SQL Server上安装SQL Server Reporting Services。
Similar to standard reports, these reports help with identifying CPU usage, IO activity, blocks, bottlenecks, missing indexes, etc. As the values for the reports are mostly obtained from dynamic management views, such as sys.dm_os_performance_counters, sys. dm_os_memory_clerks, sys.dm_exec_requests, etc. no overhead is added to monitor the performance. To be able to query these views, the SQL Server login must have the VIEW SERVER STATE server permission.
与标准报告类似,这些报告可帮助识别CPU使用率,IO活动,块,瓶颈,索引丢失等。由于报告的值主要来自于动态管理视图,例如sys.dm_os_performance_counters和sys。 dm_os_memory_clerks , sys.dm_exec_requests等。不增加开销来监视性能。 为了能够查询这些视图,SQL Server登录名必须具有“视图服务器状态”服务器权限。
安装性能仪表盘报告 (Installation of Performance Dashboard Reports)
- Microsoft® SQL Server® 2012 Performance Dashboard ReportsMicrosoft®SQLServer®2012性能仪表板报告
- Start the installer and follow the steps and instructions. By default, the setup unpacks the files into C:\Program Files (x86)\Microsoft SQL Server\110\Tools\Performance Dashboard. Besides the reports (.rdl files), this folder also contains a chm help file, read me file that is actually a step by step guide on what to do next, and the setup.sql file that should be used in the next step 启动安装程序,然后按照步骤和说明进行操作。 默认情况下,安装程序会将文件解压缩到C:\ Program Files(x86)\ Microsoft SQL Server \ 110 \ Tools \ Performance Dashboard。 除了报告(.rdl文件)之外,此文件夹还包含一个chm帮助文件,“请阅读”文件(实际上是有关下一步操作的逐步指南)以及下一步应使用的setup.sql文件。
- To be able to use the reports, Performance Dashboard Reports functions and stored procedures have to be installed on every SQL Server instance you want to monitor. To do that, open the setup.sql file and execute it against the SQL Server instance using SQL Server Management Studio, or any other integrated developer environment. The script creates one table and multiple stored procedures, table valued, and scalar valued functions in the in msdb database. All created objects are in the MS_PerfDashboard schema. 为了能够使用这些报告,必须在要监视的每个SQL Server实例上安装Performance Dashboard Reports函数和存储过程。 为此,请打开setup.sql文件,并使用SQL Server Management Studio或任何其他集成的开发人员环境针对SQL Server实例执行该文件。 该脚本在msdb数据库中创建一个表和多个存储过程,表值和标量值函数。 所有创建的对象都在MS_PerfDashboard模式中。
- Repeat step 3 against all SQL Server instances you will monitor 对您将监视的所有SQL Server实例重复步骤3
如何使用报告 (How to use the reports)
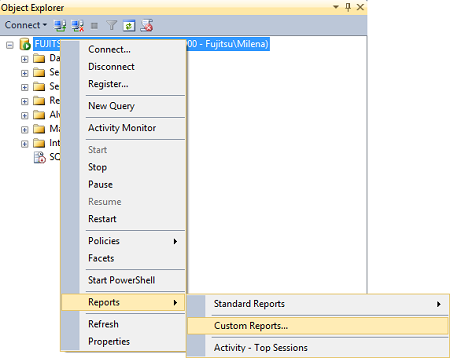
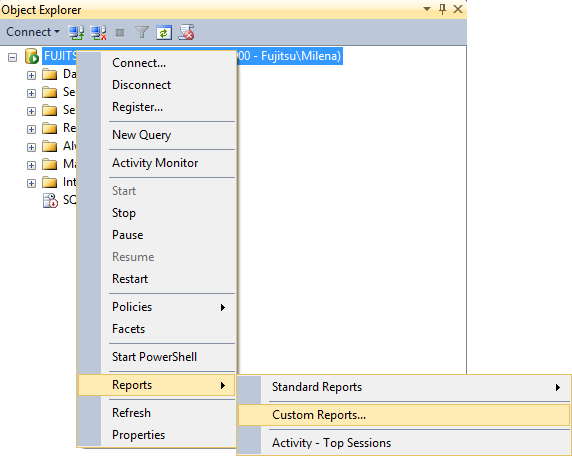
- In Object Explorer, right-click the SQL Server instance 在对象资源管理器中,右键单击SQL Server实例
Select Reports|Custom Reports
选择报告|自定义报告
The Performance Dashboard Reports are not listed, like the Standard reports are, but opened as files
与标准报告不同,性能仪表盘报告未列出,但以文件形式打开
- Open File dialog shows the folder where the Performance Dashboard Reports installer was unpacked. Only the report (*.rdl) files are shown打开文件”对话框显示了Performance Dashboard Reports安装程序的解压缩文件夹。 仅显示报告(* .rdl)文件
- Select the performance_dashboard_main.rdl file 选择performance_dashboard_main.rdl文件
If you get the Run Custom Report warning, click Run as the reports come from a trustworthy source and there’s no threat
如果收到“ 运行自定义报告”警告,请单击“运行”,因为报告来自可信赖的来源并且没有威胁
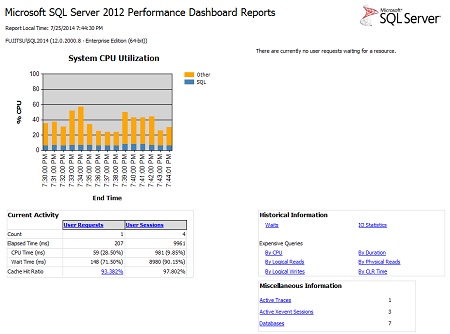
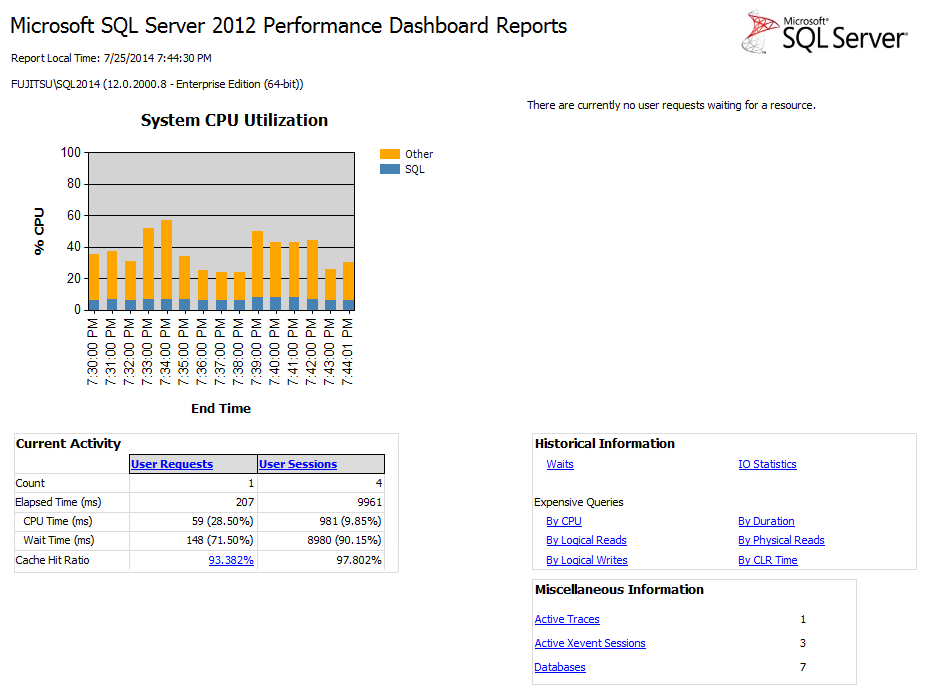
This is the main dashboard from which you can go to all other available reports by selecting the links in the report.
这是主要的仪表板,您可以通过选择报告中的链接从其访问所有其他可用的报告。
If you haven’t disabled the Run Custom Report warnings, each time you click a link in the report, you will get the path and the name of the Performance Dashboard Report that will be opened, so you can match reports in the dashboard to the .rdl files in the Performance Dashboard folder, as their names aren’t always identical. For example, the Cache hit ratio for the User requests opens the wait_buffer_io.rdl report.
如果您尚未禁用“ 运行自定义报告”警告,则每次单击报告中的链接时,都将获取将打开的性能仪表板报告的路径和名称,因此可以将仪表板中的报告与Performance Dashboard文件夹中的.rdl文件,因为它们的名称并不总是相同。 例如, 用户请求的缓存命中率将打开wait_buffer_io.rdl报告。
The dashboard shows processor usage for the last 15 minutes, by both SQL Server and operating system, and basic information for current and historical activity.
仪表板显示了SQL Server和操作系统在最近15分钟内的处理器使用情况,以及当前和历史活动的基本信息。
A recommended value for the processor usage is up to 80%. Peaks when some heavy processing is performed are acceptable. Occasional peaks without a known reason should be investigated. If the processor usage is constantly over 80%, consider deeper query, index, database design analysis, adding more hardware resources, or distributing load on other servers.
处理器使用率的建议值最高为80%。 进行一些繁重的处理时达到峰值是可以接受的。 无已知原因的偶发峰应进行调查。 如果处理器使用率持续超过80%,请考虑进行更深入的查询,索引,数据库设计分析,添加更多硬件资源或在其他服务器上分配负载。
To go back to the parent report, click the Navigate backward icon in the report menu (the first on the left), or press Ctrl and – on the keyboard.
要返回上级报告,请单击报告菜单中的向后导航图标(左侧第一个),或按键盘上的Ctrl和–。
用户要求 (User requests)
The User requests or Current requests report shows the currently running user code. For each request, the complete script executed is shown, as well as the execution start time, status, wait statistics, processor time, logical and physical reads, granted query memory, etc.
用户请求或当前请求报告显示当前正在运行的用户代码。 对于每个请求,将显示已执行的完整脚本,以及执行开始时间,状态,等待统计信息,处理器时间,逻辑和物理读取,已授予的查询内存等。
用户会话 (User sessions)
The User sessions report shows all user sessions (seeping and running) currently active on the SQL Server instance. There’s also an option to show system sessions. For each session, the following information is shown: the session ID, status, CPU time, memory usage, logical and physical reads, writes, login name, program name, host name, NT domain, NT user name, as well as last request start and end times.
“ 用户会话”报告显示了当前在SQL Server实例上处于活动状态的所有用户会话(渗透和运行)。 还有一个选项可以显示系统会话。 对于每个会话,将显示以下信息:会话ID,状态,CPU时间,内存使用情况,逻辑和物理读取,写入,登录名,程序名,主机名,NT域,NT用户名以及最后请求开始和结束时间。
缓冲区IO等待 (Buffer IO Waits)
The Buffer IO Waits report shows the ratio of pages read from buffer and total number of pages read. If the page is not read from buffer, it has to be read from disk, which degrades performance.
缓冲区IO等待报告显示了从缓冲区读取的页面与读取的页面总数之比。 如果未从缓冲区读取页面,则必须从磁盘读取页面,这会降低性能。
The recommended value is higher than 95%. However, this metric can be misleading, as high values are shown even when performance suffers. Therefore, it’s recommended to use some other memory metrics, such as Page Life Expectancy, Page reads/sec, and Free Pages
推荐值高于95%。 但是,该指标可能会产生误导,因为即使在性能下降的情况下也会显示较高的值。 因此,建议使用其他一些内存指标,例如“ 页面预期寿命”,“每秒页面读取数”和“ 空闲页面”
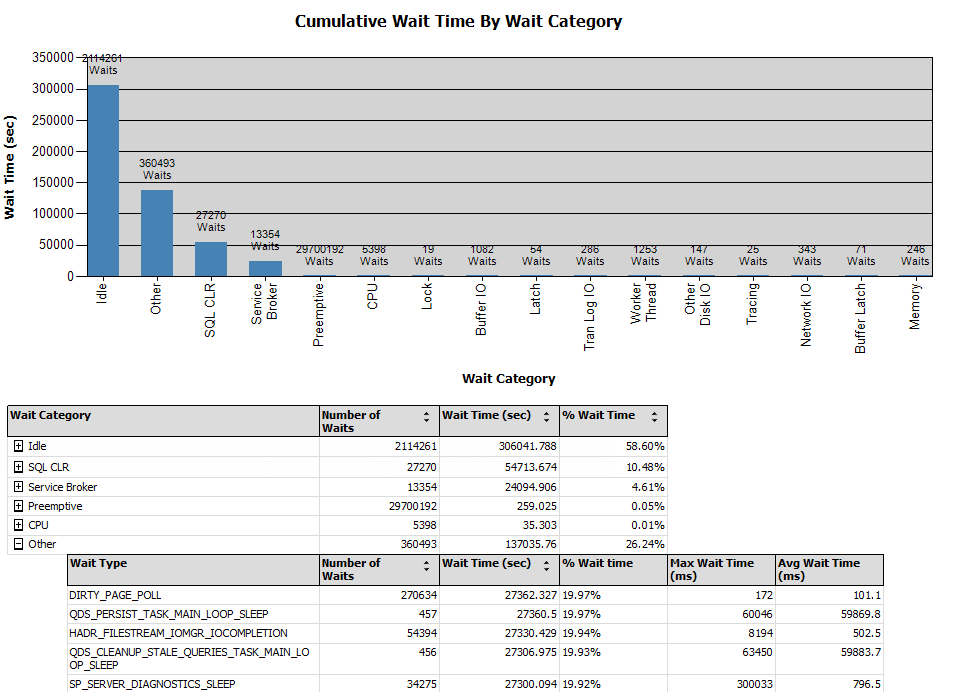
等待 (Waits)
The Waits report shows the information about the SQL Server processes waiting to be processed. The information is obtained from the sys.dm_os_wait_stats dynamic management view.
等待报告显示有关等待处理SQL Server进程的信息。 该信息是从sys.dm_os_wait_stats动态管理视图获得的。
SQL Server supports more than 200 wait types, but the report shows similar waits grouped into the same category with user-friendly category names. For example, all waits where the wait_type column has the value like LCK_M (LCK_M_SCH_S, LCK_M_SCH_M, LCK_M_S, etc.) are summed and shown as Lock waits in the report, all waits with the wait type like LATCH (LATCH_NL, LATCH_KP, LATCH_SH, etc. ) are shown as Latch, etc.
SQL Server支持200多种等待类型,但是该报告显示了类似的等待,并使用用户友好的类别名称将其分组到同一类别中。 例如,所有wait_type列的值如LCK_M(LCK_M_SCH_S,LCK_M_SCH_M,LCK_M_S等)的所有等待都被汇总并显示为报告中的“ 锁定等待 ”,所有等待的类型均与LATCH(LATCH_NL,LATCH_KP,LATCH_SH,等)显示为Latch等。
You can find the conditions used for wait grouping in the MS_PerfDashboard.fn_WaitTypeCategory function.
您可以在MS_PerfDashboard.fn_WaitTypeCategory函数中找到用于等待分组的条件。
IO统计 (IO statistics)
The IO statistics report shows the reads and writes (percentage, number, and wait time) for each database. Note that the values shown are cumulative since the last SQL Server start.
IO统计信息报告显示每个数据库的读取和写入(百分比,数量和等待时间)。 请注意,显示的值是自上次SQL Server启动以来的累积值。
The report also shows 20 tables with the highest IO activity and indicates whether there is a missing index on the table, as that can be a cause for IO high values.
该报告还显示了IO活动最高的20个表,并指出表上是否缺少索引,因为这可能是IO高值的原因。
昂贵的查询 (Expensive queries)
A set of expensive query reports shows the information about 20 queries that use the most resources, grouped by different categories: processor time, duration, logical reads, physical reads, logical writes, and CLR time. The same rdl report, query_stats is used for all reports.
一组昂贵的查询报告显示了有关20个使用最多资源的查询的信息,这些查询按不同类别分组:处理器时间,持续时间,逻辑读取,物理读取,逻辑写入和CLR时间。 相同的rdl报告query_stats用于所有报告。
The information in this report is obtained from sys.dm_exec_query_stats. Note that the view doesn’t contain the information about statements other than DML statements (INSERT, UPDATE, DELETE, and SELECT), therefore, some other resource intensive operations, such as creating a full database backup, are not shown in the report, making it potentially misleading.
该报告中的信息是从sys.dm_exec_query_stats获得的。 请注意,该视图不包含有关DML语句(INSERT,UPDATE,DELETE和SELECT)以外的语句的信息,因此,报告中未显示其他一些资源密集型操作,例如创建完整的数据库备份,使其具有潜在的误导性。
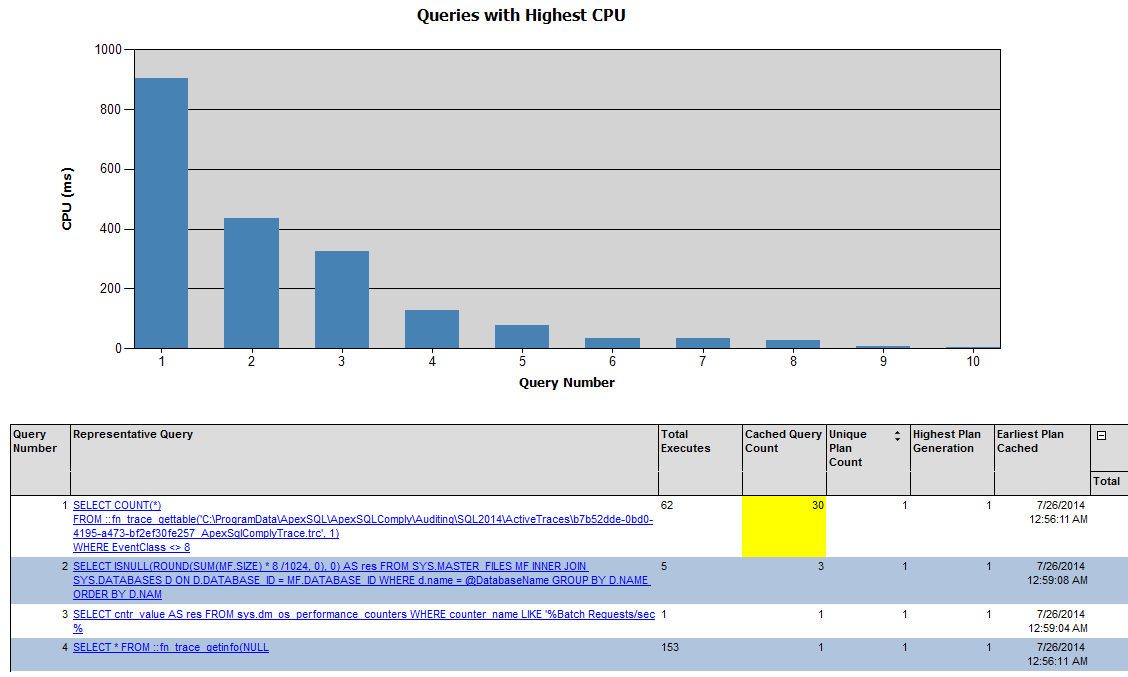
To drill down into the query, click the link in the Representative Query column, and a new report showing the query plan is opened. This report provides two new reports where applicable: the plan guide and missing indexes.
要深入查询,请单击“ 代表性查询”列中的链接,然后打开一个显示查询计划的新报告。 该报告在适用时提供了两个新报告:计划指南和缺失索引。
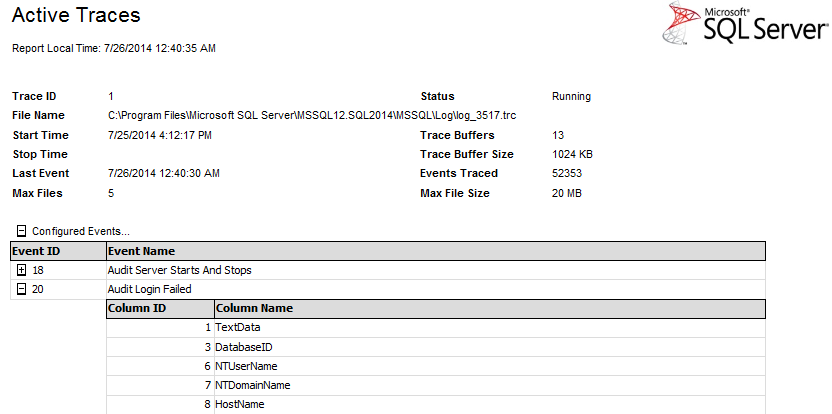
杂项信息 (Miscellaneous information)
This section contains three reports: Active traces, Active Xevent sessions, and Databases.
本节包含三个报告: 活动跟踪 , 活动Xevent会话和数据库 。
The Active traces report shows results only when at least one SQL trace is running. Otherwise, the link in the main dashboard will be disabled and the traces.rdl file will show no results. The report shows the trace start time, status, .trc file path and name, buffer size, number of buffers, as well as captured event names.
“ 活动跟踪”报告仅在至少运行一个SQL跟踪时显示结果。 否则,主仪表板中的链接将被禁用,traces.rdl文件将不显示任何结果。 该报告显示跟踪开始时间,状态,.trc文件路径和名称,缓冲区大小,缓冲区数量以及捕获的事件名称。
The Active Xevent sessions report is similar to the Active traces report, just shows the information for the running extended event sessions. Both Active traces and Active Xevent sessions use the same rdl report, traces.rdl.
Active Xevent会话报告类似于Active traces报告,仅显示有关正在运行的扩展事件会话的信息。 活动跟踪和活动Xevent会话都使用相同的rdl报告traces.rdl。
The Databases report shows basic information about all databases hosted on the SQL Server instance: the name, compatibility level, recovery model, size, etc.
数据库报告显示有关SQL Server实例上托管的所有数据库的基本信息:名称,兼容性级别,恢复模型,大小等。
To uninstall Performance Dashboard Reports, use Windows Control Panel, Uninstall a program.
要卸载Performance Dashboard Reports,请使用Windows控制面板 , 卸载程序 。
SQL Server Performance Dashboard Reports show some of the commonly monitored performance metrics. Although there is no new release for SQL Server 2014, Microsoft SQL Server 2012 Performance Dashboard Reports can be used on SQL Server 2014 without any issues. They provide deeper and more useful information about SQL Server performance than SQL Server Management Studio standard reports, but still not sufficient for any deeper performance troubleshooting.
SQL Server性能仪表板报告显示了一些通常监视的性能指标。 尽管没有针对SQL Server 2014的新版本,但可以在SQL Server 2014上使用Microsoft SQL Server 2012性能仪表板报告,而不会出现任何问题。 与SQL Server Management Studio 标准报告相比 ,它们提供了有关SQL Server性能的更深入,更有用的信息,但仍不足以进行任何更深入的性能故障排除。
翻译自: https://www.sqlshack.com/performance-dashboard-reports-sql-server-2014/


 被折叠的 条评论
为什么被折叠?
被折叠的 条评论
为什么被折叠?
 到【灌水乐园】发言


