


SQL Server 2017 and SQL Server 2019 supports both the Linux operating system. As part of performance troubleshooting or monitoring resources in Windows system, we need to check certain things like disk space, CPU or Memory consumption, check running processes, uptime etc. We can get the information, on a windows based SQL server, from the task manager.
SQL Server 2017和SQL Server 2019都支持Linux操作系统。 作为性能故障排除或监视Windows系统中资源的一部分,我们需要检查某些事情,例如磁盘空间,CPU或内存消耗,检查正在运行的进程,正常运行时间等。我们可以在基于WindowsSQL Server上从任务中获取信息。经理。
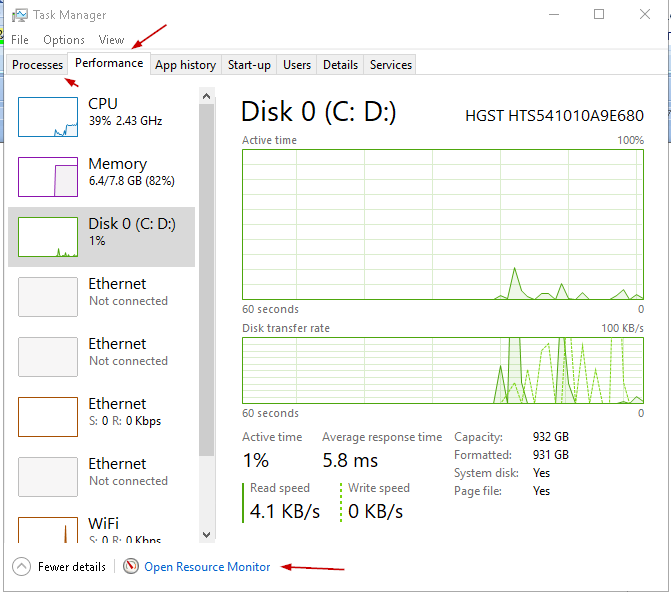
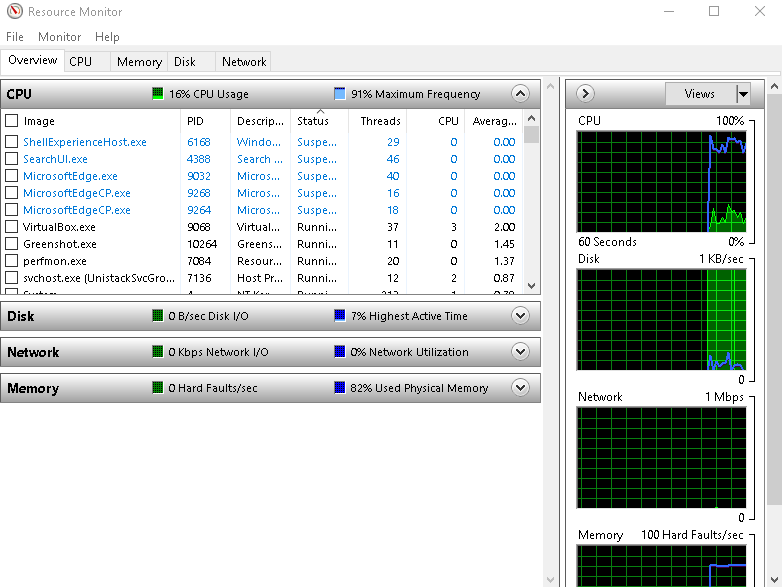
We can get more detail in the window system using the ‘Resource Monitor’ as shown here:
我们可以使用“资源监视器”在窗口系统中获得更多详细信息,如下所示:
Now, since SQL Server runs on Linux as well, we must know the respective commands on this OS and interpret the data to get useful information. In Linux, we need to use command line tools to get the data. We need to read the data from the command output. It is different from the windows environment where we used to do most of the work in GUI mode.
现在,由于SQL Server也可以在Linux上运行,因此我们必须知道此OS上的相应命令并解释数据以获得有用的信息。 在Linux中,我们需要使用命令行工具来获取数据。 我们需要从命令输出中读取数据。 它与Windows环境不同,在Windows环境中,我们曾经以GUI模式进行大多数工作。
In this article, we will explore ‘top’ command in Linux.
在本文中,我们将探讨Linux中的“ top”命令。
Linux中的“ top”命令 (‘top’ command in Linux)
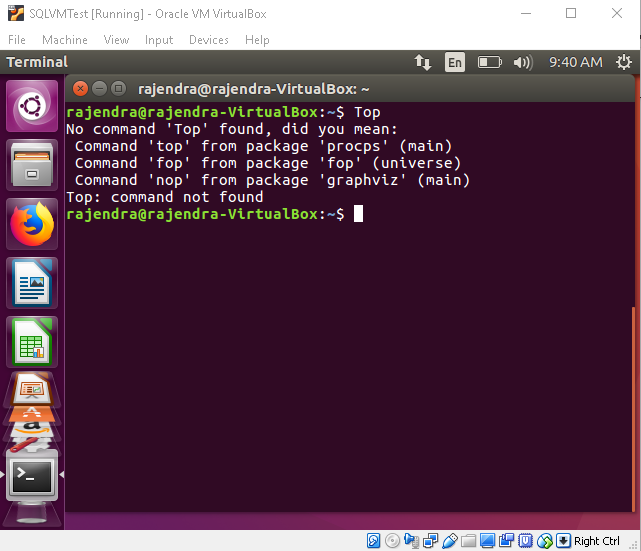
We get the information about the CPU and memory utilization by the ‘top’ command in Linux. It is case sensitive command so we need to use the command ‘top’ instead of ‘Top’.
我们在Linux中通过“ top”命令获取有关CPU和内存利用率的信息。 这是区分大小写的命令,因此我们需要使用命令“ top”而不是“ Top”。
If we run the command ‘Top’ we get the error message ‘Top: command not found’
如果我们运行命令“ Top”,则会收到错误消息“ Top:找不到命令”
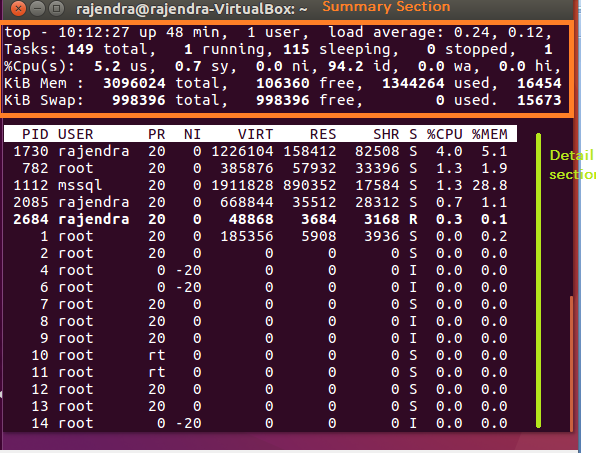
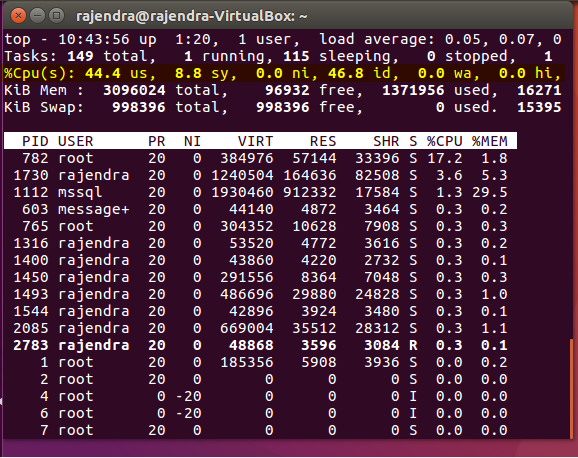
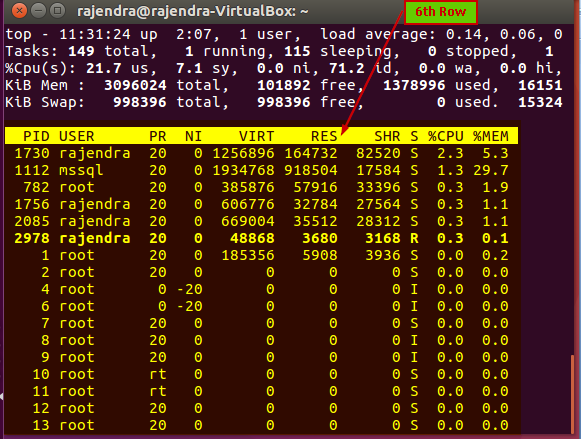
Run the command ‘top’ in the terminal and you get the output as per the screenshot:
在终端中运行命令“ top”,然后按照屏幕快照获取输出:
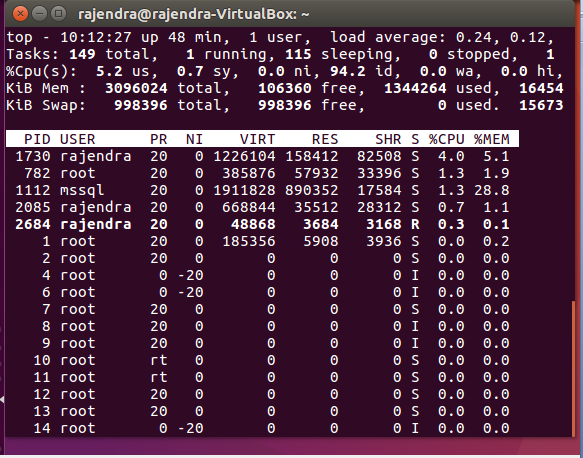
We need to understand this output in order to get useful information.
我们需要了解此输出以获得有用的信息。
- Summary Section: In this section, we get an overview of the uptime, CPU, Memory, swap file etc 摘要部分:在本部分中,我们将对正常运行时间,CPU,内存,交换文件等进行概述。
- Detail Section: in this section, we get detail information about each process, tasks running 详细信息部分:在本部分中,我们获得有关每个流程,正在运行的任务的详细信息
You can view both the sections in the below image
您可以在下图中查看两个部分
We will understand the result on a row basis. Overall output can be divided into two sections.
我们将连续了解结果。 总体输出可分为两部分。
第一行摘要 (First Row summary)
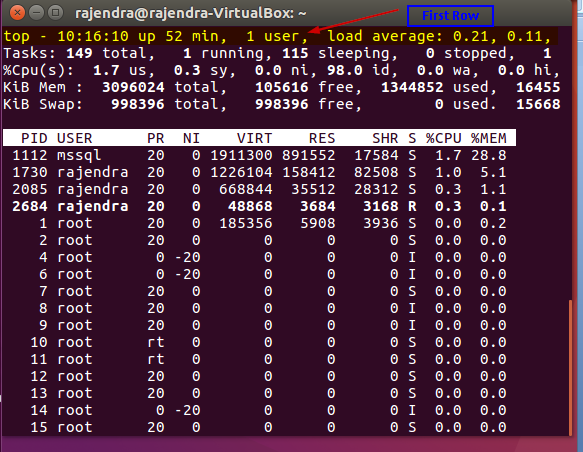
In the first row, we get the below information:
在第一行中,我们获得以下信息:
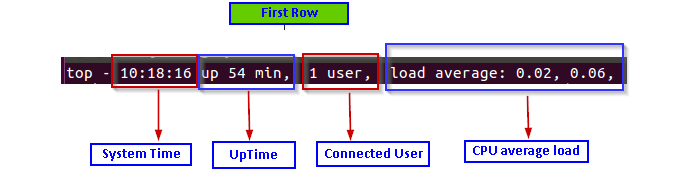
- Current system time (10:18:16) 当前系统时间(10:18:16)
- Uptime of the system (up 54 min) 系统正常运行时间(长达54分钟)
- Count of logged in users (1 user) 已登录用户数(1个用户)
- Average CPU load (load average: 0.02, 0.06) – 0.02 in last minute and 0.06 in last five minutes 平均CPU负载(平均负载:0.02、0.06)–最后一分钟为0.02,最近五分钟为0.06
第二行摘要 (Second Row summary)
In the second row, we get information about the number of process running along with their current state
在第二行中,我们获得有关正在运行的进程数及其当前状态的信息
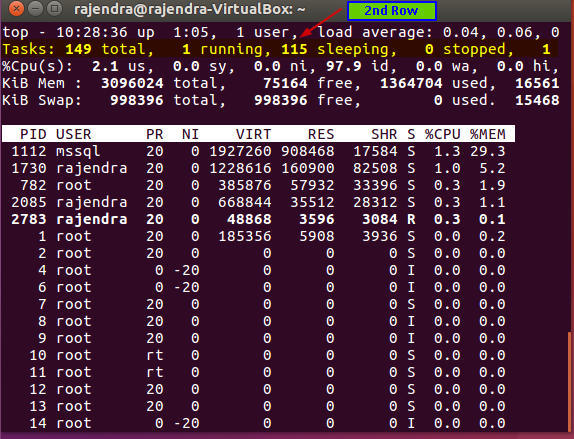
The second row gives below information:
第二行提供以下信息:
- Total number of tasks 任务总数
- A number of currently running tasks 许多当前正在运行的任务
- A total number of tasks in a sleeping state 处于睡眠状态的任务总数
- Total number of stopped tasks 停止的任务总数
- A total number of processes in a zombie state 僵尸状态下的进程总数
Note: A “Zombie” state means that process has completed execution but it still exists in the process table. We might understand this as a child-parent process. The child process is completed and waiting for the parent task to process it. This child process will be in a zombie state.
注意:“僵尸”状态表示进程已完成执行,但仍存在于进程表中。 我们可能将其理解为儿童父母的过程。 子进程已完成,正在等待父任务对其进行处理。 该子进程将处于僵尸状态。
第三行摘要 (Third Row summary)
In the third row, we get information about the CPU utilization on the server.
在第三行中,我们获得有关服务器上CPU使用率的信息。
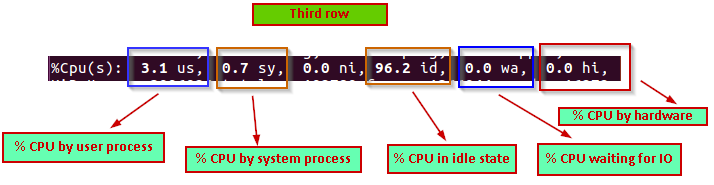
In the third row, we can see the following information:
在第三行中,我们可以看到以下信息:
- 3.1 us % CPU used by the user processes 用户进程使用的CPU 3.1%
- 0.7 sy % CPU used by the system processes 0.7 sy%系统进程使用的CPU
- 96.2 id % CPU by in idle state 96.2 id%CPU处于空闲状态
- 0.0 wa % CPU waiting for IO 等待IO的0.0 wa%CPU
- 0.0 hi % CPU time by hardware interrupts 硬件中断的CPU时间为0.0 hi%
第四行摘要 (Fourth row summary)
In the fourth row, we get the memory utilization in the server.
在第四行中,我们获得服务器中的内存利用率。
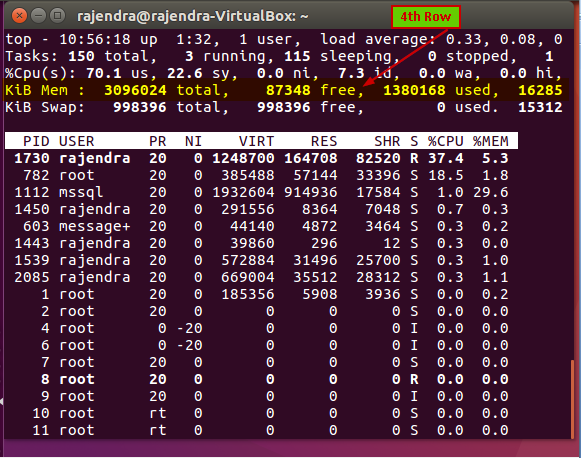
We can see the memory utilization information as:
我们可以看到内存利用率信息为:
- 3096024 total: Total system memory in KB 3096024总计:系统总内存,以KB为单位
- 96564 free: Available memory in KB 96564可用:可用内存(以KB为单位)
- 1370404 used: Used memory in KB 1370404使用的:已用的内存以KB为单位
- 16290: Memory used by the buffer cache in KB 16290:缓冲区缓存使用的内存(以KB为单位)
第五行摘要 (Fifth Row summary)
In the fifth row, we get information about the swap memory utilization. We can consider swap memory as the page file in the windows system.
在第五行中,我们获得有关交换内存利用率的信息。 我们可以将交换内存视为Windows系统中的页面文件。
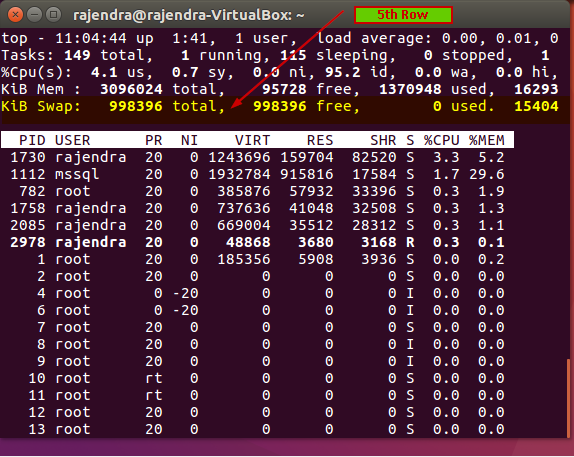
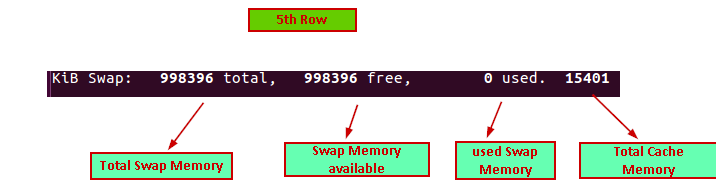
Below is the information in the 5th row:
以下是第五行中的信息:
- 998396 total: Total swap memory in KB 998396总计:总交换内存,以KB为单位
- 988396 free: Available swap memory in KB 988396可用:可用的交换内存以KB为单位
- 0 used: Currently used swap memory in KB 0使用:当前使用的交换内存(以KB为单位)
- 15401: Total Cache memory 15401:总缓存内存
第六行摘要 (Sixth Row summary)
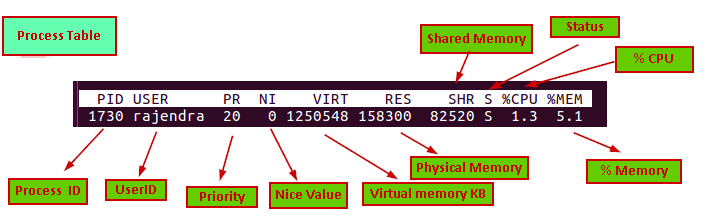
In the sixth row, we get a user process table:
在第六行,我们得到一个用户进程表:
Let us understand the columns in the process table:
让我们了解过程表中的列:
- PID: this is the process id of the running process PID :这是正在运行的进程的进程ID
- User: It is the user id for which the process is running 用户 :它是正在为其运行进程的用户标识
- PR: it is the process priority. We can see value ‘rt’ in this column as well. RT means the process is running real-time PR :这是过程优先级。 我们也可以在此列中看到值“ rt”。 RT表示流程正在实时运行
- Ni: It is the nice value of the process running. The negative value on this column shows high priority. Nice value range is -20 to 19 in which -20 is the highest and 19 lowest value Ni :这是流程运行的不错的价值。 此列上的负值显示高优先级。 好的值范围是-20到19,其中-20最高,19最低值
- VIRT: It is the virtual memory in KB used the process VIRT :它是使用KB的虚拟内存的过程
- RES: it is the physical memory in KB used by that particular process RES:这是该特定进程使用的物理内存(以KB为单位)
- SHR: it is the shared memory used by the process in KB SHR :它是进程使用的共享内存,以KB为单位
- S: it defines process status(S- Sleeping, R- running, I- idle, Z-Zombie) S:定义过程状态(S-睡眠,R-运行,I-空闲,Z-僵尸)
- %CPU:% CPU used by the process
- CPU百分比:进程使用的CPU百分比
- %MEM: % memory used by the process %MEM :进程使用的%内存
Now let us do understand how we can format the data sections as per our requirement to understand it more quickly.
现在让我们了解如何根据需要格式化数据部分,以便更快地理解数据部分。
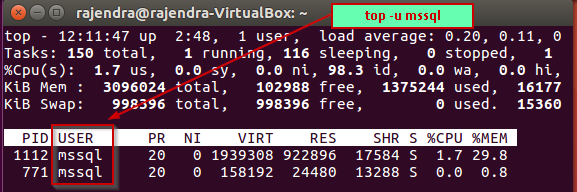
- Filter result based on the user id: We can filter out the result specific to user id with the ‘u’ option. For example, if we want to filter out the top command results for the ‘mssql’ user, we can run below command 根据用户ID过滤结果:我们可以使用'u'选项过滤出特定于用户ID的结果。 例如,如果我们要过滤掉“ mssql”用户的顶部命令结果,则可以在下面的命令中运行
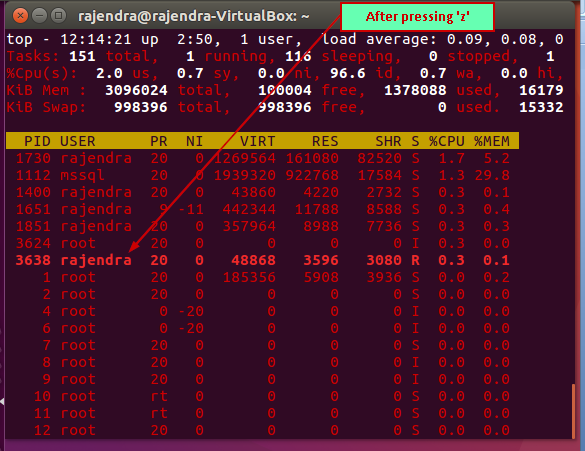
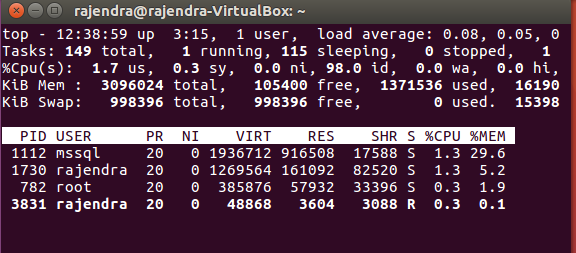
Highlight Running Process in Top: If we want to highlight current running process in bold letters, we can do by pressing ‘z‘ in running top command results. It changes the output as shown here. The current active session will be in the bold letter
在顶部突出显示正在运行的过程:如果要以粗体突出显示当前正在运行的过程,可以通过在顶部运行命令结果中按“ z”来完成。 它将更改输出,如下所示。 当前的活动会话将以粗体显示
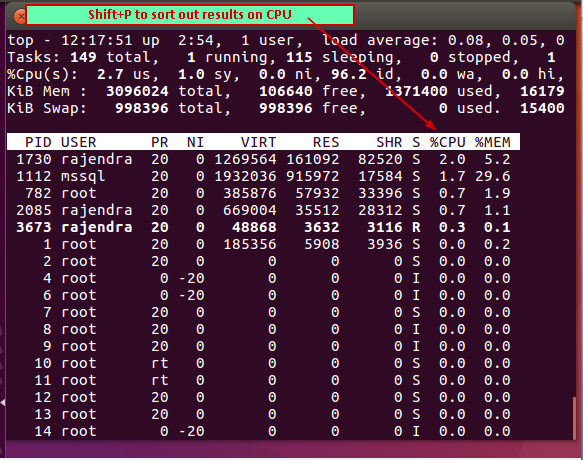
- Sort by CPU: Suppose we want to sort out the results based on the CPU time. We need to press (Shift+ P) to sort out the results on CPU time 按CPU排序:假设我们要根据CPU时间对结果进行排序。 我们需要按(Shift + P)来整理CPU时间的结果
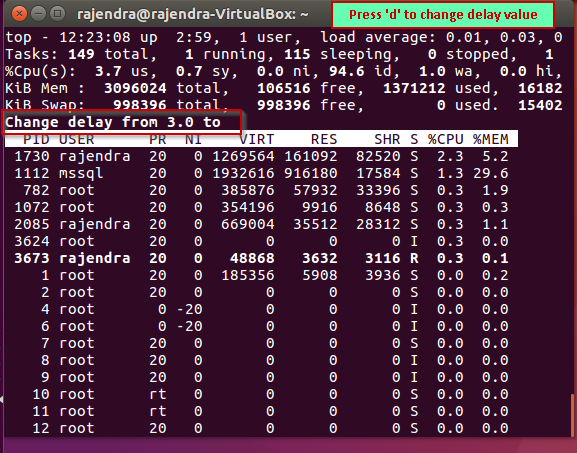
- Refresh Display: By default, top command results refresh the information every 3 seconds. If we want to refresh data before 3 seconds, we can press click on the terminal and press ‘Enter’刷新显示:默认情况下,top命令结果每3秒刷新一次信息。 如果我们想在3秒钟之前刷新数据,我们可以在终端上按一下click,然后按Enter键。
Alternatively, if we want to change the refresh interval from 3 seconds, press ‘d’ and enter the delay value in seconds.
或者,如果我们想将刷新间隔更改为3秒,请按“ d”并输入延迟值(以秒为单位)。
For example, I want to change the refresh interval from 3 seconds to 5 seconds, so enter value ‘5’ and press ‘Enter’ to save and apply this refresh interval setting.
例如,我要将刷新间隔从3秒更改为5秒,因此输入值“ 5”并按“ Enter”以保存并应用此刷新间隔设置。
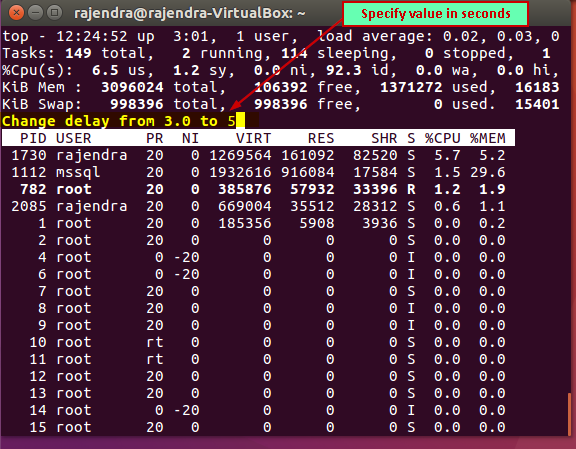
Press ‘Enter’ to save this new delay value. Now the data will be refreshed every 5 seconds.
按“ Enter”保存此新延迟值。 现在,数据将每5秒刷新一次。
显示模式 (Display Mode)
In the top results, we can see the summary and the task data appears in the single screen. This is the default behavior. We can change the display to represent the field group. We can have maximum four-display field group.
在最上面的结果中,我们可以看到摘要,并且任务数据显示在单个屏幕中。 这是默认行为。 我们可以更改显示以表示字段组。 我们最多可以有四个显示字段组。
Below are the field group windows:
以下是字段组窗口:
- Def: here, results are sorted by %CPU Def :此处,结果按%CPU排序
- Job: here, results are sorted by PID Job :这里,结果按PID排序
- Mem: here, results are sorted by %MEM 内存 :此处,结果按%MEM排序
- User: here, results are sorted by User field 用户 :此处,结果按“用户”字段排序
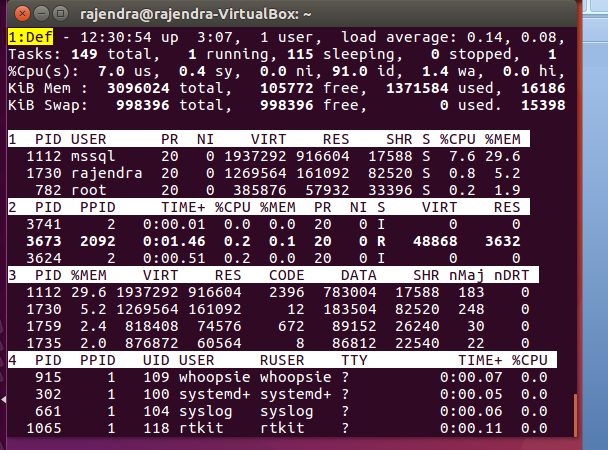
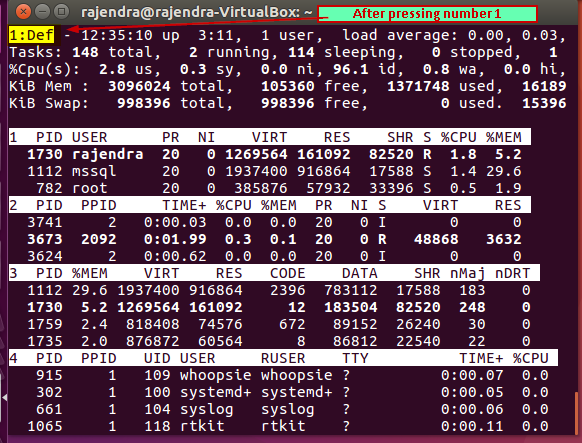
Press ‘A’ to switch to field group display mode. The output changes as shown below. Initially, it shows the field group 1 ‘Def’
按“ A”切换到字段组显示模式。 输出变化如下所示。 最初,它显示了字段组1“ Def”
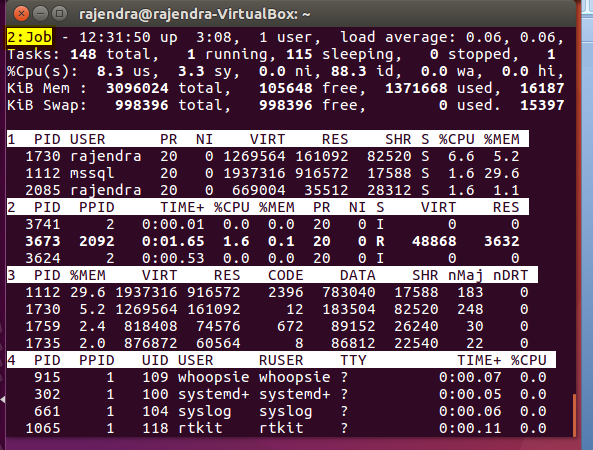
Press ‘a’ to move to next field group. Below you can see it switch to ‘job’
按“ a”移至下一个字段组。 在下面您可以看到它切换到“工作”
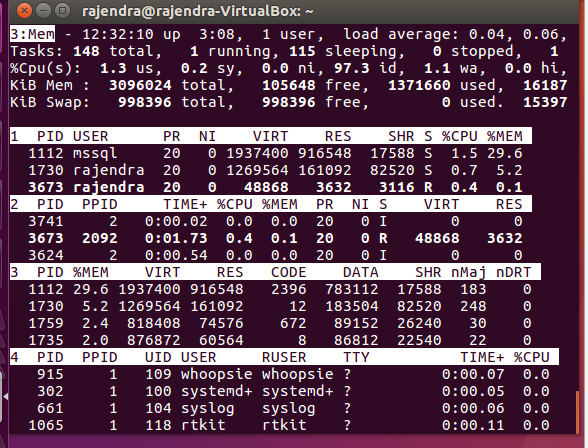
Again press ‘a’ and it switches to ‘Mem’
再次按“ a”,它将切换到“ Mem”
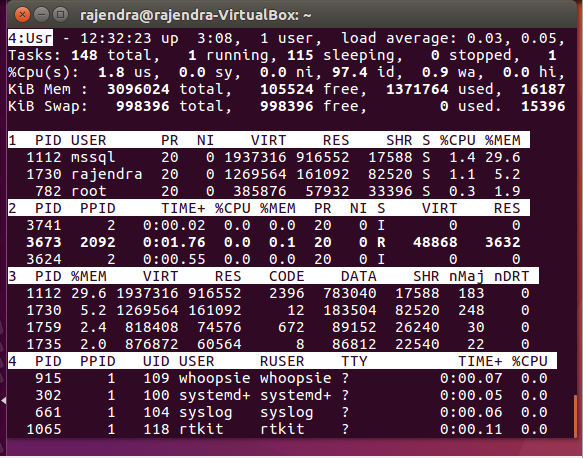
Last field group is ‘Usr’ as shown here:
最后一个字段组是“ Usr”,如下所示:
If we want to switch to a particular group, press ‘g’ and enter the field group name.
如果要切换到特定组,请按“ g”并输入字段组名称。
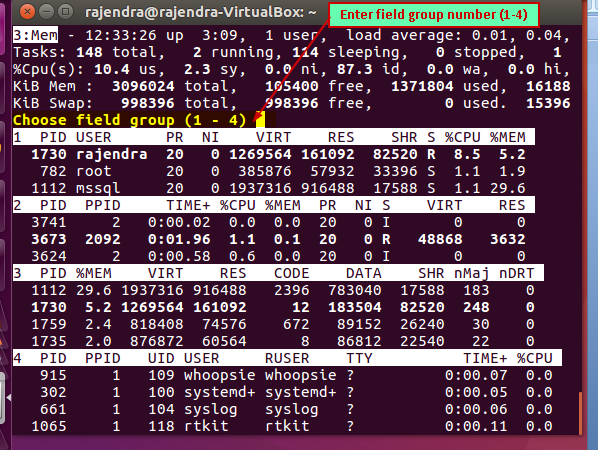
Once you enter the field group number, it immediately switches to that group. For example, in the below screenshot, I pressed ‘1’.
输入字段组编号后,它将立即切换到该组。 例如,在下面的屏幕截图中,我按下了“ 1”。
删除空闲任务 (Remove idle tasks)
If we do not want to see idle tasks in the output, press ‘i’ and it does not idle tasks.
如果我们不想在输出中看到空闲任务,请按“ i”,它不会空闲任务。
排序列 (Sorted columns)
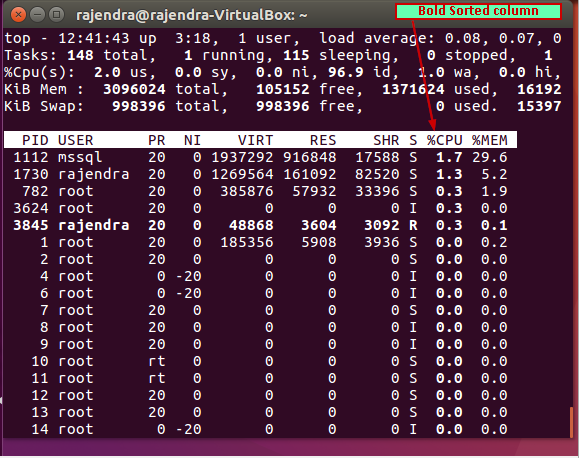
There might be cases where we forget on which filed we sorted out the results. Therefore, you can press ‘x’ and it will highlight the current sort column from the output. In below image, you can see ‘%CPU’ is showing up in bold characters. It means, our result is sorted out on this field. Similarly ‘y’ to highlight the row of running tasks.
在某些情况下,我们可能会忘记对结果进行排序的文件。 因此,您可以按“ x”,它将突出显示输出中的当前排序列。 在下图中,您可以看到'%CPU'以粗体显示。 这意味着,我们的结果将在此字段中进行排序。 同样,用“ y”突出显示正在运行的任务行。
将结果保存到文本文件中 (Save results into a text file)
If we want to export the ‘top’ command output, we can do it into the text file with below command.
如果要导出“ top”命令输出,可以使用以下命令将其输出到文本文件中。
top -n 1 -b > top-output.txt
top -n 1 -b> top-output.txt
查看文件内容 (Viewing file contents)
In Linux, you can view the file content using the ‘cat’ command as shown in below screenshot:
在Linux中,您可以使用'cat'命令查看文件内容,如以下屏幕截图所示:
结论 (Conclusion)
In this article, we explored the ‘top’ command, its usages and various formatting options. This will help you to troubleshoot performance issues in Linux environment.
在本文中,我们探讨了“ top”命令,其用法和各种格式设置选项。 这将帮助您解决Linux环境中的性能问题。
目录 (Table of contents)
| Helpful Linux commands for SQL Server DBAs – top |
| Helpful Linux commands for SQL Server DBAs – iotop and iostat |
| 适用于SQL Server DBA的有用的Linux命令–页首 |
| 适用于SQL Server DBA的有用的Linux命令– iotop和iostat |
翻译自: https://www.sqlshack.com/helpful-linux-commands-for-sql-server-dbas-top/


 被折叠的 条评论
为什么被折叠?
被折叠的 条评论
为什么被折叠?
 到【灌水乐园】发言


