


 本文介绍如何使用SQL查询从头开始创建包含所有员工和客户配对的报告,涵盖数据模型理解、SQL查询技巧及报告数据整合。
sql 查询手动创建的表
In the previous two articles, we’ve practiced SQL queries and went through a few more examples. Today we’ll use SQL queries and create a report from scratch. We’ll start from the simplest possible query and finish with the query returning the actual report data.
在前两篇文章中,我们练习了SQL查询 ,并介绍了更多示例 。 今天,我们将使用SQL查询并从头开始创建报告。 我们将从最简单的查询开始,最后以返回实际报告数据的查询结束。
数据模型和一些一般性想法 (Data Model & a few general thoughts)
As always, we’ll have to take a look at the data model we’re using. If you’re a data analyst, some of the expected tasks you can expect are – grab the data from the database, create a report, draw conclusions from the report data. Therefore, you can expect that you’ll have a data model at your disposal.
与往常一样,我们将不得不看看正在使用的数据模型。 如果您是数据分析师,则可以预期的一些预期任务是–从数据库中获取数据,创建报告,从报告数据中得出结论。 因此,您可以期望可以使用一个数据模型。
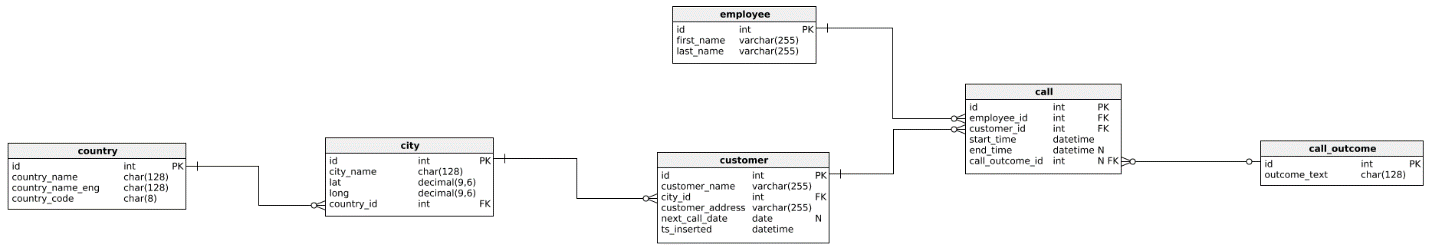
In such a data model, you should identify the tables that contain data needed in the report. Also, you’ll need to be sure how these tables are related. You should ask yourself questions like:
在这种数据模型中,您应该确定包含报表中所需数据的表。 另外,您需要确定这些表之间的关系。 您应该问自己一些问题,例如:
- Which tables are dictionaries and which ones are being populated with data (either by users/customers, either some automated process)? -> You’re interested in analyzing data from tables being populated with the data while dictionaries are here to display info on the screen (when the data is being inserted + used a category in reports) 哪些表是字典,哪些表中填充了数据(由用户/客户,或者由某些自动化过程组成)? ->您感兴趣的是分析字典中的数据,而此处的字典将在屏幕上显示信息(当插入数据+在报表中使用类别时)
- INNER JOIN (if you always have a related record) or LEFT JOIN (if you don’t always have a related record) when joining these two tables INNER JOIN(如果您始终有相关记录)或LEFT JOIN(如果您始终不具有相关记录)时,这一点很重要。
In this article, we’ll use data from only 3 tables: employee, customer, and call.
在本文中,我们将仅使用3个表中的数据:employee,customer和call。
The goal of this article is to create a report with all pairs of employees and customers and the number of calls each employee and customer had. We should also return a pair where there were no calls and have 0 as a value in the related column.
本文的目的是创建一个包含所有成对的员工和客户以及每个员工和客户所拥有的呼叫数量的报告。 我们还应该返回一对没有呼叫且在相关列中的值为0的货币对。
#1 SQL示例–检查数据 (#1 SQL Example – Check data)
We’ll start with the two simple SQL queries to check what is on our tables (employee & customer). These are two tables we’ll need to create all our reporting categories (we need all combinations of employees and customers).
我们将从两个简单SQL查询开始,以检查表中的内容(员工和客户)。 这是我们需要创建所有报告类别的两个表(我们需要员工和客户的所有组合)。
-- check tables data
SELECT * FROM employee;
SELECT * FROM customer;</p>
I guess there is no need to explain SQL queries or their results.
我猜没有必要解释SQL查询或其结果。
There are only 3 things worth mentioning here:
这里只有三件事值得一提:
- Since we need all pairs in the final report, we’ll need to have 8 report categories (2 employees * 4 customers = 8 different pairs) 由于我们需要最终报告中的所有对,因此我们需要有8个报告类别(2个员工* 4个客户= 8个不同对)
- st table * number of rows in the 2第一个表中的行数* nd table = total number of reporting categories) 第二个表中的行数=报告类别总数)
- Both tables used to create categories are not actual catalogs/dictionaries, but lists. Still, we don’t expect data changes in these tables as often as in other tables 用于创建类别的两个表都不是实际的目录/词典,而是列表。 不过,我们预计这些表中的数据更改不会像其他表中那样频繁
#2 SQL示例–创建报告类别(笛卡尔积) (#2 SQL Example – Create reporting categories (Cartesian product))
We now know what is in our tables, and are ready to create reporting categories. Since we need to combine all rows from one table with all rows from another table, we’ll create a Cartesian product of these two tables. We can do it simply, and we’ll show 2 common ways to do that.
现在,我们知道表中的内容,并准备创建报告类别。 由于我们需要将一个表中的所有行与另一表中的所有行组合在一起,因此我们将创建这两个表的笛卡尔积。 我们可以简单地做到这一点,并且我们将展示两种常用的方法。
-- creating reporting categories using the Cartesian product

-- 1. Cartesian product without joins
SELECT
  employee.id AS employee_id,
  employee.first_name,
  employee.last_name,
  customer.id AS customer_id,
  customer.customer_name
FROM employee, customer;

-- 2. Cartesian product using CROSS JOIN
SELECT
  employee.id AS employee_id,
  employee.first_name,
  employee.last_name,
  customer.id AS customer_id,
  customer.customer_name
FROM employee
CROSS JOIN customer;
Let’s take a look at the result. As expected, both SQL queries returned all combinations, in total, 8 of them.
让我们看一下结果。 与预期的一样,两个SQL查询都返回了所有组合,总共8个。
The first query did that without using JOIN, while in the 2nd query, we’ve used CROSS JOIN.
第一个查询在不使用JOIN的情况下做到了这一点,而在第二个查询中,我们使用了CROSS JOIN。
For the first query, the important thing to mention is that we wanted a Cartesian product. Therefore, we’ve just listed tables, and haven’t used any join condition in the WHERE part of the query. We did it here with a purpose. Still, in most cases, you want to relate tables using a join condition, and the Cartesian product is the result of an error (not using the condition). I use the Cartesian product only in situations similar to this one (when I need to create a report and report categories).
对于第一个查询,要提及的重要一点是我们需要笛卡尔积。 因此,我们只列出了表,并且在查询的WHERE部分中未使用任何连接条件。 我们这样做是有目的的。 尽管如此,在大多数情况下,您仍希望使用联接条件来关联表,而笛卡尔积是错误的结果(不使用条件)。 仅在与此类似的情况下(当我需要创建报告和报告类别时)才使用笛卡尔积。
The second query used the CROSS JOIN. This is very useful if you plan to add a few more tables to your query using any other JOIN (especially LEFT JOIN) because you can simply continue to add joins after this one.
第二个查询使用了CROSS JOIN。 如果您打算使用其他任何JOIN(尤其是LEFT JOIN)向查询中添加更多表,这将非常有用,因为您可以在此表之后继续添加联接。
#3 SQL示例–获取报告数据 (#3 SQL Example – Get report data)
The next step in creating a report is to grab the actual data we need. In our case, we want to count all contacts employees had with customers. We’ll simply use ids from both tables, group by them, and count the number of calls. You can read more about aggregate functions (including COUNT), here.
创建报告的下一步是获取我们所需的实际数据。 在我们的案例中,我们要计算员工与客户之间的所有联系。 我们将只使用两个表中的ID,将它们分组,然后计算调用次数。 您可以在此处阅读有关聚合函数(包括COUNT)的更多信息。
-- get report data
SELECT
  employee.id AS employee_id,
  customer.id AS customer_id,
  COUNT(call.id) AS calls
FROM employee
INNER JOIN call ON call.employee_id = employee.id
INNER JOIN customer ON call.customer_id = customer.id
GROUP BY
  employee.id,
  customer.id;
Our query returned all pairs of employee_id and customer_id that have at least 1 call. In our case, due to the data in our database, each employee and customer had at least 1 call, and therefore the final result has 8 rows. Still, this happens only to the nature of data in our database and other scenarios; you could easily have, e.g., only 5 pairs returned as the result of this query.
我们的查询返回了至少有1个调用的所有对employee_id和customer_id。 在我们的例子中,由于数据库中的数据,每个员工和客户至少有1个呼叫,因此最终结果有8行。 尽管如此,这仅发生在我们数据库和其他场景中的数据性质上; 您可以轻松地获得此查询的结果,例如,仅返回5对。
#4 SQL示例–合并类别和报告数据 (#4 SQL Example – Combine categories & report data)
The last thing we need to do in order to create a report is to combine reporting categories with the report data. We’ll simply use SQL queries created in “#2 SQL Example – Create reporting categories (Cartesian product)” and “#3 SQL Example – Get report data”.
为了创建报告,我们要做的最后一件事是将报告类别与报告数据结合起来。 我们将仅使用在“#2 SQL示例–创建报告类别(笛卡尔产品)”和“#3 SQL示例–获取报告数据”中创建SQL查询。
We’ll use both these SQL queries as a subquery for the main query. Notice that these subqueries act as “standard” tables, so you can look at them as on black boxes. And what is in these tables? Well, they “contain” the results queries created in the previous 2 parts returned.
我们将使用这两个SQL查询作为主查询的子查询。 请注意,这些子查询充当“标准”表,因此您可以将其视为黑盒。 这些表中有什么? 好吧,它们“包含”了在返回的前2个部分中创建的结果查询。
SELECT
  report_categories.employee_id,
  report_categories.first_name,
  report_categories.last_name,
  report_categories.customer_id,
  report_categories.customer_name,
  report_data.calls
FROM
(
  -- report categories
  SELECT
    employee.id AS employee_id,
    employee.first_name,
    employee.last_name,
    customer.id AS customer_id,
    customer.customer_name
  FROM employee
  CROSS JOIN customer
) report_categories

LEFT JOIN

(
  -- report data
  SELECT
    employee.id AS employee_id,
    customer.id AS customer_id,
    COUNT(call.id) AS calls
  FROM employee
  INNER JOIN call ON call.employee_id = employee.id
  INNER JOIN customer ON call.customer_id = customer.id
  GROUP BY
    employee.id,
    customer.id
) report_data ON report_categories.employee_id = report_data.employee_id AND report_categories.customer_id = report_data.customer_id;
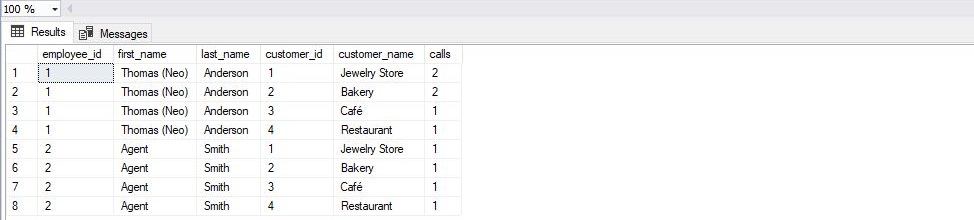
Let’s spend some time and comment on the result returned:
让我们花一些时间对返回的结果进行评论:
- We’ve used previously created 2 SQL queries as subqueries. I’ve just copy-pasted them, put them inside “(“ and “)” and gave them alias names – report_categories and report_data. Now, I’ll treat them like any other table with column names as defined within these SQL queries 我们已使用先前创建的2个SQL查询作为子查询。 我只是复制粘贴了它们,将它们放在“(”和“)”中,并给它们起了别名– report_categories和report_data。 现在,我将它们与其他表一样对待,这些表具有这些SQL查询中定义的列名
- LEFT JOIN. This is very important because we need all categories returned in the final result. In case there is no related report data for a category, we’ll still have our category in the final result, and we’ll see that this pair of the employee and customer had no calls LEFT JOIN连接 。 这非常重要,因为我们需要最终结果中返回的所有类别。 如果某个类别没有相关的报告数据,我们仍将类别保留在最终结果中,并且我们将看到这对员工和客户没有通话
- When joining, I’ve joined by 2 criteria – employee_id and customer_id. This is needed because this pair is a unique value on both sides (remember when we’re joining tables, we’re using primary and foreign keys)
- 加入时,我有2个条件加入-employee_id和customer_id。 这是必需的,因为这对在两端都是唯一的值(请记住,在连接表时,我们使用的是主 键和外键 )
Please show the “Save SQL Query results to Excel” part here.
请在此处显示“将SQL查询结果保存到Excel”部分。
Note: When you need to create a report, always have in mind, what information business users need to make a decision, so be sure you’ve checked report requirements with them first.
注意 :当您需要创建报告时,请始终牢记业务用户需要决定哪些信息,因此请确保您首先检查了他们的报告要求。
In our example, we wanted to have all possible categories, regardless of the fact if they have related value or not. That is usually the case when you want to see that there was no performance in a certain category. In case there is no category in the report, a business user might not even be aware there is such a category and couldn’t make necessary business decisions.
在我们的示例中,我们希望拥有所有可能的类别,而不管它们是否具有相关值的事实。 当您想查看某个类别中没有任何性能时,通常就是这种情况。 如果报告中没有类别,则业务用户甚至可能不知道存在此类,并且无法做出必要的业务决策。
结论 (Conclusion)
To sum up, we’ve created a report from scratch. While we started with a very simple query, the final query displays more relevant business information. I suggest that you apply this procedure each time you need to create a report, at least when you’re creating a complex one.
总而言之,我们从头开始创建了一个报告。 虽然我们从一个非常简单的查询开始,但最终查询显示了更多相关的业务信息。 我建议您每次需要创建报告时都应应用此过程,至少在创建复杂报告时。
In the upcoming articles, we’ll go a few more steps further and show how to work with dates & time functions, how to combine SQL query results with Excel, and also how to create pivot tables directly in SQL Server.
在接下来的文章中,我们将进一步走几步,并展示如何使用日期和时间函数,如何将SQL查询结果与Excel结合以及如何直接在SQL Server中创建数据透视表。
目录 (Table of contents)
翻译自: https://www.sqlshack.com/learn-sql-create-a-report-manually-using-sql-queries/
sql 查询手动创建的表


 930
930

 被折叠的 条评论
为什么被折叠?
被折叠的 条评论
为什么被折叠?
 到【灌水乐园】发言


