


摘要 (Summary)
Database metrics can be collected, maintained, and used to help predict when processes go awry so problems can be resolved before they become severe. Understanding when an application or process misbehaves is not always easy. We are often left waiting until a server, application, or service breaks or enters an undesirable state before we know something is wrong. At that point, we are forced to rush and resolve a production problem quickly, before its impact becomes severe.
可以收集,维护数据库指标,并用于预测进程何时出现问题,从而可以在问题变得严重之前解决它们。 了解应用程序或流程何时发生异常行为并不总是那么容易。 我们通常会等到服务器,应用程序或服务中断或进入不良状态,然后再知道有问题。 那时,我们被迫仓促解决问题,直到其影响变得严重为止。
The better we understand our data, the more we can predict data-driven application problems before they occur. By examining database metrics such as row counts, disk IO, and memory usage, we can determine if resource consumption has become unusually high. When this occurs, we can use the data to quickly pinpoint its cause.
我们对数据了解得越多,就越能在数据驱动的应用程序问题发生之前对其进行预测。 通过检查数据库指标(例如行数,磁盘IO和内存使用情况),我们可以确定资源消耗是否异常高。 发生这种情况时,我们可以使用数据快速查明其原因。
我们能遇到什么问题? (What problems can we catch?)
Once we analyze the metrics, we can discover many common problems as soon as they manifest and before they cause major application problems. Essentially, our ultimate goal is to catch a bug before it translates into downtime or the need for a significant response.
一旦分析了指标,我们就可以在许多常见问题出现后立即发现它们,而不会引起重大应用程序问题。 本质上,我们的最终目标是在错误转化为停机时间或需要做出重大响应之前捕获错误。
数据存档/清理遗漏 (Data archival/cleanup omissions)
When we build new tables, we should ask, “How will we maintain this data?” Often, we build tables that should only retain days, weeks, or maybe months of data. This is common for monitoring, tracking, auditing, and logging.
当我们建立新表时,我们应该问:“我们将如何维护这些数据?” 通常,我们构建的表只应保留几天,几周甚至几个月的数据。 这对于监视,跟踪,审计和日志记录很常见。
If we build a fast-growing table that needs a data retention policy and forget to include it, the table will grow indefinitely. Eventually, it is likely that its size will become a performance hazard. If we catch a specific table growing quickly beyond what we expect, then we can act before we hit performance or resource limitations.
如果我们构建一个需要数据保留策略的快速增长的表而忘记了将其包括在内,则该表将无限期地增长。 最终,它的大小可能会成为性能危害。 如果我们发现某个特定表的增长超出了我们的预期,那么我们可以在遇到性能或资源限制之前采取行动。
数据错误/过多 (Bad/excessive data)
A software or script bug can result in more data being generated than expected. Similar bugs can also result in bad data that does not get handled correctly via the application’s business logic.
软件或脚本错误可能导致生成的数据超出预期。 类似的错误也可能导致不良数据,而该不良数据将无法通过应用程序的业务逻辑正确处理。
Tracking row counts can quickly catch these issues as we search for tables that are growing faster than anticipated.
当我们搜索增长速度超出预期的表时,跟踪行数可以Swift发现这些问题。
数据增长不一致 (Inconsistent data growth)
If a database or application is broken into subsets, then we could compare data growth and utilization for each one to see if there are anomalies or outliers.
如果将数据库或应用程序细分为子集,则可以比较每个数据库或应用程序的数据增长和利用率,以查看是否存在异常或异常。
By measuring detailed database metrics for each subset of customers, users, or entities, we can track problems that may be invisible in aggregate but become obvious when we break the problem into smaller pieces.
通过为客户,用户或实体的每个子集测量详细的数据库指标,我们可以跟踪总体上不可见但在将问题分解为较小部分时变得显而易见的问题。
延迟和性能问题 (Latency & performance problems)
High waits, blocking, locking, or deadlocking can all be symptoms of poorly written queries. Perhaps an application ran efficiently in a small development environment but is slowing down as the dataset gets larger and more complex.
等待时间长,阻塞,锁定或死锁都可能是写得不好的查询的症状。 也许应用程序可以在小型开发环境中高效运行,但是随着数据集变得越来越大和越来越复杂,它的运行速度正在放缓。
Nearly any metrics we capture can help us find these issues. The problem may be as simple as a missing index or poorly-written query. Our goal is to find those mistakes before they manifest as bug reports and application complaints/outages.
我们捕获的几乎所有指标都可以帮助我们发现这些问题。 问题可能很简单,如缺少索引或编写不正确的查询。 我们的目标是在发现错误之前将其发现为错误报告和应用程序投诉/中断。
多得多 (Much more)
Every application is different and the data we collect, store, maintain, and report on can vary widely. The server and database metrics that are most meaningful to you may be similar or very different from what we have discussed here. Generally, the space and resources needed to collect and monitor metrics are low-overhead, so when in doubt, monitor more! Unneeded database metrics can be easily removed later, whereas the useful ones will quickly become valuable and worth the resources used to collect them.
每个应用程序都是不同的,我们收集,存储,维护和报告的数据可能相差很大。 对您最有意义的服务器和数据库指标可能与我们在此讨论的内容相似或非常不同。 通常,收集和监视指标所需的空间和资源的开销很低,因此如果有疑问,请监视更多! 不需要的数据库指标可以在以后轻松删除,而有用的数据库指标将很快变得很有价值,并且值得用来收集它们的资源。
趋势数据 (Trending data)
To truly be able to use database metrics for predictive analysis, we need to collect, retain, and trend data over time. It is not enough to store a day’s worth of data or to monitor/alert when we are in trouble, but to maintain historical data for years. This volume of data allows us to capacity plan, detect anomalies, and otherwise locate bad trends before they become destructive.
为了真正能够使用数据库指标进行预测分析,我们需要随着时间的推移收集,保留和趋势化数据。 当我们遇到麻烦时,仅存储一天的数据或监视/警报是不够的,而要保持多年的历史数据是不够的。 大量的数据使我们能够进行容量规划,检测异常,并在不良趋势变得具有破坏性之前定位不良趋势。
These trends are especially important when we introduce change via software releases, maintenance, or hardware changes. The most likely time for software to break will be when we introduce change, so this provides an opportunity for us to identify problems based on abnormal data use.
当我们通过软件版本,维护或硬件更改引入更改时,这些趋势尤其重要。 软件崩溃的最可能时间是当我们引入更改时,因此这为我们提供了机会,可以根据异常数据使用来识别问题。
行数趋势 (Row count trending)
The following script will create a table to store this data and create a simple stored procedure that collects row count data from all user databases and places it into the table:
以下脚本将创建一个表来存储此数据,并创建一个简单的存储过程,该过程从所有用户数据库中收集行计数数据并将其放入表中:
IF NOT EXISTS (SELECT * FROM sys.tables WHERE tables.name = 'row_count_historical')
BEGIN
  CREATE TABLE dbo.row_count_historical
  ( row_count_historical_id INT NOT NULL IDENTITY(1,1) CONSTRAINT PK_row_count_historical PRIMARY KEY CLUSTERED,
    sample_date_utc DATE NOT NULL,
    databasename VARCHAR(128) NOT NULL,
    schemaname VARCHAR(128) NOT NULL,
    table_name VARCHAR(128) NOT NULL,
    row_count BIGINT NOT NULL)
  WITH (DATA_COMPRESSION = PAGE);
END
GO

IF EXISTS (SELECT * FROM sys.procedures WHERE procedures.name = 'collect_row_count_metrics')
BEGIN
  DROP PROCEDURE dbo.collect_row_count_metrics;
END
GO

CREATE PROCEDURE dbo.collect_row_count_metrics
AS
BEGIN
  SET NOCOUNT ON;

  DECLARE @current_date_utc DATE = CAST(SYSUTCDATETIME() AS DATE);

  DELETE row_count_historical
  FROM dbo.row_count_historical
  WHERE row_count_historical.sample_date_utc = @current_date_utc;

  DECLARE @sql_command NVARCHAR(MAX) = 'DECLARE @current_date_utc_local DATE = CAST(SYSUTCDATETIME() AS DATE);';
  SELECT
    @sql_command = @sql_command + '
      INSERT INTO dbo.row_count_historical
        (sample_date_utc, databasename, schemaname, table_name, row_count)
      SELECT
        @current_date_utc_local AS sample_date_utc,
        ''' + databases.name + ''' AS databasename,
        schemas.name AS schemaname,
        objects.name AS table_name,
        dm_db_partition_stats.row_count
      FROM sys.dm_db_partition_stats
      INNER JOIN sys.objects
      ON objects.object_id = dm_db_partition_stats.object_id
      INNER JOIN sys.schemas
      ON schemas.schema_id = objects.schema_id
      WHERE objects.is_ms_shipped = 0
      AND objects.type_desc = ''USER_TABLE''
      AND dm_db_partition_stats.index_id IN (0,1);'
  FROM sys.databases
  WHERE databases.name NOT IN ('TempDB', 'model', 'msdb', 'master');

  EXEC sp_executesql @sql_command;
END
GO

EXEC dbo.collect_row_count_metrics;
SELECT * FROM dbo.row_count_historical;
GO
Note that I did not include indexed views. If this is a useful addition, feel free to add some code to check the object type and/or join to sys.tables and sys.views for more information. If storage savings is important, you can normalize the database, schema, and table name into TINYINT, SMALLINT, or INT columns (depending on schema volume). The table has page compression applied, since a reporting table like this is the perfect candidate for compression as it is write-once, read-often data. System databases and tables are excluded, but feel free to adjust this filter if you have an interest in any of them. Lastly, I re-declared the UTC date within the dynamic SQL to reduce the amount of string splicing I had to do. This is a style consideration, but I personally prefer to splice less and declare variables within dynamic SQL when possible.
请注意,我没有包括索引视图。 如果这是有用的补充,请随意添加一些代码以检查对象类型和/或加入sys.tables和sys.views以获取更多信息。 如果节省存储空间很重要,则可以将数据库,架构和表名称标准化为TINYINT,SMALLINT或INT列(取决于架构卷)。 该表已应用页面压缩,因为这样的报告表是一次写入,经常读取的数据,因此是压缩的理想选择。 系统数据库和表被排除在外,但是如果您对其中的任何一个感兴趣,请随时调整此过滤器。 最后,我在动态SQL中重新声明了UTC日期,以减少必须进行的字符串拼接的数量。 这是一种样式考虑因素,但是我个人更愿意减少拼接,并在可能的情况下在动态SQL中声明变量。
When executed, the table and stored procedure are created, and the proc is executed. The results of the SELECT from the table look like this:
执行时,将创建表和存储过程,并执行proc。 表中SELECT的结果如下所示:
The results show a row per object per day across all databases. If run daily, we can build up a historical set of data that allows us to trend growth and application behavior over time. We can look at row counts over the past week for all tables and compare today’s numbers to yesterday’s, 3 days ago, a week ago, a month ago, etc. Over time we can refine a model that describes normal vs. abnormal data growth effectively.
结果显示所有数据库中每个对象每天都有一行。 如果每天运行,我们可以建立一个历史数据集,使我们能够随着时间的推移趋势和应用程序行为的趋势。 我们可以查看过去一周中所有表的行数,并将今天的数字与昨天,三天前,一周前,一个月前的数字进行比较。随着时间的流逝,我们可以细化模型来有效描述正常数据和异常数据的增长。
For example, in this data we determine that sales orders grew at a rate of about 10,000 orders a day. Anything under 1,000 is exceptionally abnormal/bad and anything over 10,000 is also suspect. This is useful, but very specific. A more generic approach would be to say that any table that grows by more than 10% for three days straight should be investigated. Assumptions like this are likely to trigger false positives on occasion but require far less manual intervention up front. This approach would lend itself towards creating exceptions after-the-fact to eliminate them and improve alerting quality.
例如,在此数据中,我们确定销售订单每天以大约10,000个订单的速度增长。 低于1,000的异常异常/坏,超过10,000的任何怀疑。 这很有用,但非常具体。 一种更通用的方法是说,应该对任何连续三天增长超过10%的表进行调查。 这样的假设有时可能会触发误报,但预先需要的人工干预要少得多。 这种方法将有助于事后创建异常,以消除异常并提高警报质量。
One additional note: If you are pulling data from an environment where there are many tables in many databases, the storage size of this can get unwieldy! For example, if you had 1,000 databases with 1,000 tables each, then you would get one million rows a day. Here are some suggestions to tame large row count data volume:
还有一点要注意:如果要从许多数据库中有许多表的环境中提取数据,则其存储大小可能会变得笨拙! 例如,如果您有1,000个数据库,每个数据库有1000个表,那么每天将获得一百万行。 以下是一些建议以驯服大行数数据量:
- Remove all tables with less than N rows of data. This may be 5 or 10 or 100, but this helps eliminate lookup tables or those with an inconsequential amount of data. The downside to this decision is that we lose insight into these tables 删除所有少于N行数据的表。 可以是5或10或100,但这有助于消除查找表或数据量不大的表。 这个决定的缺点是我们对这些表格失去了见识
- is_current BIT that allows you to quickly pull the current values across your environment is_current BIT,它使您可以在环境中快速提取当前值
- Only store tables of interest. If you know that there is only a small set of tables that matter, then filter to include only them. The maintenance here is to check periodically to either add new tables or revisit old ones if their application usage patterns change 仅存储感兴趣的表。 如果您知道只有少数几张表很重要,请过滤以仅包括它们。 此处的维护工作是定期检查以添加新表或在其应用程序使用方式发生更改时重新访问旧表
I / O统计 (I/O stats)
We can approach I/O file stats very similarly to how we handled row counts above: Regularly collect data, store it in a reporting table, and then run analytics against it as needed. Since these database metrics are reset when SQL Server services restart, we need to collect a bit more often. We’ll also want to collect often enough to be able to correlate changes to ongoing application activity. Hourly is typically an acceptable collection frequency, but your environment may lend itself to the more frequent or less frequent collection.
我们可以非常类似于上面的行计数方法来处理I / O文件统计信息:定期收集数据,将其存储在报告表中,然后根据需要对其进行分析。 由于在SQL Server服务重新启动时会重置这些数据库指标,因此我们需要更频繁地进行收集。 我们还希望经常收集足够的信息,以便能够将更改与正在进行的应用程序活动相关联。 每小时通常是一个可接受的收集频率,但是您的环境可能适合于更频繁或更不频繁的收集。
Since pulling IO stats does not require iterating through databases, we can collect data quickly and easily, without the need for dynamic SQL:
由于获取IO统计信息不需要遍历数据库,因此我们可以快速轻松地收集数据,而无需动态SQL:
IF NOT EXISTS (SELECT * FROM sys.tables WHERE tables.name = 'io_virtual_file_stats_historical')
BEGIN
  CREATE TABLE dbo.io_virtual_file_stats_historical
  ( io_virtual_file_stats_historical_id INT NOT NULL IDENTITY(1,1) CONSTRAINT PK_io_virtual_file_stats_historical PRIMARY KEY CLUSTERED,
    sample_time_utc DATETIME2(0) NOT NULL,
    databasename VARCHAR(128) NOT NULL,
    database_filename NVARCHAR(128) NOT NULL,
    file_type VARCHAR(60) NOT NULL,
    physical_name NVARCHAR(260) NOT NULL,
    number_of_reads INT NOT NULL,
    number_of_bytes_read BIGINT NOT NULL,
    number_of_writes INT NOT NULL,
    number_of_bytes_written BIGINT NOT NULL)
  WITH (DATA_COMPRESSION = PAGE);
END
GO

IF EXISTS (SELECT * FROM sys.procedures WHERE procedures.name = 'collect_io_virtual_file_stats_metrics')
BEGIN
  DROP PROCEDURE dbo.collect_io_virtual_file_stats_metrics;
END
GO

CREATE PROCEDURE dbo.collect_io_virtual_file_stats_metrics
AS
BEGIN
  SET NOCOUNT ON;

  DECLARE @current_time_utc DATE = CAST(SYSUTCDATETIME() AS DATETIME2(0));

  INSERT INTO dbo.io_virtual_file_stats_historical
    (sample_time_utc, databasename, database_filename, file_type, physical_name, number_of_reads, number_of_bytes_read, number_of_writes, number_of_bytes_written)
  SELECT
    @current_time_utc AS sample_time_utc,
    databases.name AS DatabaseName,
    master_files.name AS DatabaseFileName,
    master_files.type_desc AS FileType,
    master_files.physical_name,
    dm_io_virtual_file_stats.num_of_reads,
    dm_io_virtual_file_stats.num_of_bytes_read,
    dm_io_virtual_file_stats.num_of_writes,
    dm_io_virtual_file_stats.num_of_bytes_written
  FROM sys.master_files
  INNER JOIN sys.dm_io_virtual_file_stats(NULL, NULL)
  ON master_files.database_id = dm_io_virtual_file_stats.database_id
  INNER JOIN sys.databases
  ON databases.database_id = master_files.database_id
  AND master_files.file_id = dm_io_virtual_file_stats.file_id;
END
GO

EXEC dbo.collect_io_virtual_file_stats_metrics;
SELECT * FROM dbo.io_virtual_file_stats_historical;
GO
This script creates a table to store data and creates a stored proc that deposits IO stats numbers into the table. The results are a point-in-time for I/O when executed:
该脚本创建一个表来存储数据,并创建一个存储的proc,该proc将IO统计数字存储到该表中。 执行时,结果是I / O的时间点:
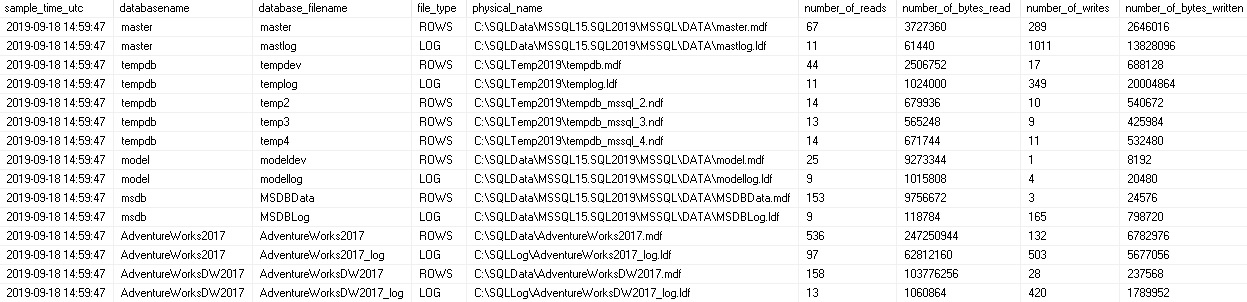
Note that if the SQL Server restarts, the numbers in this table will also reset to zero. When reporting off of this data, you’ll likely want to join back to the preceding data sample to check and see if the new values are smaller than the previous values. If so, then we know that a restart occurred, and the dynamic management view was zeroed out.
请注意,如果SQL Server重新启动,此表中的数字也将重置为零。 在报告此数据时,您可能希望重新加入之前的数据样本以检查并查看新值是否小于先前值。 如果是这样,那么我们知道发生了重新启动,并且动态管理视图已清零。
With this data in hand, we can quantify the volume of data written and read to each database file during specific time periods, as well as to measure throughput over time. This allows us to better plan storage needs, as well as identify times when I/O is heavy, light, or anomalously high. If the amount of I/O currently experienced by the sum total of data files on a disk is approaching or exceeding its capacity, then we can expect performance problems related to that bottleneck.
有了这些数据,我们可以量化在特定时间段内写入和读取到每个数据库文件的数据量,以及测量随时间推移的吞吐量。 这使我们可以更好地计划存储需求,并确定I / O太重,太轻或异常高的时间。 如果当前磁盘上的数据文件总数所经历的I / O数量接近或超过其容量,那么我们可以预见与该瓶颈相关的性能问题。
Unusually high I/O can be correlated to other events and help us to pinpoint the general location of an application issue. Since I/O can occur without inserting or deleting rows, this can help fill in the blanks for update and select operations.
异常高的I / O可能与其他事件相关联,并帮助我们查明应用程序问题的一般位置。 由于可以在不插入或删除行的情况下进行I / O操作,因此可以帮助填充空白以进行更新和选择操作。
扩展方法 (Extending the methodology)
The stored procedures created above display a distinct pattern:
上面创建的存储过程显示了不同的模式:
- Create a permanent table to store trending data 创建一个永久表来存储趋势数据
- Create a stored procedure that pulls a point-in-time snapshot of a specific metric 创建一个存储过程来提取特定指标的时间点快照
- Retain data points over time for trending 随时间保留数据点以进行趋势分析
- Alert/monitor on suboptimal conditions that can predict application or capacity problems 在可预测应用程序或容量问题的次佳条件下发出警报/监视
Data like this is extremely useful! It provides value that grows over time as our data grows. We have great flexibility in how often we take samples, the details of what columns we retain, and how we consume this data.
这样的数据非常有用! 它提供随着时间增长而增长的价值。 在采样频率,保留哪些列的详细信息以及如何使用此数据方面,我们具有极大的灵活性。
The process shown here for row counts and I/O stats can easily be extended to backups, waits, deadlocks, and more. Pick a metric that is measurable, sample it, store it, use it.
此处显示的行计数和I / O状态的过程可以轻松扩展到备份,等待,死锁等。 选择一个可衡量的指标,对其进行抽样,存储,使用。
While data can be subject to a retention period, I have always been hesitant to remove it unless it truly is old, and we are certain to never use it again. It is challenging to determine when database metrics are no longer relevant and most measures that we have discussed are compact enough that storing years of data will not be disruptive. Wait stats, deadlocks, and other long-text metrics can get big, but these are specific details we can compress, truncate, or remove over time to ensure that space usage doesn’t get out of hand (if needed). In general, metrics should be retained for as long as we would perform any other reporting on related data points, such as application bugs, usage, and history.
尽管数据可能会有保留期,但我一直不愿删除它,除非它确实是旧的,而且我们确信永远不会再使用它。 确定何时不再需要数据库度量标准以及我们已经讨论的大多数度量标准都足够紧凑以至于不会存储多年的数据就具有挑战性。 等待状态,死锁和其他长文本指标可能会变大,但是这些是我们可以随时间压缩,截断或删除的特定细节,以确保空间使用不会失控(如果需要)。 通常,只要我们对相关数据点执行任何其他报告(例如应用程序错误,使用情况和历史记录),就应保留指标。
合并数据库指标 (Combining database metrics)
We can correlate any of these data points to other metrics. Does a spike in writes correlate to a significant increase in rows in a given table? Do waits spike during a period of time when reads are especially high? By combining metrics, we can paint a clearer picture of database performance and more quickly isolate a problem.
我们可以将任何这些数据点与其他指标相关联。 写入高峰与给定表中行的显着增加是否相关? 读取量特别高时,等待时间是否会激增? 通过组合指标,我们可以更清晰地描绘数据库性能,并更快地隔离问题。
Consider collecting multiple metrics and using them in tandem to find problems early. Once an application issue is found, use these and other database metrics to diagnose the problem and be able to offer up the best possible solution from the database perspective.
考虑收集多个指标,并串联使用它们以尽早发现问题。 一旦发现应用程序问题,请使用这些和其他数据库指标来诊断问题,并能够从数据库角度提供最佳解决方案。
结论 (Conclusion)
Database metrics may seem to most people to be academic in nature, providing the ability for us to capacity plan or budget for future hardware or cloud resources, but in reality, we can use this data to locate, diagnose, and solve application problems. This is exceptionally valuable and can prevent downtime, bug reports, and latency that could be disruptive to your organization. Whenever given the option, it’s far better to solve a problem on your terms than to be rushed and reactive when something breaks in the future.
在大多数人看来,数据库指标本质上是学术性的,为我们提供了为将来的硬件或云资源进行容量计划或预算的能力,但实际上,我们可以使用此数据来定位,诊断和解决应用程序问题。 这是非常有价值的,可以防止可能对组织造成破坏的停机时间,错误报告和延迟。 只要有选择,最好以您的意愿解决问题,而不是在将来出现问题时急于采取应对措施。
How do you use database metrics like these? Do you have any creative ways to turn database metadata and performance metrics into real-world solutions?
您如何使用这些数据库指标? 您是否有任何创造性的方法将数据库元数据和性能指标转换为实际解决方案?
翻译自: https://www.sqlshack.com/using-database-metrics-to-predict-application-problems/


 465
465

 被折叠的 条评论
为什么被折叠?
被折叠的 条评论
为什么被折叠?
 到【灌水乐园】发言


