


 本文介绍了如何在Power BI Desktop中利用烛台图进行库存数据分析。烛台图是技术分析师用于理解股票趋势的有效工具。文章详细阐述了如何导入数据,创建烛台图,以及自定义图表的颜色、趋势线和视觉效果,帮助数据分析师和交易者更好地分析股票价格动态。
Candlestick chart for stock data analysis in Power BI Desktop
用于Power BI Desktop中的库存数据分析的烛台图
Power BI Desktop contains a wide range of custom visualizations which helps to represent and analysis of the data with extensive formatting options. You can effectively showcase your data and save time as well by creating complex data chart with simple configuration options.
Power BI Desktop包含各种自定义可视化内容,这些可视化内容有助于使用丰富的格式选项来表示和分析数据。 通过使用简单的配置选项创建复杂的数据图表,您可以有效地展示数据并节省时间。
In the series of charts in PowerBI, we have explored below so far.
在PowerBI中的一系列图表中,到目前为止,我们已经进行了以下探索。
- Mekko Charts Mekko图表
- Hexbin Scatterplot 六边形散点图
- Word Cloud 词云
- Pulse Charts 脉搏图
- Interactive chord diagrams 互动和弦图
In this article, we will explore a Candlestick chart. Let us take an overview of this first.
在本文中,我们将探讨烛台图。 让我们首先对此进行概述。
烛台图概述 (Overview of Candlestick chart)
Candlestick charts are used to show price movement for the securities in the stock market. These financial charts are commonly used by the technical analyst to analyze the trends of a particular security and do the trend analysis.
烛台图用于显示股市中证券的价格走势。 这些财务图表通常由技术分析师用来分析特定证券的趋势并进行趋势分析。
In this chart, we represent each day data for a stock with the candlestick. It contains information about open, high, low and closing price about a stock.
在此图表中,我们用烛台代表股票的每日数据。 它包含有关股票的开盘价,最高价,最低价和收盘价的信息。
There are two kinds of candlestick available:
烛台有两种:
- Bearish Candlestick: If the closing price is less than the opening price for the period then it shows Bearish Candlestick 空头烛台 :如果收盘价低于该时期的开盘价,则显示空头烛台
- Bullish Candlestick: If the closing price is higher than the opening price for the period then it shows Bullish Candlestick 看涨烛台 :如果该期间的收盘价高于开盘价,则显示看涨烛台
In Candlestick chart, both the bearish and bullish candlesticks are represented by the different color so that easily identify the stock pattern for the period. The candlestick body shows the price range in between the open and close price for the period.
在烛台图表中,看跌烛台和看涨烛台都用不同的颜色表示,以便轻松识别该期间的库存模式。 烛台主体显示该期间开盘价与收盘价之间的价格范围。
Let us import sample data into Power BI Desktop to create the Candlestick charts.
让我们将样本数据导入Power BI Desktop以创建Candlestick图表。
在Power BI Desktop中导入数据 (Import data in Power BI Desktop )
In the previous articles, we imported data into Power BI Desktop using the flat file (.CSV or .txt) or from the excel sheet (.xls or .xlsx).
在先前的文章中,我们使用平面文件(.CSV或.txt)或从excel工作表(.xls或.xlsx)将数据导入Power BI Desktop。
In this article, we will import the data from the ‘Web’ data source. In web data source, we will import data directly from the web page.
在本文中,我们将从“ Web”导入数据 数据源。 在网络数据源中,我们将直接从网页中导入数据。
Click on the ‘Web’ from the Get data as shown here.
单击获取数据中的“ Web”,如下所示。
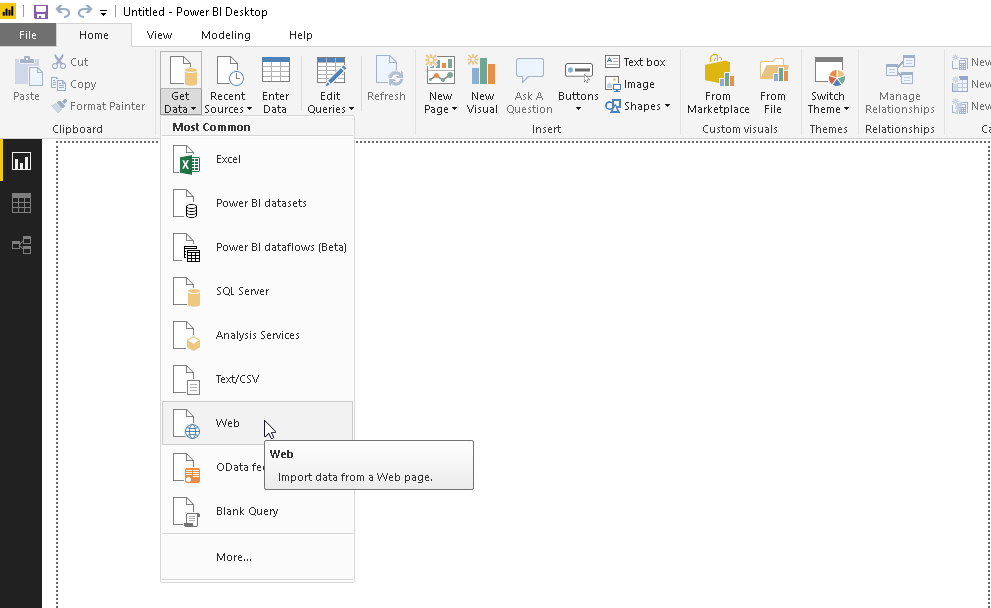
In this example, we will import the data from the NASDAQ website. Paste the URL from which you want to import the data into Power BI dataset.
在此示例中,我们将从纳斯达克网站导入数据。 将要从中导入数据的URL粘贴到Power BI数据集中。
Click OK and it launches Navigator where we can see the table view of the data.
单击确定,它将启动导航器,在该导航器中我们可以看到数据的表视图。
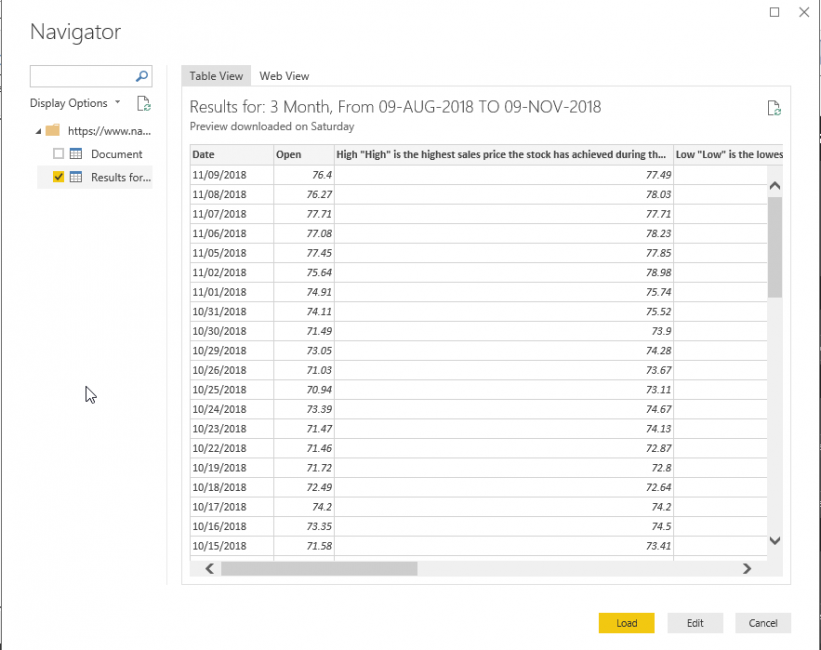
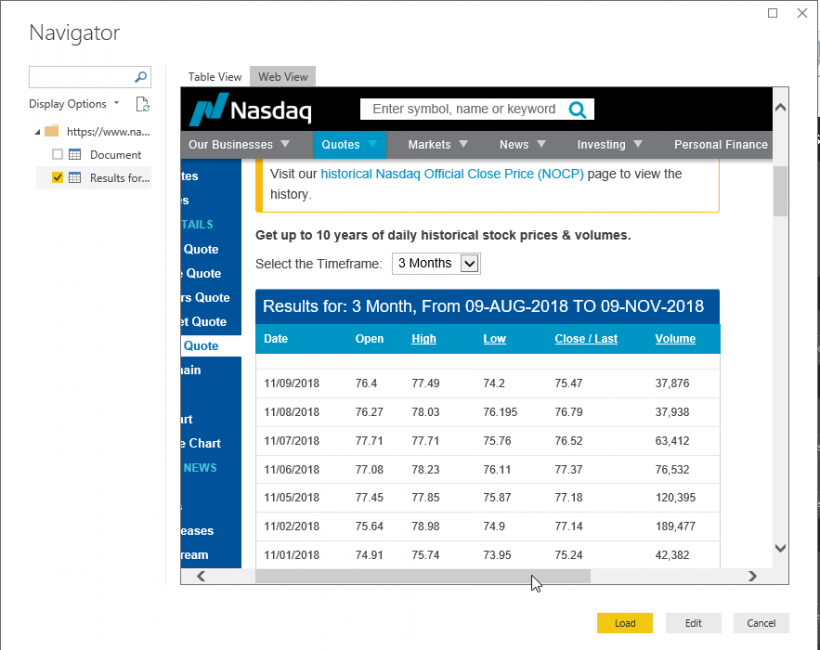
We can get the web view of the URL as well from the ‘web view’ link.
我们也可以从“网络视图”链接中获取URL的网络视图。
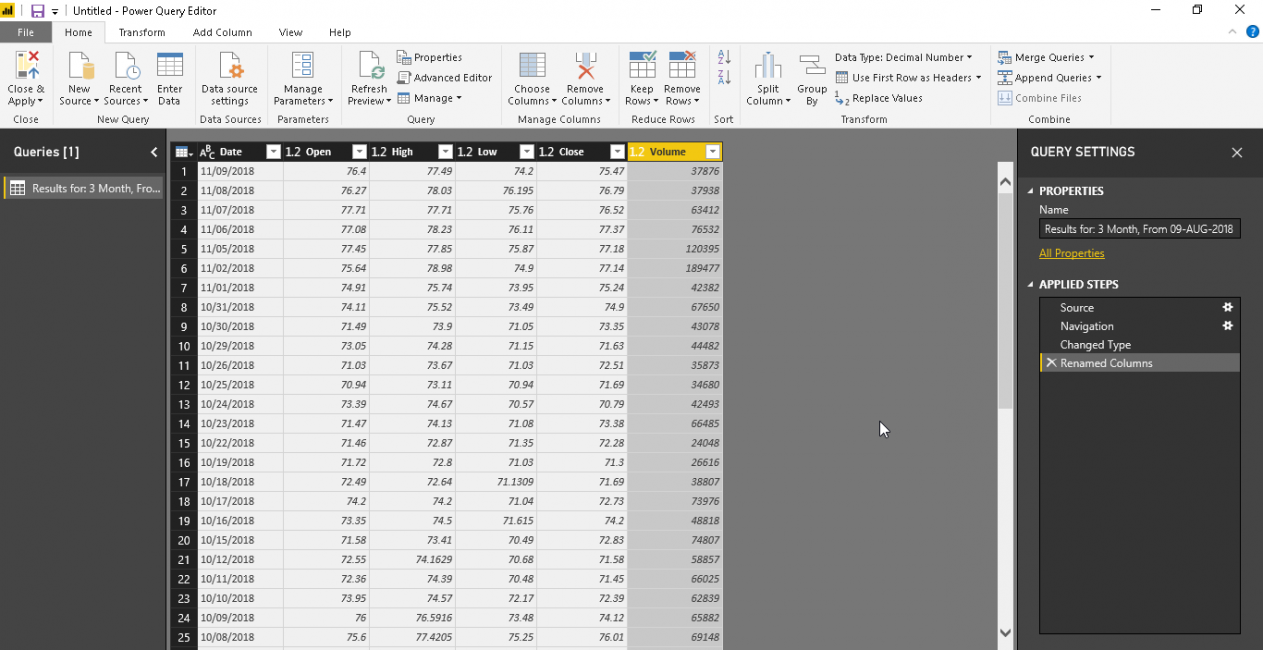
Click on ‘Edit’ and modify the column names. To modify column name, double-click on the particular column name and edit it.
单击“编辑”并修改列名称。 要修改列名,请双击特定的列名并进行编辑。
 最低0.47元/天 解锁文章


 被折叠的 条评论
为什么被折叠?
被折叠的 条评论
为什么被折叠?
 到【灌水乐园】发言


