


sql查询初学者指南
When a DBA is working with the SQL Server, he/she might sometimes say that the execution plan is like a black hole. As a matter of fact, though, you have to look at execution plans as weather forecasts.
当DBA使用SQL Server时,他/她有时可能会说执行计划就像一个黑洞。 但实际上,您必须将执行计划视为天气预报。
In this article, I will be discussing various aspects of executions plans, types and common options.
在本文中,我将讨论执行计划,类型和通用选项的各个方面。
For more information about Query optimization, see the SQL Query Optimization — How to Determine When and If It’s Needed article
有关查询优化的更多信息,请参见“ SQL查询优化-如何确定何时以及是否需要”一文。
查询优化 (Query optimization)
The fundamentals of query optimization are based on the fact that SQL Server has always been a cost-based optimizer.
查询优化的基础基于以下事实:SQL Server一直是基于成本的优化器。
Cost-based optimization involves generating multiple execution plans and selecting the lowest cost execution plans to fire and finally execute a query
基于成本的优化涉及生成多个执行计划,并选择成本最低的执行计划来触发并最终执行查询
The CPU, IO, and memory are some of the parameters SQL Server uses in recognizing the cost and finally generating the execution plan.
CPU,IO和内存是SQL Server用于识别成本并最终生成执行计划的一些参数。
What you will write against SQL Server is often totally different from what SQL Server actually executes. Hence, that is in the concept of logical query operation when compared to the physical operation which SQL Server uses.
您将针对SQL Server编写的内容通常与SQL Server实际执行的内容完全不同。 因此,与SQL Server使用的物理操作相比,这就是逻辑查询操作的概念。
For example, when we are talking about a logical INNER JOIN which actually gets translated physically on the execution by SQL Server as a nested loop JOIN.
例如,当我们谈论逻辑INNER JOIN时,它实际上在执行SQL Server时就作为嵌套循环JOIN进行物理转换。
Let us execute the following query to view the concept of logical query operation. You can check the option of include actual execution plan or CTRL+M
让我们执行以下查询以查看逻辑查询操作的概念。 您可以检查包括实际执行计划或CTRL + M的选项
USE AdventureWorks2014
GO
SELECT *
FROM [Sales].[SalesPerson] sp
INNER JOIN [Sales].[SalesPersonQuotaHistory] spq
  ON sp.BusinessEntityID = spq.BusinessEntityID
ORDER BY sp.SalesQuota
GO
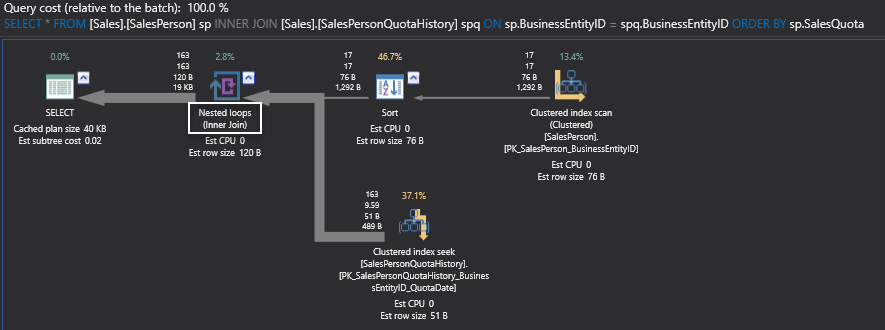
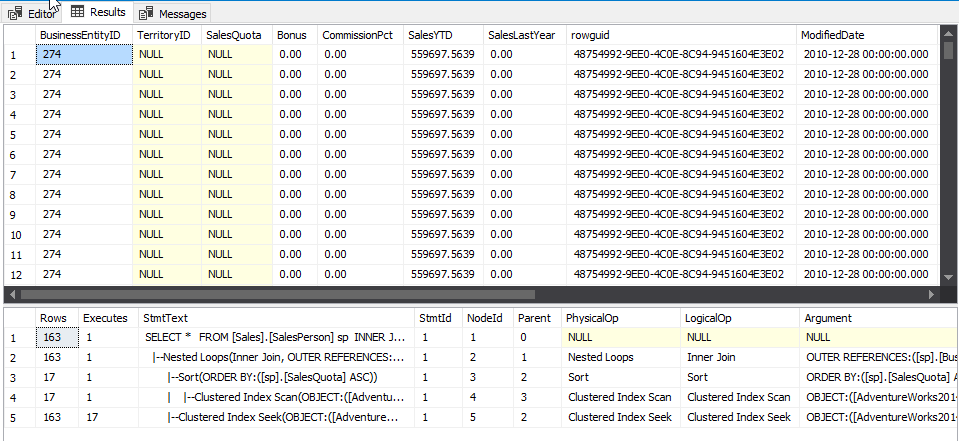
Here you can see that the physical operation involves nested loops while the logical operation includes an inner join.
在这里,您可以看到物理操作涉及嵌套循环,而逻辑操作包括内部联接。
Our physical operator in this particular case is the nested loop which is the actual execution mode for SQL Server, whereas the logical operation here is the inner join which is defined inside our select statement.
在这种特殊情况下,我们的物理运算符是嵌套循环,这是SQL Server的实际执行模式,而这里的逻辑运算是内部联接,该内部联接在我们的select语句中定义。
寻找最佳计划 (Finding an optimal plan)
The way SQL Server ultimately determines an optimal plan is by finding the balance between what plan it wants to select and the maximizing the effectiveness of that the particular plan before the actual execution happens.
SQL Server最终确定最佳计划的方式是,在实际执行之前,找到要选择的计划与最大化特定计划的效率之间的平衡。
So there is a give-and-take between generating the best plan and completing the task, in a finite amount of time, before SQL Server has to step out from indefinitely going about optimizing the query plan.
因此,在SQL Server必须无限期地逐步优化查询计划之前,必须在有限的时间内生成最佳计划和完成任务之间需要付出一定的代价。
SQL Server does this cost optimization and it is quite efficient in actually bringing about the best plan as fast as possible.
SQL Server进行了成本优化,并且在尽可能快地实现最佳计划方面非常有效。
Let us check whether SQL Server chooses the optimal execution plan for the previous query or not. What we are going to do is to go ahead and explicitly state a hash join and compare execution plans.
让我们检查一下SQL Server是否为上一个查询选择了最佳执行计划。 我们要做的是继续明确声明哈希联接并比较执行计划。
SELECT *
FROM [Sales].[SalesPerson] sp
INNER JOIN [Sales].[SalesPersonQuotaHistory] spq
  ON sp.BusinessEntityID = spq.BusinessEntityID
ORDER BY sp.SalesQuota
GO

SELECT *
FROM [Sales].[SalesPerson] sp
INNER HASH JOIN [Sales].[SalesPersonQuotaHistory] spq
  ON sp.BusinessEntityID = spq.BusinessEntityID
ORDER BY sp.SalesQuota
GO
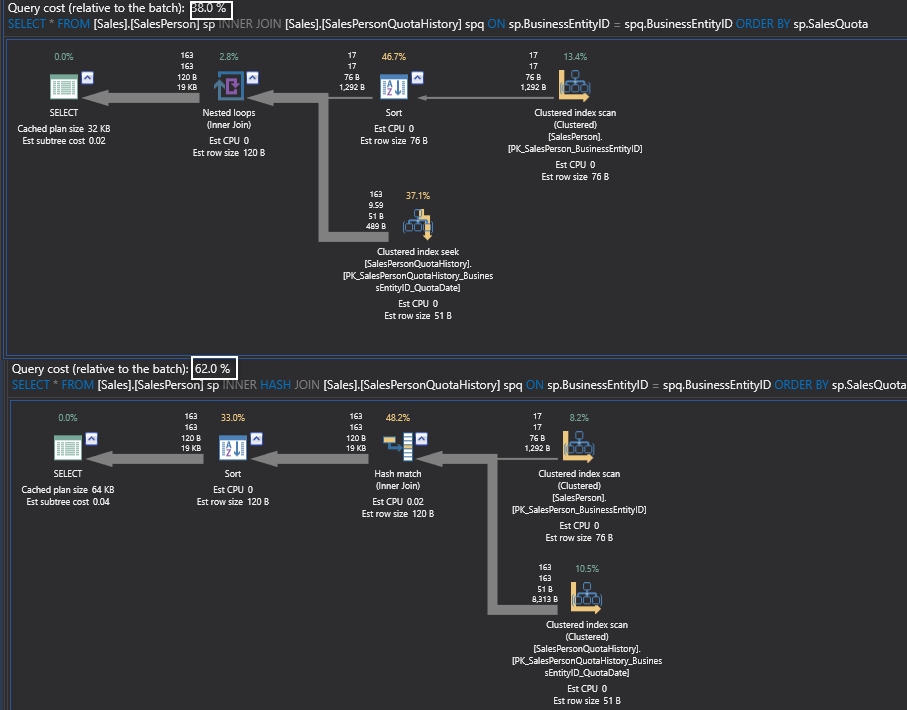
This shows that giving an explicit hint in this particular case seems to be costly.
这表明在这种特殊情况下给出明确的提示似乎是昂贵的。
With applying the 80-20 rule, it is advisable to leave SQL Server (cost-based optimizer) to choose which is the best and most optimal plan is.
应用80-20规则后,建议让SQL Server(基于成本的优化器)选择最佳和最佳计划。
估计执行计划 (Estimated execution plans)
The estimated execution plan, for all practical purposes, uses statistics and many other parameters based on what is available on this server and generates the plan.
出于所有实际目的,估计的执行计划会根据此服务器上的可用数据使用统计信息和许多其他参数,并生成计划。
This is an estimated plan and not specifically the plan that has been generated by SQL Server.
这是一个估计的计划,而不是SQL Server生成的计划。
This is synonymous to the first analogy that we had given about the weather forecast.
这与我们对天气预报的第一个类推是同义词。
Next we’ll review various display options for estimated execution plans
接下来,我们将查看各种显示选项以估算执行计划
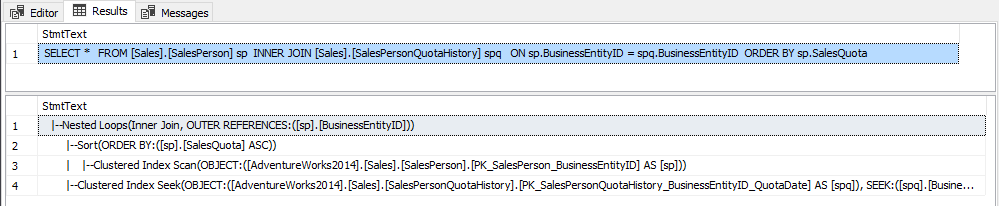
SHOWPLAN_TEXT
SHOWPLAN_TEXT
This option is similar to the estimated graphical execution plan, as it gives you the text of the execution plan and gives you information about what the execution plan is. It does not give you any of the frills which are normally associated with the execution plan.
此选项类似于估计的图形执行计划,因为它为您提供了执行计划的文本,并为您提供了有关执行计划的信息。 它不会给您任何通常与执行计划相关的装饰。
SET SHOWPLAN_TEXT ON
GO
SELECT *
FROM [Sales].[SalesPerson] sp
INNER JOIN [Sales].[SalesPersonQuotaHistory] spq
  ON sp.BusinessEntityID = spq.BusinessEntityID
ORDER BY sp.SalesQuota
GO
SET SHOWPLAN_TEXT OFF
GO
SHOWPLAN_ALL
SHOWPLAN_ALL
This option is similar to the estimated graphical execution plan, but has some of the additional features attached to it including the type of physical operator and type of logical operator
此选项与估计的图形执行计划相似,但具有一些附加功能,包括物理运算符的类型和逻辑运算符的类型
SET SHOWPLAN_ALL ON
GO
SELECT *
FROM [Sales].[SalesPerson] sp
INNER JOIN [Sales].[SalesPersonQuotaHistory] spq
  ON sp.BusinessEntityID = spq.BusinessEntityID
ORDER BY sp.SalesQuota
GO
SET SHOWPLAN_ALL OFF
GO
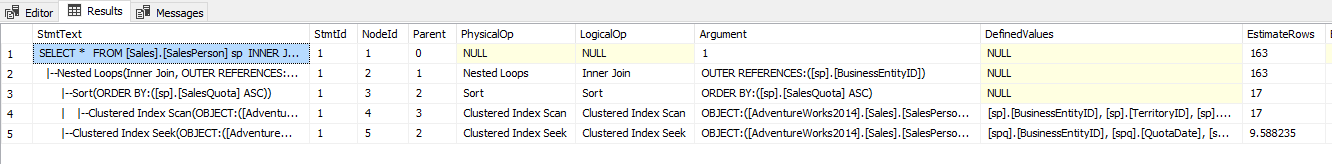
This again is the estimated execution plan; remember you did not see a result set where the actual query has been executed.
这又是估计的执行计划; 请记住,您没有看到执行实际查询的结果集。
SHOWPLAN_XML
SHOWPLAN_XML
SET SHOWPLAN_XML ON
GO
SELECT *
FROM [Sales].[SalesPerson] sp
INNER JOIN [Sales].[SalesPersonQuotaHistory] spq
  ON sp.BusinessEntityID = spq.BusinessEntityID
ORDER BY sp.SalesQuota
GO
SET SHOWPLAN_XML OFF

GO

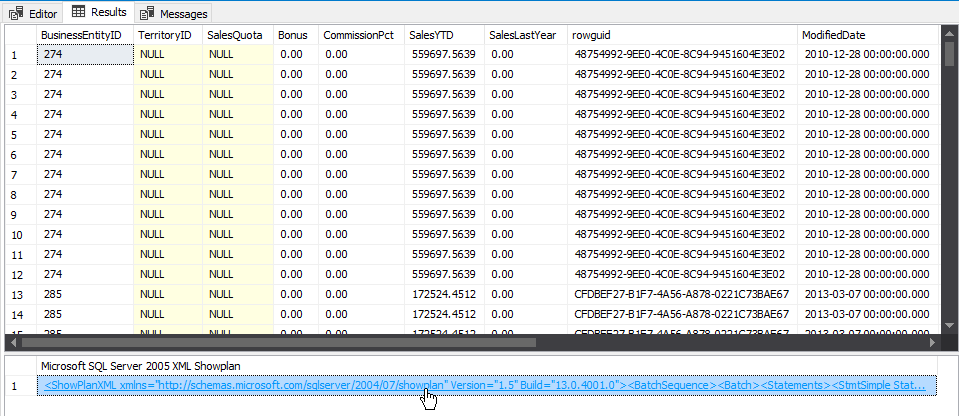
You can see that the query plan comes in an XML format. You can look at execution plan as per estimation.
您可以看到查询计划以XML格式出现。 您可以根据估计来查看执行计划。
实际执行计划 (Actual execution plan)
We said that the estimated execution plan is like the weather forecast, so the actual execution plan is where you can realize whether it actually rained or not.
我们说过,估计执行计划就像天气预报一样,因此实际执行计划是您可以了解是否实际下雨的地方。
It shows what SQL Server actually does to get the result of your query.
它显示了SQL Server为获取查询结果实际执行的操作。
Here we’ll review the display options for actual execution plans
在这里,我们将查看实际执行计划的显示选项
STATISTICS TIME
统计时间
This option gives you the amount of time that has been spent as far as SQL Server is executing this particular query. It also provides you interesting insights into some of the information.
此选项为您提供了到SQL Server执行此特定查询为止所花费的时间。 它还为您提供了一些信息的有趣见解。
SET STATISTICS TIME ON
GO
SELECT *
FROM [Sales].[SalesPerson] sp
INNER JOIN [Sales].[SalesPersonQuotaHistory] spq
  ON sp.BusinessEntityID = spq.BusinessEntityID
ORDER BY sp.SalesQuota
GO
SET STATISTICS TIME OFF
GO
In this particular case, the query gets executed with 163 rows and you can also see how much time of CPU that this particular query has taken and what is the actual time with respect to the execution process.
在这种特定情况下,查询将以163行执行,您还可以查看此特定查询已花费了多少CPU时间以及相对于执行过程而言的实际时间是多少。
So here it states that the execution time is close to about 196 milliseconds.
因此,这里说明执行时间接近196毫秒。
If you want to know granular to what exactly the query is executing and how much of time and resources it is taking, this is one of the most ancient ways but still effective to use on any day.
如果要详细了解查询的确切执行情况以及查询占用的时间和资源,这是最古老的方法之一,但仍然可以在任何一天使用。
STATISTICS IO
统计IO
This option shows the IO characteristics. You can see that this particular query in this particular table has gone ahead and done these mini scans and these are the logical reads.
此选项显示IO特性。 您可以看到此特定表中的特定查询已经进行并执行了这些小型扫描,并且这些是逻辑读取。
SET STATISTICS IO ON
GO
SELECT *
FROM [Sales].[SalesPerson] sp
INNER JOIN [Sales].[SalesPersonQuotaHistory] spq
  ON sp.BusinessEntityID = spq.BusinessEntityID
ORDER BY sp.SalesQuota
GO
SET STATISTICS IO OFF
GO
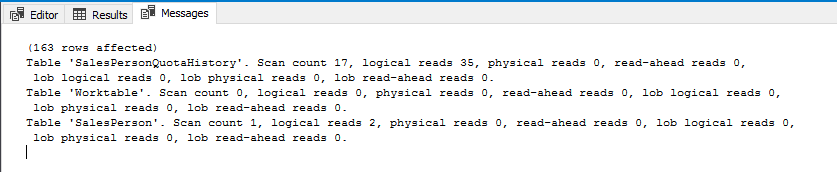
If you have scans and other mechanism hardware you will also see something which is interesting. You might also see physical reads, read-ahead reads and large object data including the reads that are associated with it.
如果您有扫描和其他机制的硬件,您还将看到一些有趣的东西。 您可能还会看到物理读取,预读读取和大型对象数据,包括与之关联的读取。
When you have a large number of reads of a complex query, you might use these methods to actually look at which table is sending out a large number of reads and hence it is getting near the physical IO subsystem.
当您读取大量复杂查询时,您可能会使用这些方法来实际查看哪个表发出大量读取,因此它接近物理IO子系统。
A physical read in this particular case shows zero because it is not getting cached. And if this value is very high that means a lot of physical IO has been happening to bring the data from the IO subsystem or your hard disk to the memory or the buffer pool.
在这种特殊情况下,物理读取显示为零,因为它没有被缓存。 而且,如果此值很高,则意味着发生了很多物理IO,这些数据将IO子系统或硬盘中的数据带到内存或缓冲池中。
The set statistics time on and set statistics IO on are great set operations that you can actually use to see how SQL Server goes about executing.
设置统计信息时间和设置统计信息IO是非常好的设置操作,您可以实际使用它们来查看SQL Server如何执行。
I have seen DBAs come back to me and say, “I can use profiler also as a mechanism to actually go ahead and look at these values”. But when you are analyzing a simple query or optimizing a simple operation, it is always handy to have these simple tools which work even from SQL Server 2000 days and these are very handy tools that give you information and insights into the query that you are playing with.
我已经看到DBA再次对我说:“我还可以使用探查器作为一种机制来实际研究这些值”。 但是,当您分析一个简单的查询或优化一个简单的操作时,拥有这些甚至可以在SQL Server 2000上运行的简单工具总是很方便的,并且这些非常方便的工具可以为您提供有关正在玩的查询的信息和见解。用。
STATISTICS PROFILE
统计资料
This is like SHOWPLAN_TEXT for estimated Execution plans but it retrieves the text of the actual execution plan which means that the query has already been executed.
这类似于估算的执行计划的SHOWPLAN_TEXT,但是它检索实际执行计划的文本,这意味着查询已被执行。
SET STATISTICS PROFILE ON
GO
SELECT *
FROM [Sales].[SalesPerson] sp
INNER JOIN [Sales].[SalesPersonQuotaHistory] spq
  ON sp.BusinessEntityID = spq.BusinessEntityID
ORDER BY sp.SalesQuota
GO
SET STATISTICS PROFILE OFF
GO
STATISTICS XML
统计XML
Also likeSHOWPLAN_XML, this option shows the actual execution plan in XML format.
与SHOWPLAN_XML一样,此选项以XML格式显示实际的执行计划。
SET STATISTICS XML ON
GO
SELECT *
FROM [Sales].[SalesPerson] sp
INNER JOIN [Sales].[SalesPersonQuotaHistory] spq
  ON sp.BusinessEntityID = spq.BusinessEntityID
ORDER BY sp.SalesQuota
GO
SET STATISTICS XML OFF
GO
摘要 (Summary)
Execution plans are a very important indicator for optimizing query performance. Every DBA needs to know all the details about the execution plan. I tried to be simple in discussing the very basic details for beginners. I hope this article has been informative for you.
执行计划是优化查询性能的重要指标。 每个DBA都需要了解有关执行计划的所有详细信息。 在讨论初学者的基本细节时,我尽量简单一些。 希望本文对您有所帮助。
Next article in this series:
本系列的下一篇文章:
- SQL Server Query Execution Plans for beginners – Clustered Index Operators面向初学者SQL Server查询执行计划–聚集索引运算符
参考资料 (References)
- Displaying Graphical Execution Plans (SQL Server Management Studio) 显示图形执行计划(SQL Server Management Studio)
- Displaying Execution Plans by Using the Showplan SET Options (Transact-SQL) 通过使用Showplan SET选项(Transact-SQL)显示执行计划
- XML Showplans XML显示计划
翻译自: https://www.sqlshack.com/sql-server-query-execution-plan-beginners-types-options/
sql查询初学者指南


 被折叠的 条评论
为什么被折叠?
被折叠的 条评论
为什么被折叠?
 到【灌水乐园】发言


