


预编译sql查询语句
previous part of this article, we presented query recompilation basics. We explained when a query is compiled, when recompiled, and what preferred behavior is. We also showed the how to trigger a recompilation using T-SQL and provided examples. In this part, we will focus on detecting frequent query recompilations and frequently recompiled queries. 前一部分 ,我们介绍了查询重新编译的基础知识。 我们解释了何时编译查询,何时重新编译查询以及首选的行为。 我们还展示了如何使用T-SQL触发重新编译并提供了示例。 在这一部分中,我们将专注于检测频繁查询重新编译和频繁重新编译的查询。There are certain scenarios when the query is automatically removed from cache, so the next time the query is called, SQL Server will not find its query execution plan in cache and will have to recompile it.
在某些情况下,查询会自动从缓存中删除,因此,下次调用查询时,SQL Server将不会在缓存中找到其查询执行计划,而必须重新编译它。
Whenever SQL Server is restarted, all query execution plans stored in cache are removed from cache.
每当重新启动SQL Server时,存储在缓存中的所有查询执行计划都将从缓存中删除。
Excessive SQL Server activity. New queries are compiled, added to cache which size is limited, so at a point, the old query execution plans are moved out of cache to make space for the new ones.
SQL Server活动过多。 新的查询会被编译,并添加到受大小限制的缓存中,因此,在某种程度上,旧的查询执行计划已从缓存中移出,以便为新查询腾出空间。
When a database that contains the stored procedure, or any object referenced by the query is restored.
还原包含存储过程或查询引用的任何对象的数据库时。
When a schema of an object referenced by the query is changed. These changes include:
查询所引用的对象的架构更改时。 这些更改包括:
Table and view column changes (a column added or dropped)
Index changes
Constraint, defaults, and rule changes
Triggers created or dropped
Table statistics drops
表和视图列的更改(添加或删除的列)
指数变化
约束,默认值和规则更改
创建或删除触发器
表统计下降
When a table referenced by the query has more data changes than specified by the threshold. The threshold can be changed using the KEEP PLAN query hint, as described in Frequent query recompilations – a SQL query performance killer –introduction
当查询所引用的表的数据更改量大于阈值指定的值时。 可以使用KEEP PLAN查询提示来更改阈值,如“ 频繁查询重新编译– SQL查询性能的杀手–介绍”中所述。
When you execute a query or stored procedure where a schema change is followed by a data operation, such as SELECT, INSERT, UPDATE, or DELETE. In other words, when DDL (Data Definition Language) statements are interleaved with DML (Data Manipulation Language) statements. The query will be recompiled when it reaches the first data operation.
当您执行查询或存储过程时,在模式更改后进行数据操作,例如SELECT,INSERT,UPDATE或DELETE。 换句话说,当DDL(数据定义语言)语句与DML(数据操作语言)语句交错时。 查询到达第一个数据操作时将重新编译。
CREATE PROCEDURE TestRecomp
AS
BEGIN
    -- DDL statement
    CREATE TABLE TestTab( id int, cola int, colb nvarchar(30))

    SELECT *
      FROM TestTab -- DML statement - the first recompilation

    ALTER TABLE TestTab
    ADD colc datetime -- Another DDL statement - the second recompilation

    SELECT id
      FROM TestTab -- DML - the third recompilation

END
When you run
当你跑步
EXEC TestRecomp
There will be three recompilations, as indicated in the comments
如评论中所述,将进行三次重新编译
When a SET option is changed
It’s recommended not to save any of SET options (ANSI_NULLS, Quoted_identifier, etc.) in a stored procedure, as they cause recompilation
更改SET选项时
建议不要在存储过程中保存任何SET选项(ANSI_NULLS,Quoted_identifier等),因为它们会导致重新编译
Since SQL Server 2005, only the statement that causes a recompilation is recompiled. This is a statement-level recompilation. In the earlier versions, all statements in the stored procedure were recompiled, which affected SQL Server performance even more.
从SQL Server 2005开始,仅重新编译导致重新编译的语句。 这是语句级的重新编译。 在早期版本中,存储过程中的所有语句都被重新编译,这对SQL Server的性能影响更大。
使用Windows Performance Monitor检测重新编译 (Detecting recompilations using Windows Performance Monitor)
Windows Performance Monitor can be used to track both compilations and recompilations.
Windows Performance Monitor可用于跟踪编译和重新编译。
The metric that tracks the number of compilations per second is SQL Compilations/Sec. It’s located in the SQL Server Statistics section. The metric shows the number of query and procedure compilations in a second. It’s expected that the value is high on SQL Server start up, but is should fall and stabilize after a while.
跟踪每秒编译数量的指标是SQL Compilations / Sec 。 它位于“ SQL Server统计信息”部分。 该指标在一秒钟内显示查询和过程编译的数量。 预计该值在SQL Server启动时会很高,但应该会下降并在一段时间后稳定下来。
The metric that shows the number of query and procedure recompilations in a second is SQL Re-Compilations/Sec. A high value is a clear indication of frequent recompilations that lead to processor stress and SQL Server performance degradation.
每秒显示查询和过程重新编译的数量的指标是SQL Re-Compilations / Sec 。 较高的值清楚地表明频繁的重新编译会导致处理器压力和SQL Server性能下降。
The ideal value for the number of recompilations per second is zero. There is no specific threshold value. You should watch for the metric trend and set a baseline. However, it is also recommended to have the Compilations/sec value to be less than 10% of the Batch Requests/sec value. Another recommendation is that the number of Recompilations/sec should be less than 10% of Compilations/sec.
每秒重新编译次数的理想值为零。 没有具体的阈值。 您应该注意指标趋势并设置基线。 但是,还建议“ 编译/秒”值小于“ 批处理请求/秒”值的10%。 另一项建议是, 重新编译的数/秒应汇编/秒的低于10%。
If the values are constantly high, further investigation is required.
如果值一直很高,则需要进一步调查。
- Windows Performance Monitor, using one of the following methods: Windows Performance Monitor :
- Start (Windows + C for Windows 8), select 开始” (适用于Windows 8的Windows + C),选择“ Search, type 搜索” ,键入perfmon, and press perfmon ,然后按EnterEnter键。
- Start, 开始” , Run (Windows + R for Windows 8), type “运行” (对于Windows 8为Windows + R),键入perfmon, and press perfmon ,然后按EnterEnter键。
- Control Panel, select 控制面板 ,选择“ System and Security, Administrative Tools, and click 系统和安全性”,“管理工具” ,然后单击“ Performance Monitor性能监视器”。
- Monitoring Tools, Performance Monitor in the left pane监视工具”,“性能监视器 ”
- Add icon in the menu添加图标
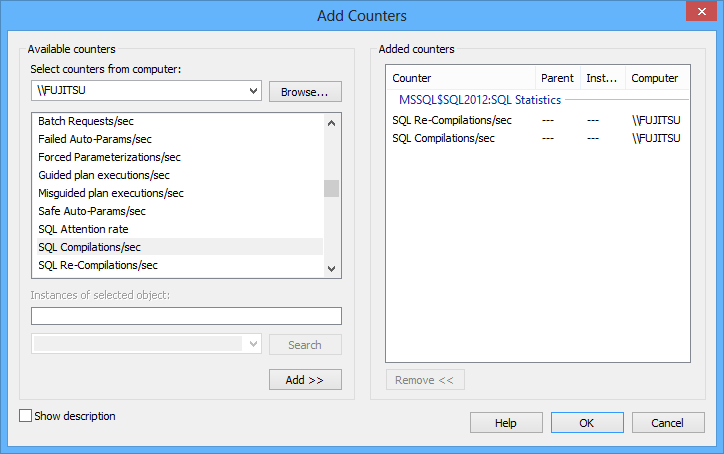
- Add counters dialog select the machine name in the drop-down list添加计数器”对话框中,在下拉列表中选择计算机名称。
- MSSQL$<sql server instance>: SQL StatisticsMSSQL $ <sql服务器实例>:SQL Statistics
Expand the list, select SQL Re-Compilations/sec, and click Add. To track the recompilations as well, select SQL Compilations/sec
展开列表,选择“ SQL Re-Compilations / sec” ,然后单击“ 添加” 。 要也跟踪重新编译,请选择“ SQL编译/秒”
Click OK
点击确定
The Performance Monitor graph will show the number of compilations and recompilations per second.
性能监视器图将显示每秒的编译和重新编译次数。
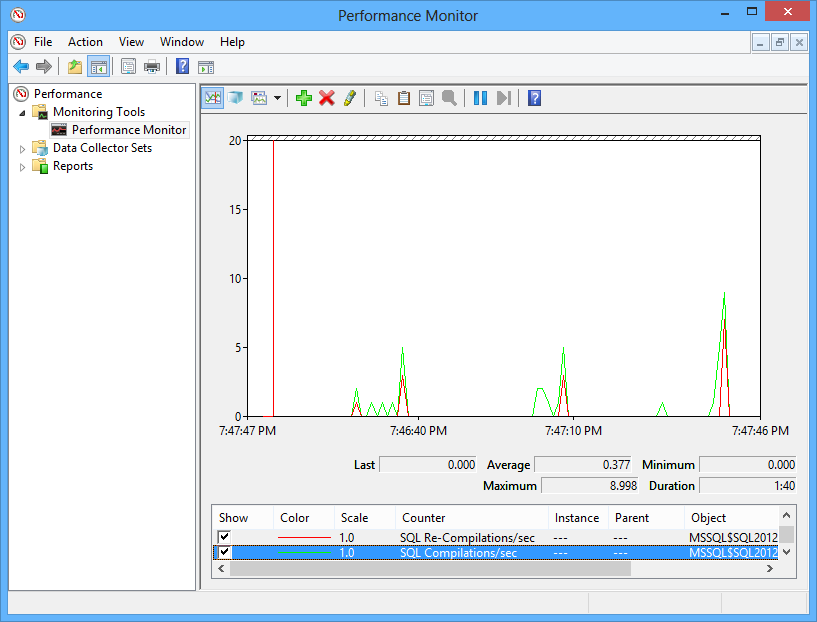
The advantages of Performance Monitor are that it is available in Windows Server 2003 and later and easy to use. It shows the graphs in real-time, adds little overhead, and you can monitor only specific counters. Although it clearly shows the number of recompilations, it doesn’t show the queries and stored procedures recompiled, which is necessary for troubleshooting.
Performance Monitor的优点是它在Windows Server 2003和更高版本中可用,并且易于使用。 它实时显示图形,几乎不增加开销,并且您只能监视特定的计数器。 尽管它清楚地显示了重新编译的次数,但没有显示查询和存储过程的重新编译,这对于故障排除是必需的。
使用sys.dm_os_performance_counters检测重新编译 (Detecting recompilations using sys.dm_os_performance_counters)
The SQL Compilations/Sec and SQL Re-Compilations/Sec metrics are also available in the sys.dm_os_performance_counters dynamic management view.
sys.dm_os_performance_counters动态管理视图中还提供了SQL编译/秒和SQL重新编译/秒指标。
As it’s useful to compare the number of recompilations to the number of compilations and batch requests, select all three metrics.
由于将重新编译次数与编译次数和批处理请求次数进行比较非常有用,因此请选择所有三个指标。
SELECT *
  FROM sys.dm_os_performance_counters
  WHERE counter_name IN('Batch Requests/sec', 'SQL Compilations/sec', 'SQL Re-Compilations/sec')
The counter type value 272696576 indicates these are cumulative values since the last SQL Server restart, and should be recalculated to get the number per second. We’ll use a 10 second sampling.
计数器类型值272696576指示这些是自上次SQL Server重新启动以来的累积值,应重新计算以获取每秒的数量。 我们将使用10秒的采样时间。
DECLARE @CountVal BIGINT;

SELECT @CountVal = cntr_value
FROM sys.dm_os_performance_counters
WHERE counter_name = 'SQL Re-Compilations/sec';

WAITFOR DELAY '00:00:10';

SELECT (cntr_value - @CountVal) / 10 AS 'SQL Re-Compilations/sec'
FROM sys.dm_os_performance_counters
WHERE counter_name = 'SQL Re-Compilations/sec';
Again, there’s no information about the queries and stored procedures that are recompiled, which is necessary for troubleshooting
同样,没有有关重新编译的查询和存储过程的信息,这对于故障排除是必需的
使用SQL Server Profiler检测重新编译 (Detecting recompilations using SQL Server Profiler)
Recompilations are captured in SQL Server traces. To find out whether a recompilation has occurred, use SQL Server Profiler to read the traces.
重新编译在SQL Server跟踪中捕获。 若要确定是否发生了重新编译,请使用SQL Server Profiler读取跟踪。
- SQL Server ProfilerSQL Server Profiler
- File menu, select 文件菜单上,选择New Trace新建跟踪
- Connect to Server dialog, select the SQL Server instance and provide credentials连接到服务器”对话框中,选择SQL Server实例并提供凭据
- Connect连接
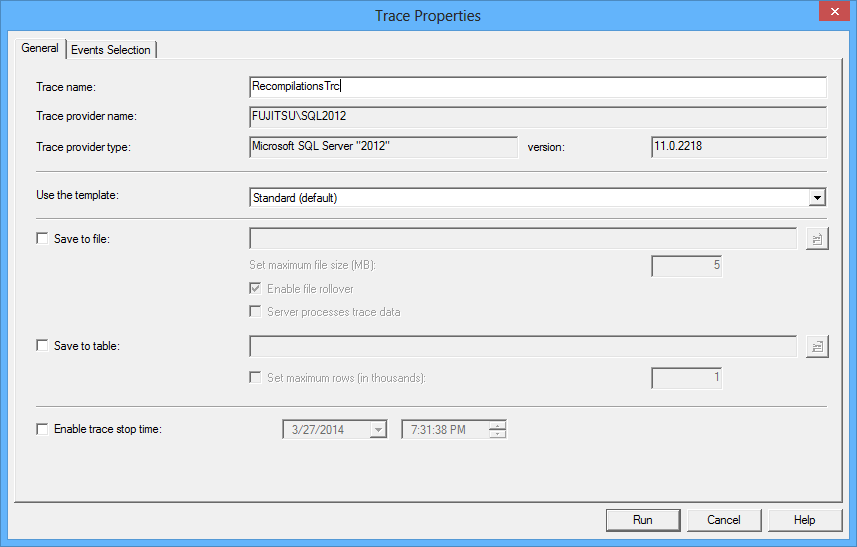
In the General tab, specify the trace name
在“ 常规”选项卡中,指定跟踪名称
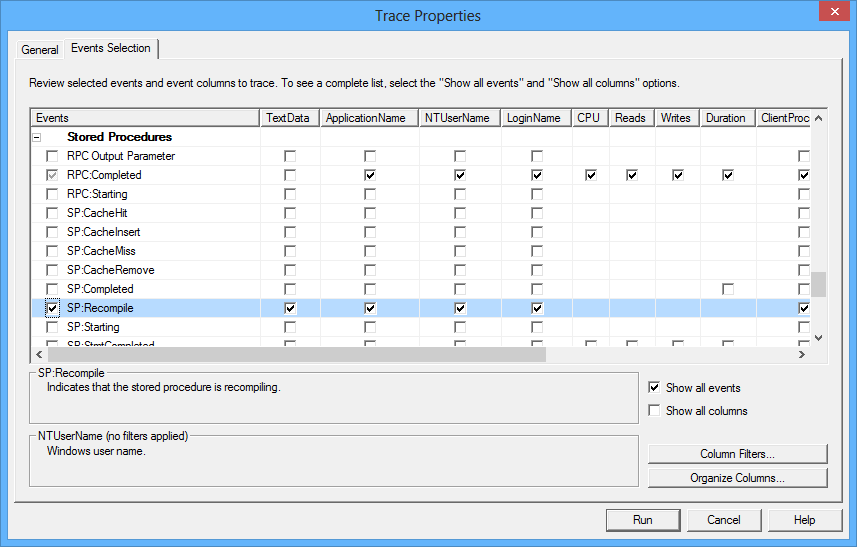
Open the Events Section tab
打开事件部分选项卡
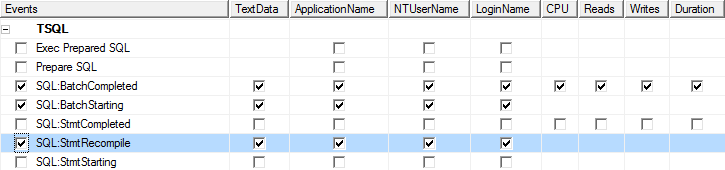
Note that recompilations are not captured into SQL traces by default. To capture them, you have to select them manually.
请注意,默认情况下,重新编译不会捕获到SQL跟踪中。 要捕获它们,您必须手动选择它们。
- Show All Events checkbox显示所有事件复选框
- Events grid, scroll down to the 事件”网格中,向下滚动到“ Stored Procedures node and expand it存储过程”节点并将其展开
Select the SP:Recompile row
选择“ SP:Recompile”行
This option is only for tracking recompilations on stored procedures
此选项仅用于跟踪存储过程中的重新编译
To track recompilations on ad hoc queries, expand the TSQL node and select the SQL:Stmt Recompile row
要跟踪临时查询的重新编译,请展开TSQL节点并选择SQL:Stmt Recompile行
- Run运行
The stored procedure recompilations are shown as SP:Recompile event class. The statement that is recompiled is shown in the text data column, as well as in the lower pane of the SQL Server Profiler window.
存储过程的重新编译显示为SP:Recompile事件类。 文本数据列以及“ SQL Server Profiler”窗口的下部窗格中显示了重新编译的语句。
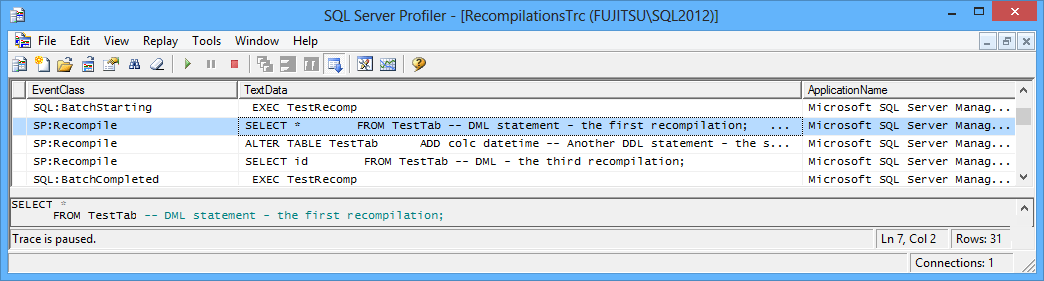
Ad hoc query recompilations are shown as the SQL:Stmt Recompile event class.
临时查询重新编译显示为SQL:Stmt Recompile事件类。
SQL Server Profiler offers the Find option to search for the specific events, but it doesn’t enable filtering by a specific event class which would make recompilation analysis easier. The statements recompiled are shown, so that can be used to find the most often recompiled queries and stored procedures. The downside of this method is that running SQL Server traces can add overhead to SQL Server performance.
SQL Server Profiler提供了“查找”选项来搜索特定事件,但是它没有启用按特定事件类进行的筛选,这会使重新编译分析更加容易。 显示了重新编译的语句,因此可用于查找最经常重新编译的查询和存储过程。 这种方法的缺点是运行SQL Server跟踪会增加SQL Server性能的开销。
In this article, we showed when the recompilation occurs automatically. We also presented three different methods that can be used for monitoring recompilations. Windows Performance Monitor and sys.dm_os_performance_counters view show the number or recompilations in a second, but cannot be used for deeper analysis and troubleshooting. SQL Server Profiler shows the recompiled statements, therefore provides enough information for further investigation.
在本文中,我们显示了何时自动进行重新编译。 我们还介绍了可用于监视重新编译的三种不同方法。 Windows Performance Monitor和sys.dm_os_performance_counters视图可以在一秒钟内显示数量或重新编译,但不能用于更深入的分析和故障排除。 SQL Server Profiler显示了重新编译的语句,因此提供了足够的信息以供进一步研究。
翻译自: https://www.sqlshack.com/frequent-query-recompilations-sql-query-performance-killer-detection/
预编译sql查询语句


 926
926

 被折叠的 条评论
为什么被折叠?
被折叠的 条评论
为什么被折叠?
 到【灌水乐园】发言


