


Over the past three years, I read some interesting news about Microsoft which was “Microsoft acquires mobile business intelligence leader Datazen”. This news made me excited because showing Reporting Service reports in mobile devices can be painful and often not effective for end users. After this acquisition, Microsoft developers worked quickly to adapt the Datazen application to SQL Server Reporting Services and this effort culminated in Microsoft SQL Server Mobile Report Publisher.
在过去的三年中,我读到了一些有关Microsoft的有趣消息,即“ Microsoft收购了移动商业智能领导者Datazen ”。 这个消息使我很兴奋,因为在移动设备中显示Reporting Service报告可能会很痛苦,并且通常对最终用户没有效果。 收购完成后,Microsoft开发人员Swift工作以使Datazen应用程序适应SQL Server Reporting Services,这一努力最终达到了Microsoft SQL Server Mobile Report Publisher。
Microsoft SQL Server Mobile Report Publisher is a report design tool which allows us to create mobile reports and publish them to SQL Server Reporting Services. We can use these reports on mobile devices very easily. In this article, we are going to explore how to create a mobile dashboard with SQL Server Mobile Report Publisher and publish this mobile report to SQL Server Reporting Services.
Microsoft SQL Server移动报表发布器是一种报表设计工具,它使我们能够创建移动报表并将其发布到SQL Server Reporting Services。 我们可以非常轻松地在移动设备上使用这些报告。 在本文中,我们将探讨如何使用SQL Server Mobile Report Publisher创建移动仪表板并将此移动报表发布到SQL Server Reporting Services。
Before starting the demonstration, I want to add some additional notes about report design. Microsoft recommends two report design approaches;
在开始演示之前,我想添加一些有关报表设计的附加说明。 Microsoft建议使用两种报表设计方法。
- Design First 设计第一
- Data First 数据优先
Design First: In this approach, we will create the report design without any data. If your BI department has formed design and data development teams, you can use this approach; because the report designer does not need to wait for dataset creation.
首先设计:通过这种方法,我们将创建没有任何数据的报告设计。 如果您的BI部门已经组建了设计和数据开发团队,则可以使用这种方法。 因为报表设计者不需要等待数据集的创建。
Data First: In this approach, we will populate all required data to mobile report and then design to report. The advantage of this approach is we can design all elements with real data. But if you ask my work approach, first of all, I would create a draft Excel file which includes all columns name with some sample data and develops the report design with this Excel file. And then I will discuss the report with the owner (customer) over this report prototype. Finally, I will make the changing to the report and connect to real time data.
数据优先:通过这种方法,我们会将所有必需的数据填充到移动报告中,然后设计报告。 这种方法的优点是我们可以使用真实数据设计所有元素。 但是,如果您问我的工作方法,首先,我将创建一个包含所有列名称和一些示例数据的Excel文件草稿,并使用此Excel文件开发报表设计。 然后,我将通过此报告原型与所有者(客户)讨论报告。 最后,我将更改报告并连接到实时数据。
示范 (Demonstration)
创建数据源和数据集 (Creating data source and dataset)
In the first step of this demonstration; we will create a data source and dataset in SSRS.
在本演示的第一步; 我们将在SSRS中创建数据源和数据集。
Open the Reporting Services web portal. Click the New button and select Data Source.
打开Reporting Services Web门户。 单击新建按钮,然后选择数据源。
We will give a name (MobileReportSample) to our data source and then we will fill the required fields for connection strings. In this settings page; we will select a connection type and set the credentials of connection.
我们将给数据源一个名称(MobileReportSample),然后填写连接字符串的必填字段。 在此设置页面中; 我们将选择一种连接类型并设置连接凭据。
Now, we will create a data source for our mobile report. Click New and then select DataSet. If the Microsoft SQL Server Report Builder is installed your computer, it will automatically be opened. If you have not installed the Report Builder you can click Get Report Builder link and download Report Builder.
现在,我们将为移动报告创建数据源。 点击新建 ,然后选择数据集 。 如果您的计算机上安装了Microsoft SQL Server报表生成器,它将自动打开。 如果尚未安装报表生成器,则可以单击获取报表生成器链接并下载报表生成器。
Select the MobileReportSample dataset which was created in the previous step and clicks Create.
选择在上一步中创建的MobileReportSample数据集,然后单击创建 。
Tip: This script will generate a sample data for mobile report. This data simulates territory sales which are made by salesperson. We will use this data in our mobile dashboard graphics.
提示:该脚本将为移动报告生成样本数据。 此数据模拟销售员进行的地区销售。 我们将在移动仪表盘图形中使用这些数据。
DROPTABLEIFEXISTS  DemoForMobileReport
CREATETABLE DemoForMobileReport
(Id INTPRIMARYKEYIDENTITY(1,1),
Dt DATE,
SalesPerson VARCHAR(200),
SalesAmnt FLOAT,
TargetSaleAmnt FLOAT,
ContOfSale VARCHAR(200),
ContOfCountry VARCHAR(200))

INSERTINTO DemoForMobileReport
values
('20180112',' Charles','7985.80','7137','Europe','Norway'),
('20180208','Steven','3133.34','3565','Europe','Turkey'),
('20180311','Michael','2158.64','2500','Asia','Japan'),
('20180318','George','11332.86','14300','Europe','Germany'),
('20180402','Jonny','938.98','1200','Africa','Tunisia'),
('20180322','Jonny','807','3000','Oceania','New Zeland')
Click Edit as Text and copy/paste the following query.
单击“ 编辑为文本”,然后复制/粘贴以下查询。
SELECT*FROM DemoForMobileReport
Click (!) exclamation mark and populate data. Click save button and save the dataset to report server.
单击(!)感叹号并填充数据。 单击保存按钮,然后将数据集保存到报表服务器。
设计移动仪表板 (Designing mobile dashboard)
Launch the Microsoft SQL Server Mobile Report Publisher. In the first step we will create data connections between SSRS and mobile report.
启动Microsoft SQL Server移动报表发布器。 第一步,我们将在SSRS和移动报告之间创建数据连接。
Click Server connections in top of the panel.
单击面板顶部的服务器连接 。
Fill the required fields with the SSRS web portal URL and credentials. Click Connect.
使用SSRS网站门户URL和凭据填写必填字段。 单击连接 。
Select Data tab and click Add data
选择数据选项卡,然后单击添加数据
Select Report server …
选择报告服务器 …
Select the data set …
选择数据集…
Data will populate the mobile report screen …
数据将填充移动报告屏幕……
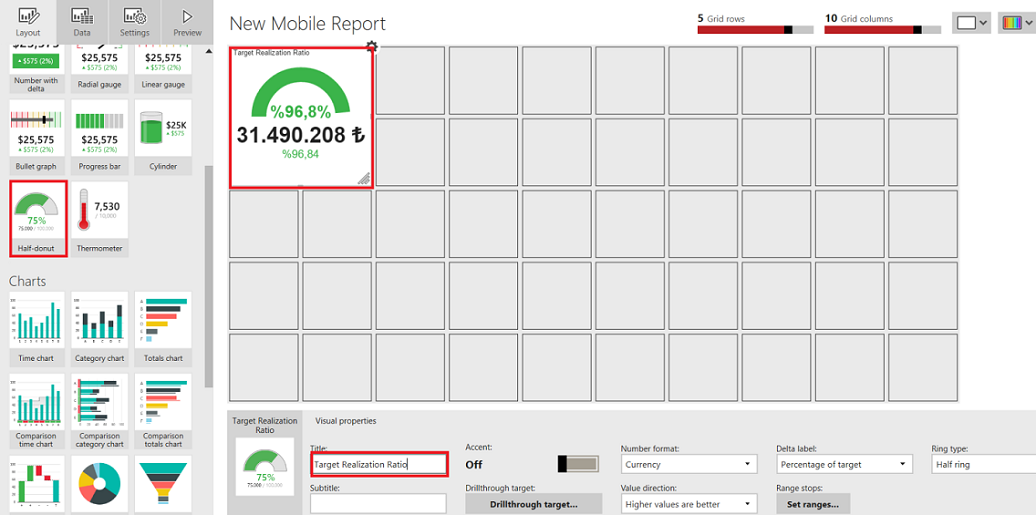
In our mobile report design; first, we will add Half-donut gauge. The purpose of this gauge is to compare SalesAmnt field and TargetSaleAmnt field so we will show target realization ratio.
在我们的移动报告设计中; 首先,我们将添加半甜甜圈计。 该指标的目的是比较SalesAmnt字段和TargetSaleAmnt字段,以便我们显示目标实现率。
Add the Half-donut component to design layout and change title as “target realization ratio”
将Half-Donut组件添加到设计布局中,并将标题更改为“目标实现率”
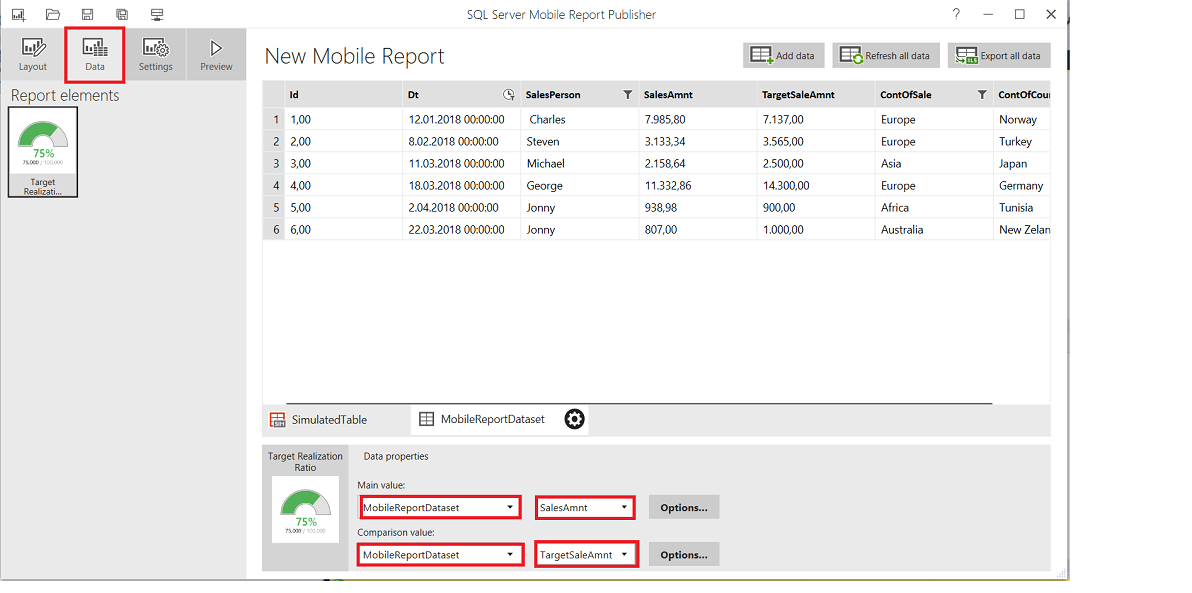
Click the Data tab and change the data properties …
单击数据选项卡,然后更改数据属性…
The last layout of Half-donut will like this …
Half-Donut的最后一个布局将是这样……
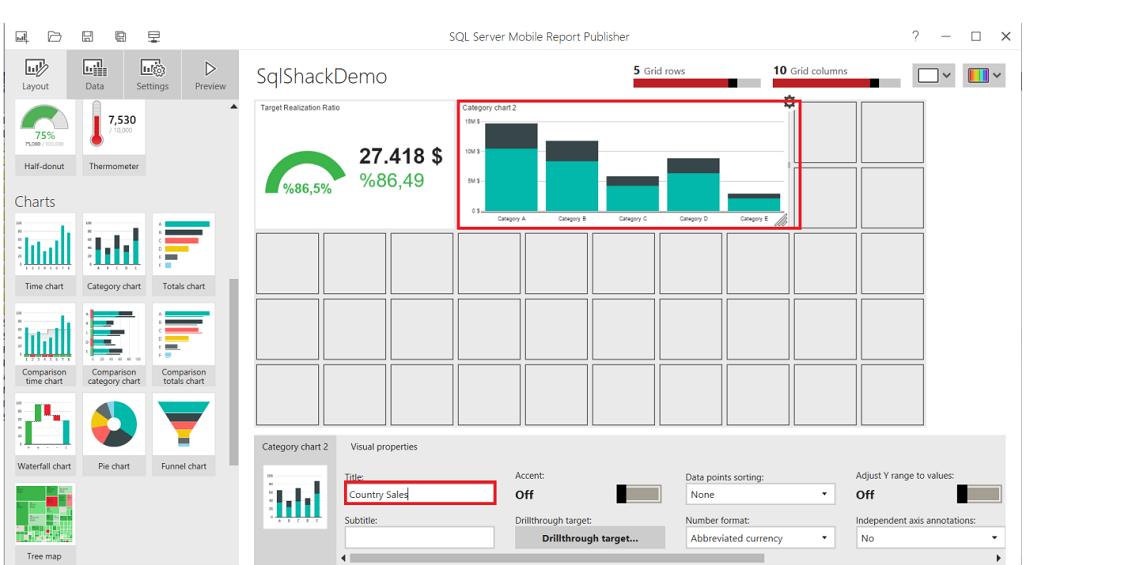
The second component will be a category chart in our mobile report design. This chart will help us to show country sales comparison.
第二部分将是我们的移动报告设计中的类别图。 此图表将帮助我们显示国家/地区销售比较。
Add a Category-chart component to the design layout and change the title to Country Sales.
在设计布局中添加一个类别图组件,并将标题更改为“国家销售”。
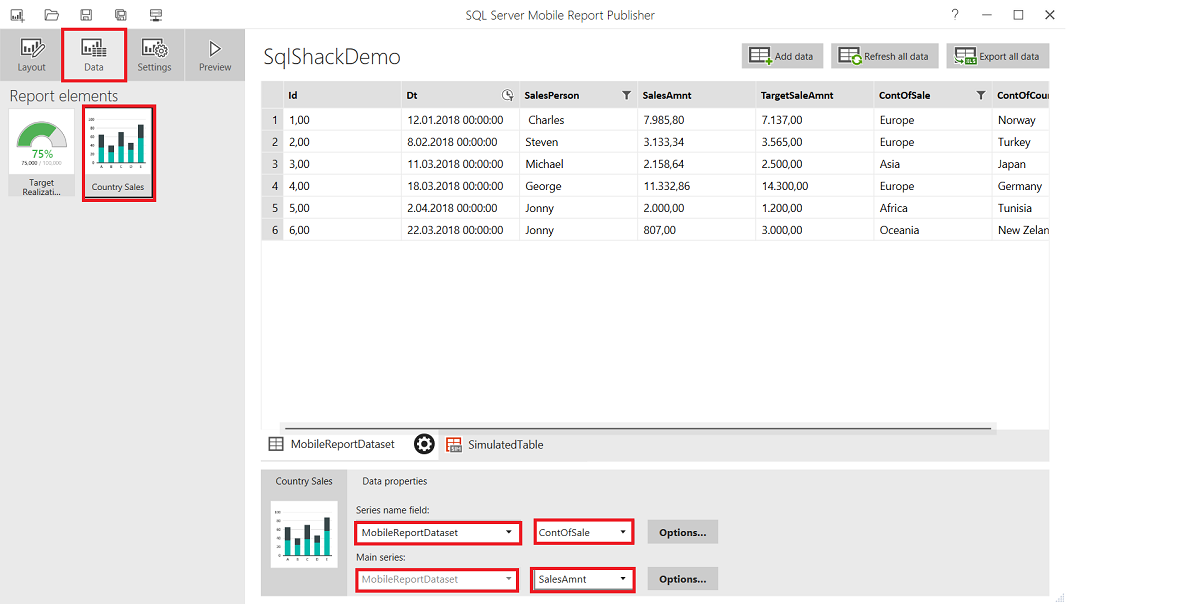
Click the Data tab and change the data properties of the Category Chart.
单击数据选项卡,然后更改类别图表的数据属性。
We will add Comparison totals chart in our mobile report design. This chart will help us to show salesperson target realizations.
我们将在移动报告设计中添加比较总计图表。 此图表将帮助我们显示销售人员的目标实现。
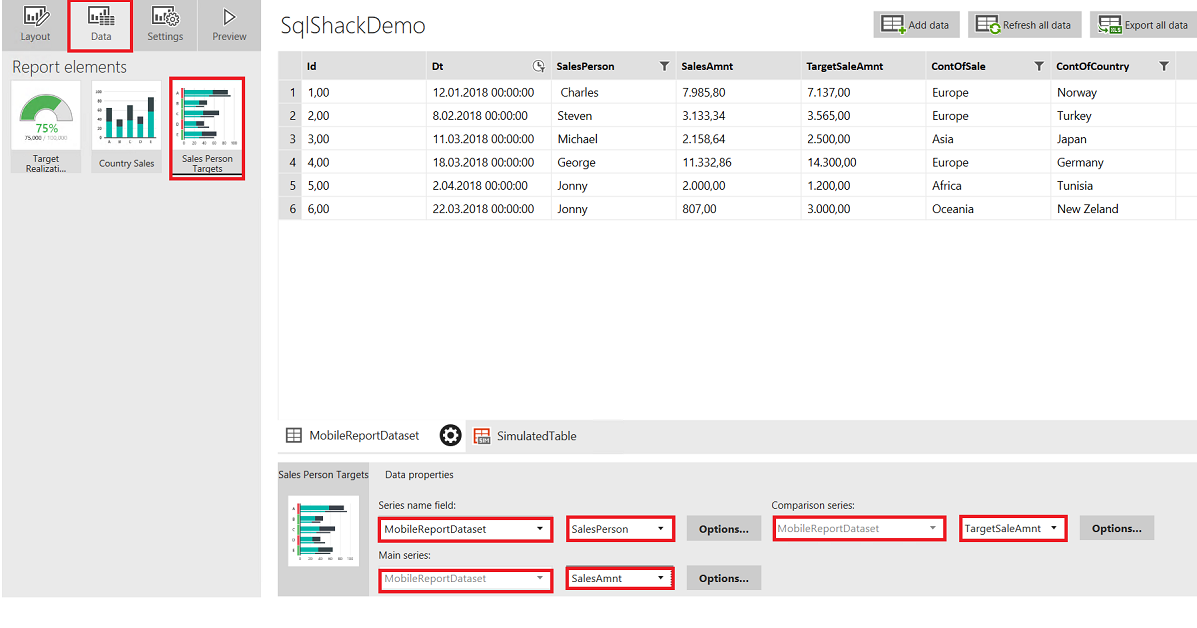
Add the Comparison category chart to design layout and change title to Sales Person Targets.
添加比较类别图表以设计布局,并将标题更改为“销售人员目标”。
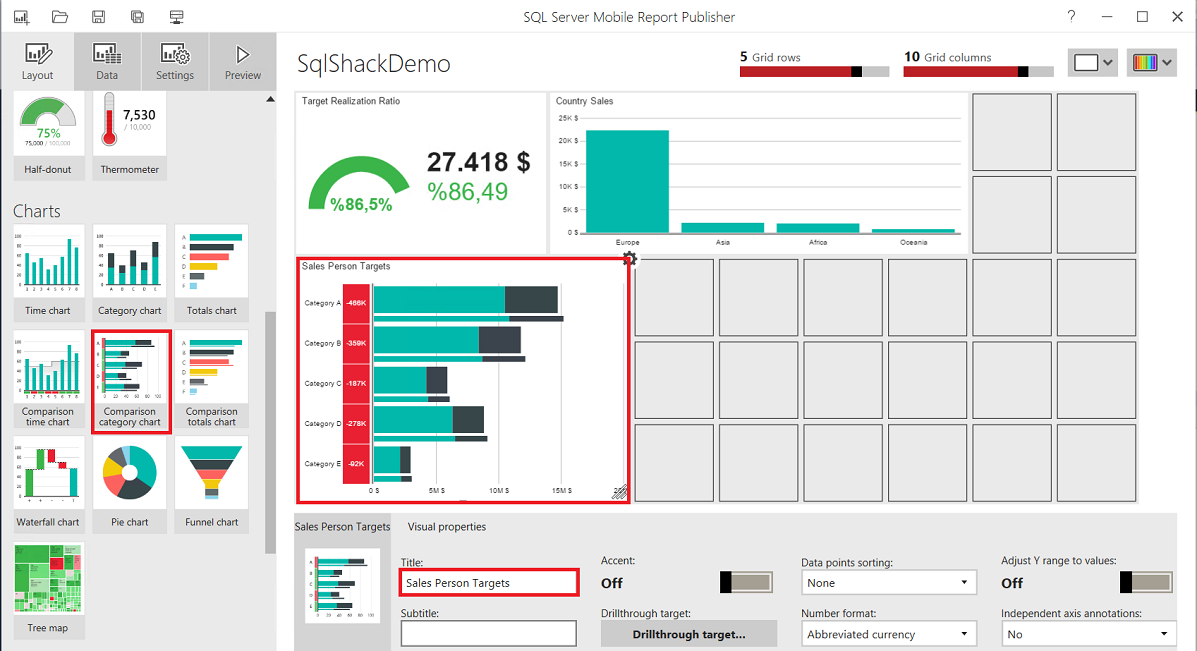
Click the Data tab and change the data properties …
单击数据选项卡,然后更改数据属性…
And the final component is Range stop heat map. The aim of this chart is to show the target realization rate by continent.
最后一个组件是范围停止热图。 该图表的目的是显示按洲划分的目标实现率。
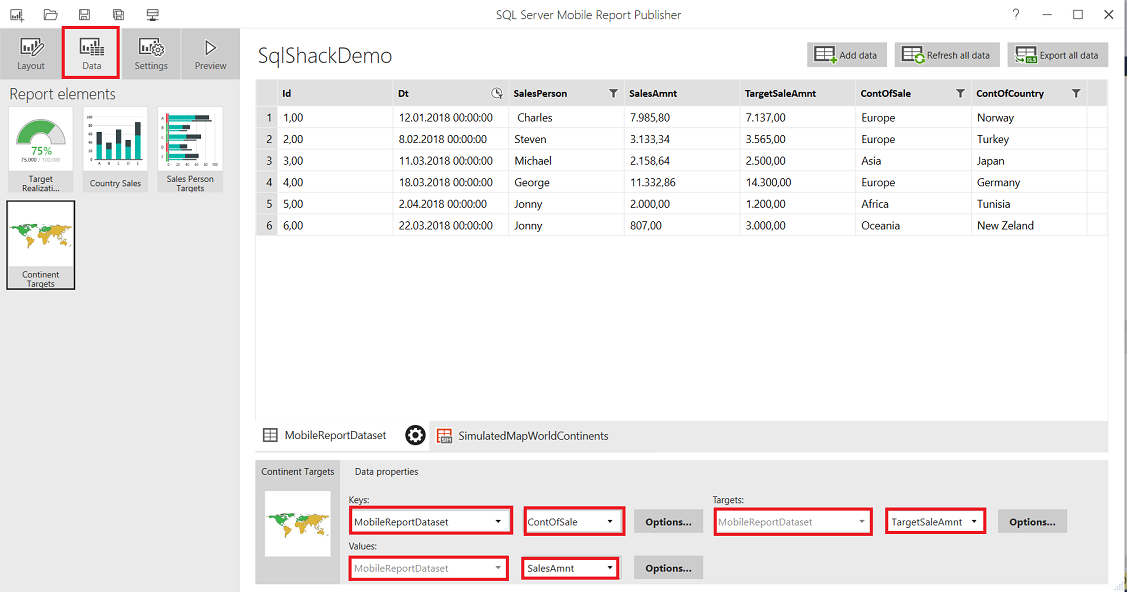
Add the Range stop heat map to design layout and change title to Continent Targets.
将Range Stop热图添加到设计布局中,并将标题更改为Continent Targets。
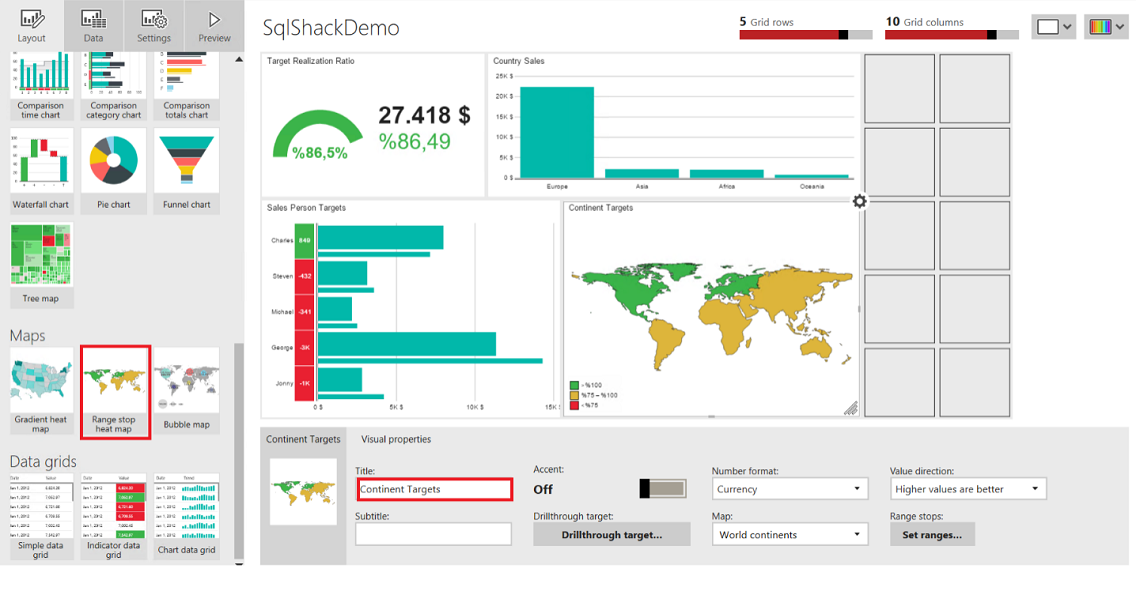
Click Data tab and change the data properties of Range stop heat map …
单击数据选项卡,然后更改范围停止热图的数据属性……
Click the Preview button …
单击预览按钮…
In this step; we will create our design for mobile devices.
在这一步; 我们将为移动设备创建设计。
Change the design layout for Phone and arrange the report elements like this. And click the Preview button.
更改Phone的设计布局,并按如下方式排列报告元素。 然后单击预览按钮。
The final design of our dashboard will look like the bellow image …
我们的仪表板的最终设计看起来像下面的波纹图……
We will click the double floppy disk icon and save it to SSRS web portal …
我们将单击双软盘图标并将其保存到SSRS Web门户……
移动仪表板 (Mobile dashboard)
In this section of article, we will focus on settings of mobile reports in a mobile device. As we mentioned at the beginning of the article; you will find the Power BI mobile app in mobile marketplaces. The following settings cover Android devices after the installation of Power BI – Business data analytics.
在本文的此部分中,我们将重点介绍移动设备中的移动报告的设置。 正如我们在文章开头提到的; 您将在移动市场中找到Power BI移动应用程序。 在安装Power BI –业务数据分析之后,以下设置涵盖了Android设备。
Click Get started and select Report Server in your mobile device.
点击开始使用 ,并在您的移动设备选择报表服务器 。
Connect to the server …
连接到服务器…
Fill the credentials for the report server. Click the Sign In button.
填写报告服务器的凭据。 单击登录按钮。
Click Start Exploring and open the SqlShackDemo dashboard. Finally, our mobile dashboard appears on screen.
单击“ 开始探索”,然后打开SqlShackDemo仪表板。 最后,我们的移动仪表板出现在屏幕上。
When you click both side arrow; the report element appears in full screen.
当您单击两侧箭头时; 报告元素将全屏显示。
When you click the bars or regions; you can get details about this part of the graphic.
当您单击条或区域时; 您可以获取有关图形这一部分的详细信息。
摘要 (Summary)
In this article, we created a very basic mobile dashboard in SQL Server Microsoft Mobile Publisher from end to end. SQL Server Microsoft Mobile Publisher has various, powerful capabilities. With this technology, we can create mobile reports parameters or navigators for mobile reports. In the mobile device, you can refresh report real-time.
在本文中,我们从头到尾在SQL Server Microsoft Mobile Publisher中创建了一个非常基本的移动仪表板。 SQL Server Microsoft Mobile Publisher具有各种强大的功能。 借助这项技术,我们可以为移动报告创建移动报告参数或导航器。 在移动设备中,您可以实时刷新报告。
In some cases, this real-time refresh can cause performance problems. If you think you will face this type of issue in your production environment you can create caching plans for data sources in SSSR web portal. On the other hand, you can analyze your KPI (key performance indicators) in the mobile app.
在某些情况下,这种实时刷新可能会导致性能问题。 如果您认为在生产环境中会遇到此类问题,则可以在SSSR Web门户中为数据源创建缓存计划。 另一方面,您可以在移动应用中分析您的KPI(关键绩效指标)。
But otherwise, happy report building for mobile devices!
但除此之外,为移动设备构建愉快的报告!


 78
78

 被折叠的 条评论
为什么被折叠?
被折叠的 条评论
为什么被折叠?
 到【灌水乐园】发言


