


介绍 (Introduction)
Intended audience
目标听众
This document is intended for database administrators who would like to be prepared or who experience performance issues with one or more Linked Server(s) to an Oracle Database instance using the OraOLEDb Linked Server provider.
本文档适用于希望准备使用OraOLEDb Linked Server提供程序的一个或多个Linked Server到Oracle数据库实例的性能或出现问题的数据库管理员。
Context
语境
Performance issues are part of the life of any DBA. He has to analyze server activity to deduct which queries do not perform well and eventually provide solutions. These solutions could be the creation of one or more indexes, code rewrite, database design review…
性能问题是任何DBA生命的一部分。 他必须分析服务器活动,以推断哪些查询不能很好地执行并最终提供解决方案。 这些解决方案可能是创建一个或多个索引,代码重写,数据库设计审查……
In general, the performance analysis task is done for an isolated server, where batches only run against “local” objects i.e. objects that are inside one or more databases, on the same SQL Server instance.
通常,性能分析任务是在隔离的服务器上完成的,其中批处理仅针对同一SQL Server实例上的“本地”对象(即一个或多个数据库内部的对象)运行。
However, it’s possible to run so-called “distributed queries” using Linked Server server-level objects. Linked Servers are objects allowing SQL Server principals to access data on a remote server. It uses data providers like ODBC or OLEDB.
但是,可以使用Linked Server服务器级对象运行所谓的“分布式查询”。 链接服务器是允许SQL Server主体访问远程服务器上的数据的对象。 它使用ODBC或OLEDB之类的数据提供程序。
These linked server objects can be referred to as “homogeneous” when they are used to connect a SQL Server instance to another SQL Server instance. They can also be referred to as “heterogeneous” when they are used to connect a SQL Server instance to another kind of data providers like Excel or the Active Directory or even another kind of RDBMS like Oracle Database.
这些链接的服务器对象用于将一个SQL Server实例连接到另一个SQL Server实例时,可以称为“同类”。 当它们用于将SQL Server实例连接到另一种数据提供程序(例如Excel或Active Directory)或什至另一种RDBMS(例如Oracle数据库)时,它们也可以称为“异构”。
Obviously, end users can experience performance issues with distributed queries or batches. In this case, particular actions could be taken in order to be able in order to determine if the problem comes from local queries or from remote queries.
显然,最终用户可能会遇到分布式查询或批处理的性能问题。 在这种情况下,可以采取特定措施以便确定问题是来自本地查询还是来自远程查询。
This article will focus on problems with distributed queries to an Oracle Database instance and we will review some actions that could be made to investigate.
本文将重点讨论对Oracle数据库实例的分布式查询所遇到的问题,并且我们将回顾一些可以进行调查的操作。
SQL Server到Oracle数据库的通信体系结构 (SQL Server to Oracle Database communication architecture)
You will find below the path followed by a query run from a SQL Server instance to an Oracle Database instance.
您将在路径后面找到从SQL Server实例到Oracle数据库实例的查询。
There is a way to enable trace at each level or this architecture. We will only review client-side tracing in this article.
有一种方法可以启用每个级别或此体系结构的跟踪。 我们将仅在本文中回顾客户端跟踪。
如何捕获OLEDB活动 (How to capture OLEDB activity)
When running a query
运行查询时
The first way to get back OLEDB errors is by turning on trace flags 7300 and 3604. The way to use it though is:
恢复OLEDB错误的第一种方法是打开跟踪标志7300和3604。不过,使用它的方法是:
DBCC TRACEON(7300,3604);
GO
<Run problematic query>;
GO
DBCC TRACEOFF(7300,3604);
GO
Using SQL Server Profiler (2017)
使用SQL Server Profiler(2017)
The SQL Server Profiler can track some events related to OLEDB activity. These are:
SQL Server Profiler可以跟踪与OLEDB活动有关的一些事件。 这些是:
To get a complete overview of these events, please refer to Microsoft’s documentation page.
要获得这些事件的完整概述,请参考Microsoft的文档页面 。
Here are the steps to follow:
以下是要遵循的步骤:
- Open SQL Server Profiler 打开SQL Server Profiler
- Create a new trace 创建一个新的跟踪
- Connect to the server instance of your choice 连接到您选择的服务器实例
Fill in the General tab information as follows:
填写“常规”选项卡信息,如下所示:
(Set a name, use Blank template and set save to file option. Eventually set a trace stop time)
(设置名称,使用空白模板并设置保存到文件选项。最终设置跟踪停止时间)
- Go to the Event Selection tab 转到事件选择选项卡
Select following events to get a complete overview of user activity:
选择以下事件以获得用户活动的完整概述:
Event Category Event Name Errors and Warnings Error Log
EventLog
Exception
Execution Warnings
User Error MessagesOLEDB All available events Security Audit Audit Login
Audit LogoutStored Procedures RPC:Completed TSQL SQL:BatchCompleted
SQL:BatchStarting活动类别 活动名称 错误和警告 错误记录
事件记录日志
例外
执行警告
用户错误信息OLEDB 所有可用事件 安全审核 审核登录
审核登出存储过程 RPC:已完成 TSQL SQL:批处理完成
SQL:BatchStarting- Eventually and preferably, filter out results so that it traces only what you want. It will help in the results analysis task. 最终,最好是过滤掉结果,以便仅跟踪您想要的结果。 这将有助于结果分析任务。
- Click on the “Run” button on the bottom right of the dialog 点击对话框右下方的“运行”按钮
- Let the profiler run and stop it once you get what you wanted. 获得所需的信息后,让分析器运行并停止它。
If you see any error or return status different from “0” or “0 – OK”, take the time to check them and try to understand what happened.
如果看到任何错误或返回的状态不同于“ 0”或“ 0 – OK”,请花一些时间检查它们并尝试了解发生了什么。
Here is an example output of the trace:
这是跟踪的示例输出:
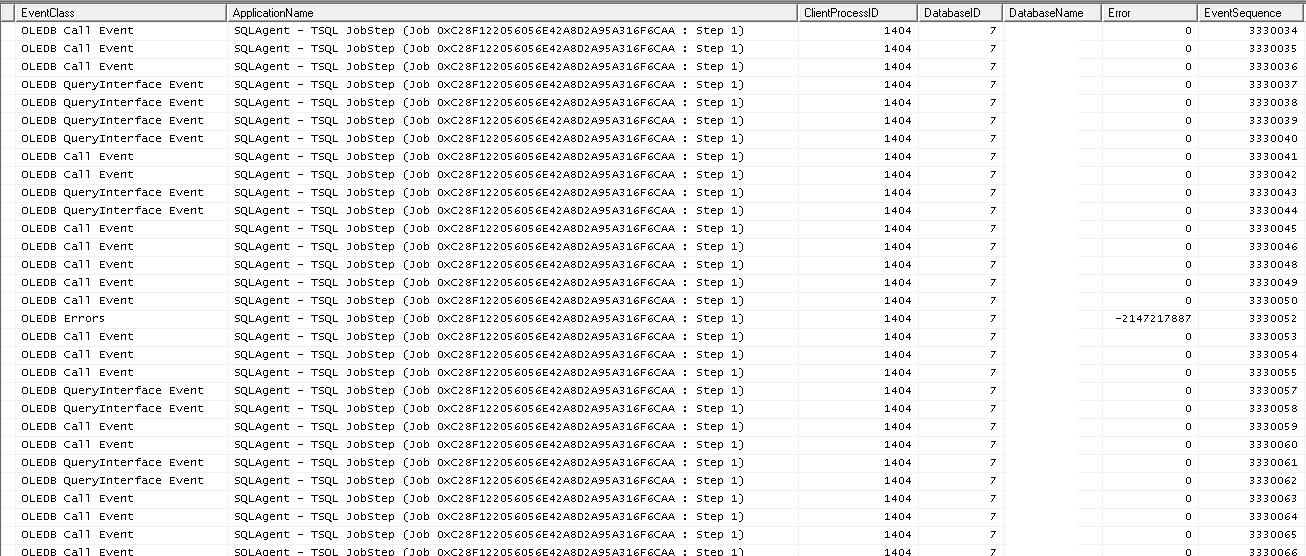
Here, we can see that there is a value in error column different from 0. This error should be investigated.
在这里,我们可以看到错误列中有一个不同于0的值。应研究此错误。
Using Oracle Database Client tracing capabilities
使用Oracle数据库客户端跟踪功能
Oracle Database Client comes with some tracing capabilities. We will review the way to enable and disable them.
Oracle Database Client具有一些跟踪功能。 我们将回顾启用和禁用它们的方法。
First of all, we need to get back following information about the Oracle Database Client installation:
首先,我们需要获取以下有关Oracle Database Client安装的信息:
- The version of the installed client 安装的客户端版本
- %ORACLE_HOME% environment variable. %ORACLE_HOME%环境变量的位置。
For instance: C:\app\oracle\product\12.2.0
例如:C:\ app \ oracle \ product \ 12.2.0
In Windows Explorer, we will go to %ORACLE_HOME%\network folder and create following folders if they don’t exist:
在Windows资源管理器中,我们将转到%ORACLE_HOME%\ network文件夹并创建以下文件夹(如果不存在):
- Log 记录
- Trace 跟踪
Once it’s done, we can go to the %ORACLE_HOME%\network\admin folder. That’s where the Oracle Client takes its configuration files for network communication.
完成后,我们可以转到%ORACLE_HOME%\ network \ admin文件夹。 这是Oracle客户端将其配置文件用于网络通信的地方。
Take a backup of the file called sqlnet.ora if it actually exists. The backed up file name should be sqlnet.traceON.ora . We will work on this file so that we don’t influence production except when we are really willing to run a trace.
如果文件sqlnet.ora实际上存在,请对其进行备份。 备份的文件名应为sqlnet.traceON.ora 。 我们将处理此文件,以免影响生产,除非我们真正愿意进行跟踪。
If sqlnet.ora does not exist, create it and add at least following line then copy it to sqlnet.traceON.ora:
如果sqlnet.ora不存在,请创建它并至少添加以下行,然后将其复制到sqlnet.traceON.ora :
SQLNET.AUTHENTICATION_SERVICES = (NTS)
Now, we are ready to add tracing parameters. Append following content to the sqlnet.traceoON.ora file:
现在,我们准备添加跟踪参数。 将以下内容添加到sqlnet.traceoON.ora文件 :
# /***********************
#  * Client-side Tracing:
#  */

TRACE_LEVEL_CLIENT      = 16
TRACE_FILE_CLIENT       = sqlnet_client.trc
TRACE_DIRECTORY_CLIENT  = C:\app\oracle\product\12.2.0\client_1\network\trace
TRACE_UNIQUE_CLIENT     = ON
TRACE_TIMESTAMP_CLIENT  = ON

LOG_DIRECTORY_CLIENT    = C:\app\oracle\product\12.2.0\client_1\network\log
LOG_FILE_CLIENT         = sqlnet_client.log

TNSPING.TRACE_DIRECTORY = C:\app\oracle\product\12.2.0\client_1\network\trace
TNSPING.TRACE_LEVEL     = ADMIN

DIAG_ADR_ENABLED        = OFF
ADR_BASE                = c:\app\oracle
Save and exit sqlnet.traceON.ora file.
保存并退出sqlnet.traceON.ora文件。
Now, we need a mechanism to set tracing on and off. Let’s write a Powershell script called “Set-OracleClientTrace” that will take 2 parameters:
现在,我们需要一种启用和禁用跟踪的机制。 让我们编写一个名为“ Set-OracleClientTrace”的Powershell脚本,它将使用2个参数:
- $OracleHome: the path in which we will find the “network” folder. $ OracleHome:我们将在其中找到“网络”文件夹的路径。
- $TraceStatus: can be ON or OFF. $ TraceStatus:可以打开或关闭。
Here is the code of this script:
这是此脚本的代码:
param (
    [cmdletbinding()]
    [parameter(ValueFromPipeline = $false, ValueFromPipelineByPropertyName = $true, Mandatory = $True)]
    [ValidateScript({Test-Path $_ -PathType Container})]
    [string]$OracleHome,
    [parameter(ValueFromPipeline = $false, ValueFromPipelineByPropertyName = $true, Mandatory = $True)]
    [ValidateSet("on","off")]
    [string]$TraceStatus
)
#ensure UTF-8 encoding is used for all I/O interfaces
$PSDefaultParameterValues = @{ '*:Encoding' = 'utf8' }

Write-Output "Setting Oracle Client Tracing features to $TraceStatus"

$NetworkBasePath    = Join-Path $OracleHome "network"
$TnsAdminPath       = Join-Path $NetworkBasePath "admin"
$SqlNetOraTracing   = Join-Path $TnsAdminPath "sqlnet.traceON.ora"

if(-Not (Test-Path $NetworkBasePath -PathType Container)) {
    throw "no network folder found in $OracleHome"
}

if(-Not (Test-Path $TnsAdminPath -PathType Container)) {
    throw "No TNS ADMIN folder"
}
if(-Not (Test-Path $SqlNetOraTracing -PathType Leaf)) {
    throw "No 'sqlnet.traceON.ora' file with tracing information"
}

$SqlNetOraFile      = Join-Path $TnsAdminPath "sqlnet.ora"
$SqlNetOraBkp       = "$SqlNetOraFile.bkp"

# Create SqlNet.ora if not exists
if(-Not (Test-Path $SqlNetOraFile -PathType Leaf)) {
    Write-Output "Creating sqlnet.ora file"
    "SQLNET.AUTHENTICATION_SERVICES = (NTS)" | Out-File $SqlNetOraFile
}

if($TraceStatus -eq "ON") {
    $TraceLogPath           = Join-Path $NetworkBasePath "log"
    $TraceFilesFolderPath   = Join-Path $NetworkBasePath "trace"

    Write-Output "Creating log and trace folders if needed"

    New-Item $TraceLogPath -ItemType Directory -Force | Out-Null
    New-Item $TraceFilesFolderPath -ItemType Directory -Force | Out-Null

    if(Test-Path $SqlNetOraBkp -PathType Leaf) {
        # ensure we are not running twice the script with status ON

        $md5                = New-Object -TypeName System.Security.Cryptography.MD5CryptoServiceProvider

        $BackedUpFileHash   = [System.BitConverter]::ToString($md5.ComputeHash([System.IO.File]::ReadAllBytes($SqlNetOraBkp)))
        $TraceONFileHash    = [System.BitConverter]::ToString($md5.ComputeHash([System.IO.File]::ReadAllBytes($SqlNetOraTracing)))

        if($BackedUpFileHash -ne $TraceONFileHash) {
            Write-Output "Removing previous backup file"
            Remove-Item $SqlNetOraBkp | Out-Null
        }
        else {
            throw "Tracing is already enabled"
        }
    }

    Move-Item $SqlNetOraFile -Destination $SqlNetOraBkp
    Copy-Item $SqlNetOraTracing -Destination $SqlNetOraFile

    Write-Output "Tracing is now enabled"

}
else {
    if(Test-Path $SqlNetOraBkp -PathType Leaf) {
        Move-Item $SqlNetOraBkp -Destination $SqlNetOraFile -Force

        Write-Output "Backed up configuration restored"
    }
    else {
        throw "No configuration file backup found"
    }
}
In order to get this trace work as expected, we have a few sets of operations to perform:
为了使此跟踪工作按预期进行,我们需要执行几组操作:
- sqlnet.traceON.ora files to the appropriate folder on server we want to trace sqlnet.traceON.ora文件都复制到我们要跟踪的服务器上的相应文件夹中
- Edit the second one according to server installation (basically, changelog and trace destinations) 根据服务器安装(基本上是更改日志和跟踪目标)编辑第二个
- Set-OracleClientTrace with TraceStatus的TraceStatus to Set-OracleClientTrace到ON ON
- Restart SQL Server instance 重新启动SQL Server实例
- Perform the test 执行测试
Run Set-OracleClientTrace Powershell script with TraceStatus parameter set to OFF Note:
将 TraceStatus参数设置为OFF运行Set-OracleClientTrace Powershell脚本注意 :
You might need to run following command:
您可能需要运行以下命令:
Set-ExecutionPolicy ByPass –Scope Process- Restart SQL Server instance 重新启动SQL Server实例
- resource should help. 资源应有所帮助。
As an example, please, you will find below a sample of a real trace file.
例如,请在下面找到真实跟踪文件的示例。
It starts with a summary of trace configuration.
它从跟踪配置摘要开始。
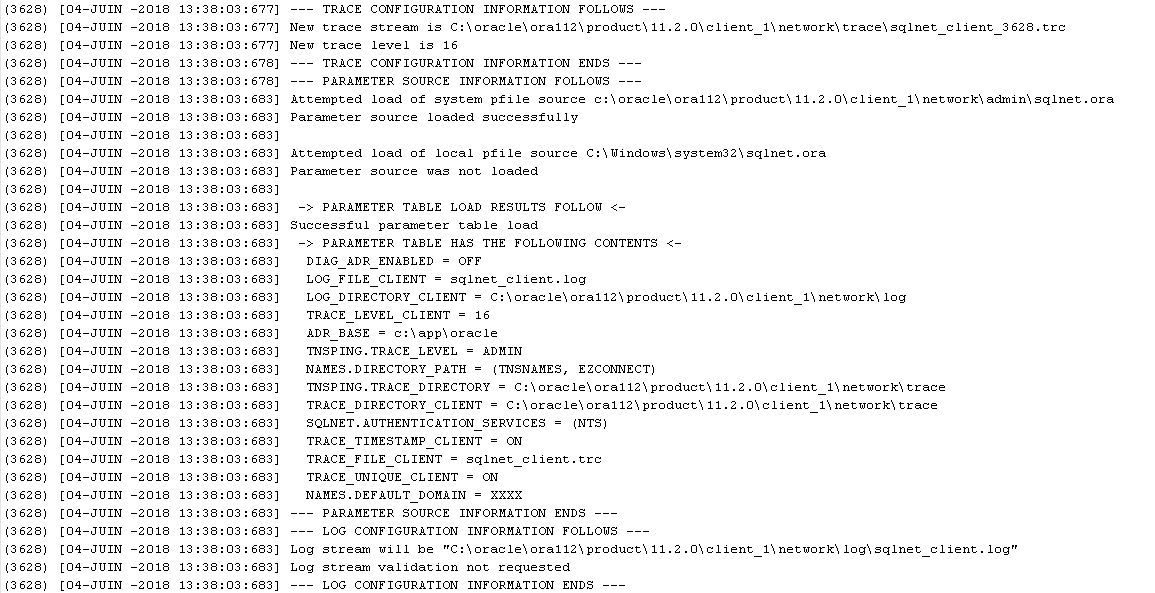
It’s followed by the name resolution for providing for a TNS entry “DB2.XXX”:
紧随其后的是用于提供TNS条目“ DB2.XXX”的名称解析:
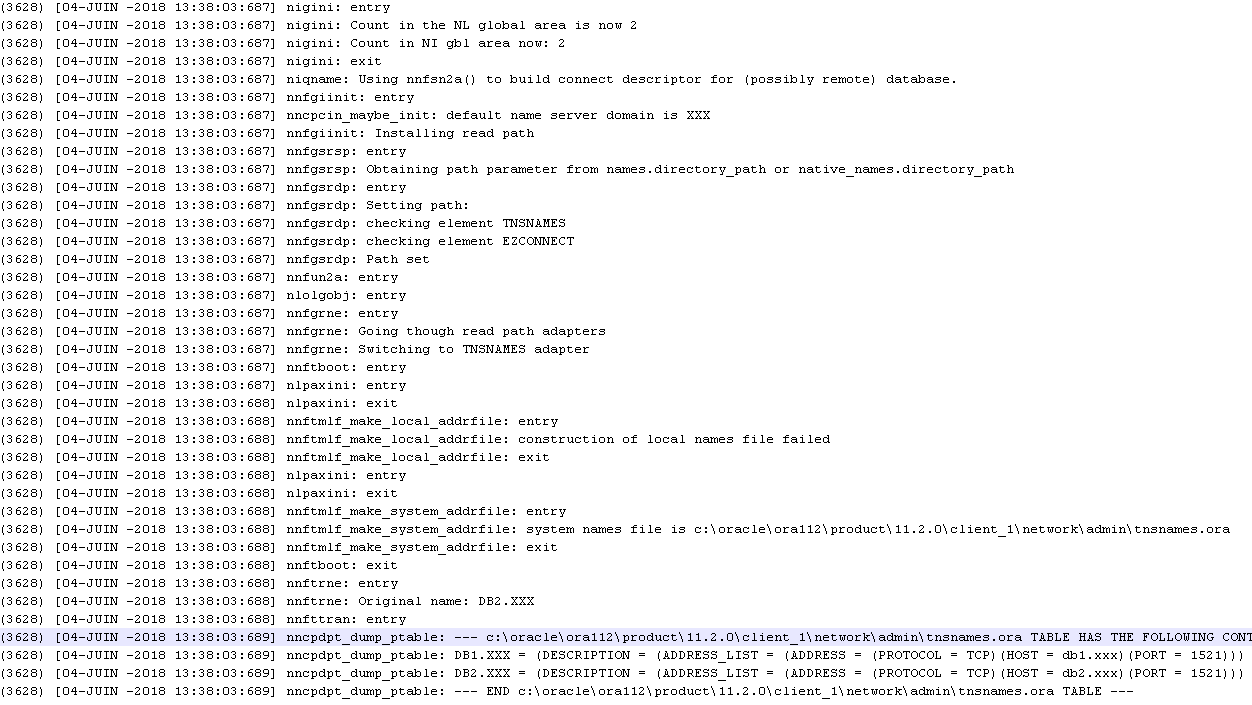
And here is an example of normal communication:
这是正常通信的示例:
Using OLEDB provider’s tracing capabilities
使用OLEDB提供商的跟踪功能
According to Oracle’s documentation page on OLEDB, there is a way to keep track of all calls to OLEDB interface.
根据Oracle 在OLEDB上的文档页面 ,有一种方法可以跟踪对OLEDB接口的所有调用。
To do so, we need to open regedit.exe and find following registry key:
为此,我们需要打开regedit.exe并找到以下注册表项:
HKLM\SOFTWARE\ORACLE\KEY_<ORACLE_HOME>\OLEDB
Here are the attributes that could be modified in order to generate a trace:
以下是可以修改以生成跟踪的属性:
| Key Name | Description |
| TraceFileName | Name of the file that will be used for logging trace information. NB: if TraceOption parameter is set 1, then the thread identifier will be appended to the value for TraceFileName parameter |
| TraceCategory | Specifies the information that is to be traced. Valid Values: 0 = None 1 = OLEDB Interface method entry 2 = OLEDB Interface method exit 4 = Distributed Transaction Enlistment and Delistment We can add the above values between them to combine tracing categories. For instance, a value of 3 means that all the OLEDB interface method entries and exits will be traced. |
| TraceLevel | Specifies the OLE DB objects to be traced. This option will provide limits to tracing capabilities by limiting to a single or multiple OLEDB objects, so that the trace will contain only the data necessary to achieve the tracing goal. Valid Values: 0 = None 1 = Data Source object 2 = Session object 4 = Command object 8 = Rowset object 16 = Error object 64 = Multiple Results Object |
| TraceOption | If this option is set to 0, all traced activity will be stored in a single trace file. If this option is set to 1 then one file per Thread will be created. |
| 键名 | 描述 |
| TraceFileName | 将用于记录跟踪信息的文件的名称。 注意:如果TraceOption参数设置为1,则线程标识符将附加到TraceFileName参数的值 |
| 跟踪类别 | 指定要跟踪的信息。 有效值: 0 =无 1 = OLEDB接口方法条目 2 = OLEDB接口方法退出 4 =分布式交易登记和退市 我们可以在它们之间添加以上值以组合跟踪类别。 例如,值3表示将跟踪所有OLEDB接口方法的入口和出口。 |
| 跟踪级别 | 指定要跟踪的OLE DB对象。 通过限制单个或多个OLEDB对象,此选项将提供对跟踪功能的限制,以便跟踪将仅包含实现跟踪目标所需的数据。 有效值: 0 =无 1 =数据源对象 2 =会话对象 4 =命令对象 8 =行集对象 16 =错误对象 64 =多个结果对象 |
| 跟踪选项 | 如果此选项设置为0,则所有跟踪的活动将存储在单个跟踪文件中。 如果此选项设置为1,则每个线程将创建一个文件。 |
To get a full trace, we can set registry values as follows:
为了获得完整的跟踪,我们可以如下设置注册表值:
- OraOLEDB Traces\OraOLEDB.trc OraOLEDB跟踪\ OraOLEDB.trc
- TraceCategory = 7 TraceCategory = 7
- TraceLevel = 95 跟踪级别= 95
- TraceOption = 1 TraceOption = 1
Note:
注意事项 :
- To be sure this will work as expected, create all the directories implied in the value set for TraceFileName. In this case, we should create the OraOLEDBTraces folder under C:\. 为确保这将按预期工作,请创建TraceFileName的值集中所隐含的所有目录。 在这种情况下,我们应该在C:\下创建OraOLEDBTraces文件夹。
As soon as the test is completed, don’t forget to turn off tracing by setting following registry values to 0:
测试完成后,请不要忘记通过将以下注册表值设置为0来关闭跟踪:
- TraceCategory 跟踪类别
- TraceLevel 跟踪级别
Unfortunately, I haven’t been able to generate a trace file with this method.
不幸的是,我无法使用这种方法生成跟踪文件。
摘要 (Summary)
We’ve seen that there are multiple ways to track communication activity generated by distributed queries. Some of them can be made without server restart, some other can’t.
我们已经看到有多种方法来跟踪由分布式查询生成的通信活动。 其中一些可以在不重新启动服务器的情况下完成,而另一些则不能。
Nevertheless, I would like to pinpoint that this article did not have the pretention to be exhaustive and list all the existing methods. Feel free to comment this article with your feedback or any other method.
不过,我想指出的是,本文并不具有穷举性,而是列出了所有现有方法。 随时用您的反馈或任何其他方法评论本文。
参考资料 (References)
- Sqlnet tracing during nightly hours… 每晚都有Sqlnet跟踪…
- Oracle client trace Oracle客户端跟踪
- Provider-Specific Information 提供商特定信息
- Social MSDN: OraOLEDB.Oracle Linked Server 社交MSDN:OraOLEDB.Oracle链接服务器
- Error message when you execute a linked server query in SQL Server: “Timeout Expired” 在SQL Server中执行链接服务器查询时出现错误消息:“超时已过期”
- Emigar Wiki – Oracle client trace Emigar Wiki – Oracle客户端跟踪


 7710
7710

 被折叠的 条评论
为什么被折叠?
被折叠的 条评论
为什么被折叠?
 到【灌水乐园】发言


