


介绍 ( Introduction )
A few years back, a client asked me to implement a quick and dirty “security mechanism” to control what data the myriad of users were able to view within their reports. There were numerous tables with multiple columns and all departments (within the enterprise) had their data within these tables.
几年前,一位客户要求我实施一种快速而肮脏的“安全机制”,以控制无数用户能够在其报告中查看哪些数据。 有许多具有多列的表,并且所有部门(企业内部)的数据都在这些表中。
SQLShack Industries has tasked us with creating a similar quick and dirty “security mechanism”. We shall attack this challenge by creating the necessary stored procedures (to extract the required data) and then utilize these stored procedures to render and consume the data within our reports.
SQLShack Industries已责成我们创建类似的快速而肮脏的“安全机制”。 我们将通过创建必要的存储过程(以提取所需的数据),然后利用这些存储过程来呈现和使用报告中的数据来应对这一挑战。
入门 ( Getting started )
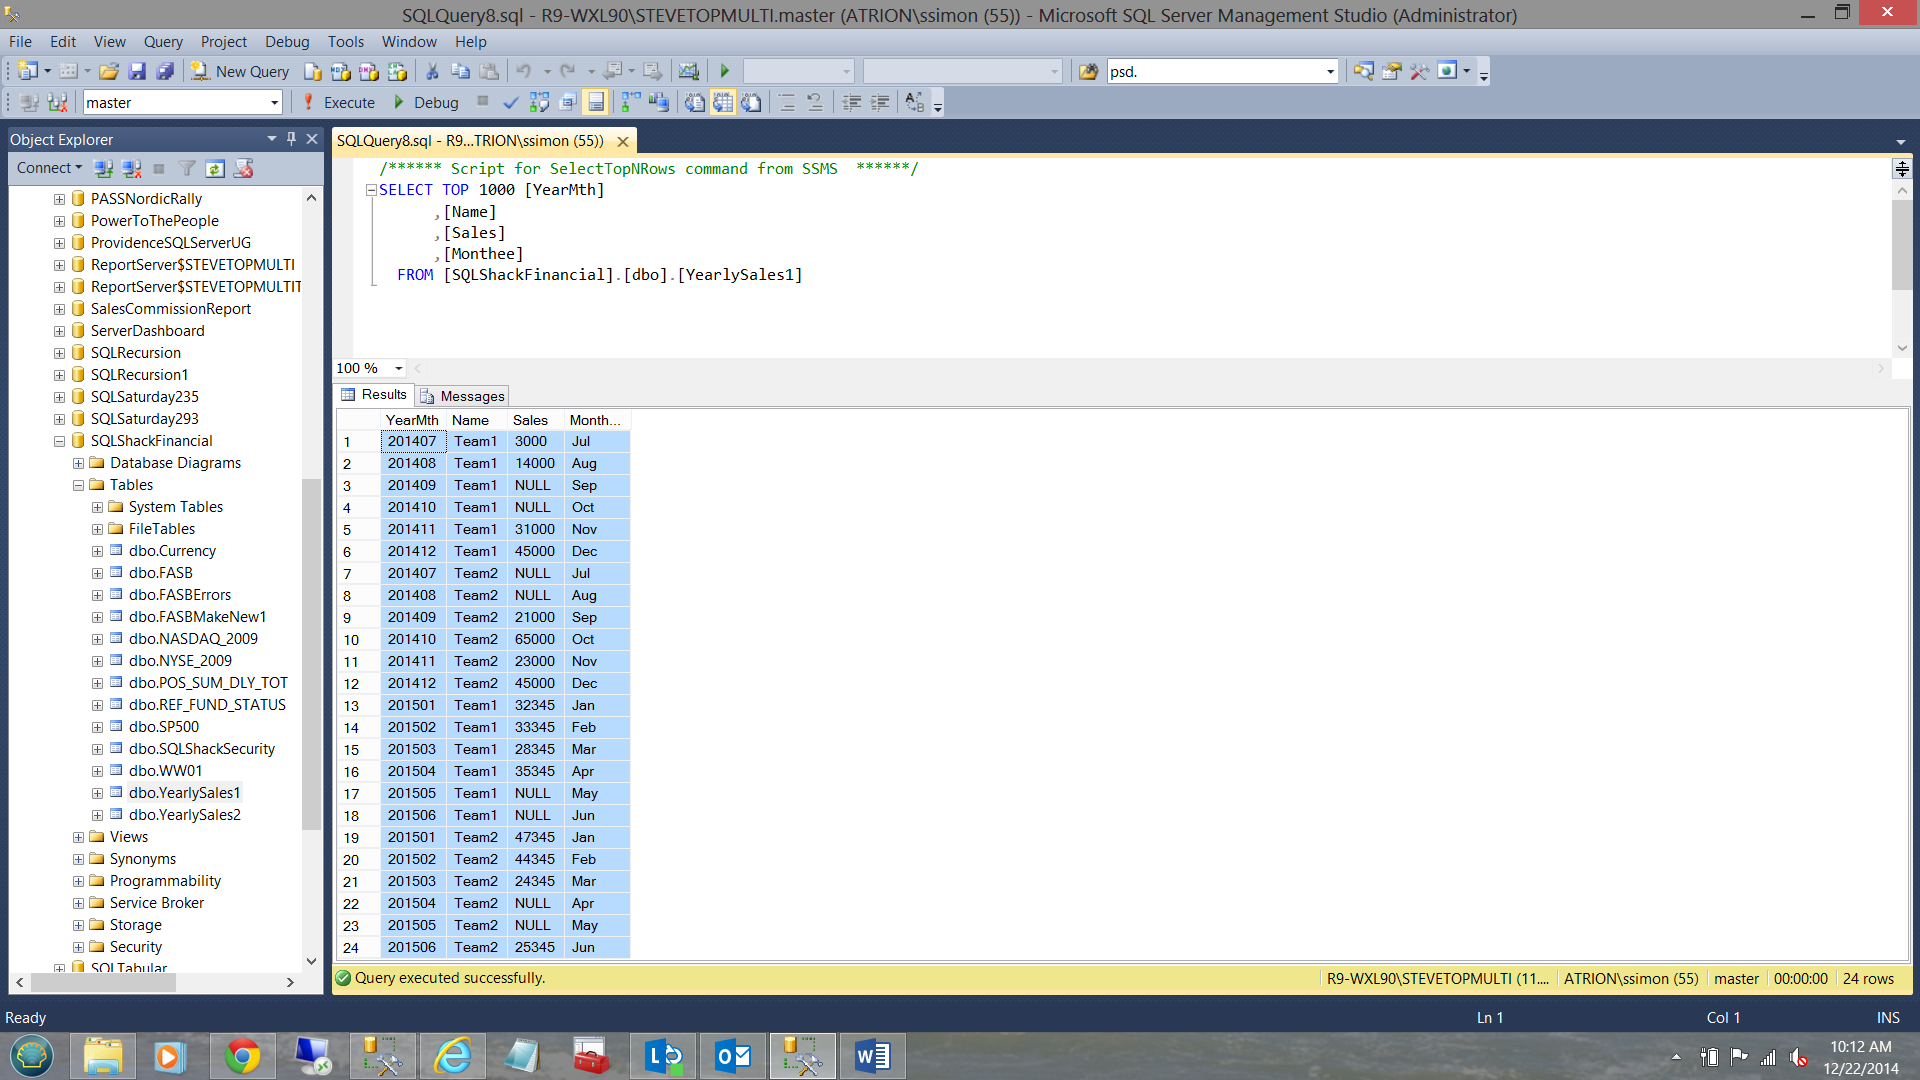
Opening SQL Server Management Studio we find our ‘YearlySales1’ table. This table contains the total monthly sales figures for two sales teams (Team1 and Team2). For the first portion of this exercise Team1 is ONLY permitted to view THEIR OWN data and Team2 THEIR OWN data.
打开SQL Server Management Studio,我们找到“ YearlySales1”表。 该表包含两个销售团队(Team1和Team2)的每月总销售数字。 在本练习的第一部分中,仅允许Team1查看其所有者数据和Team2其所有者数据。
The raw data maybe seen below:
原始数据如下所示:
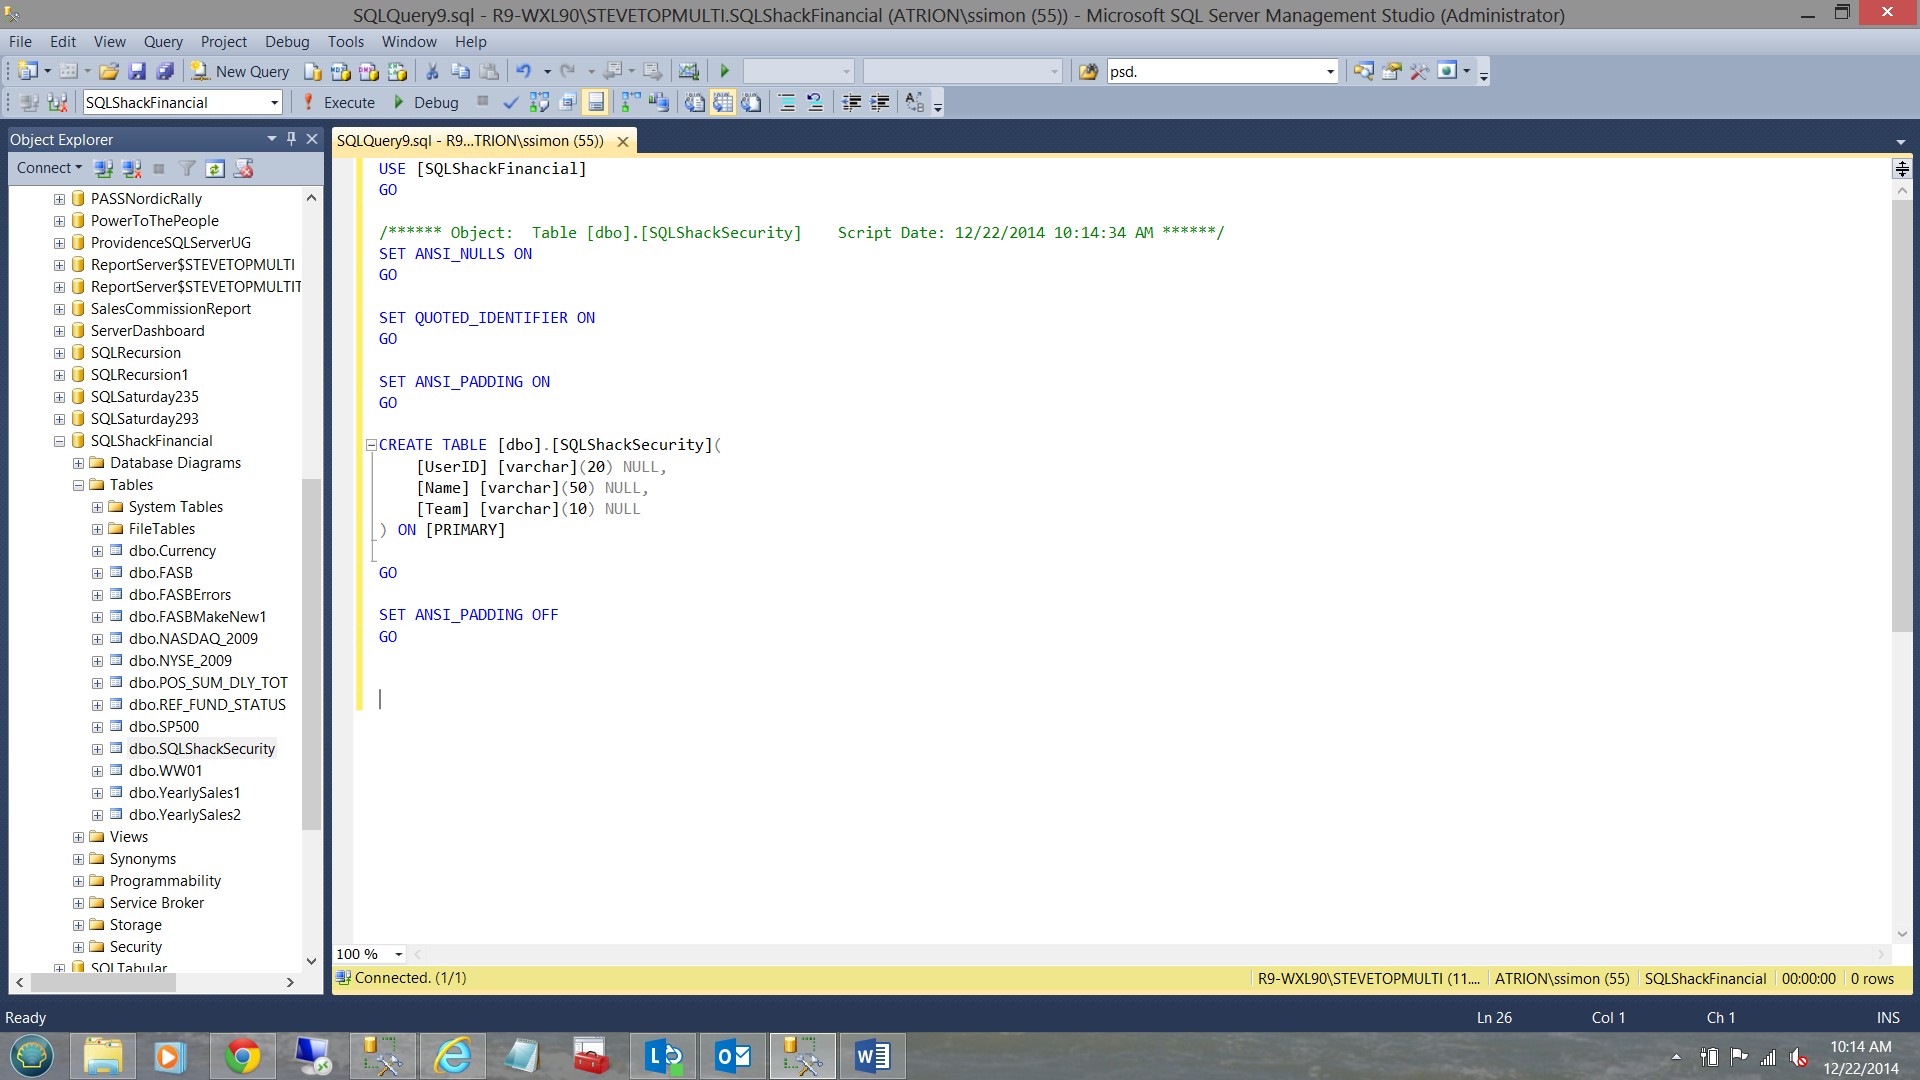
Our first task is to construct a small security table called “SQLShackSecurity” (see below).
我们的首要任务是构造一个小的安全表,称为“ SQLShackSecurity”(请参见下文)。
The client has two department heads and both head major corporate teams (see below).
客户有两个部门负责人和两个主要公司团队负责人(见下文)。
Now that our infrastructure has been created, we are ready to create the necessary stored procedures to service the corporate reports.
现在我们的基础架构已经创建,我们准备创建必要的存储过程来为公司报告提供服务。
Going forward we shall be working with a Reporting Services system variable User!UserID and it is the value of this variable that will be passed to the stored procedure from the report body. This variable is the key component to ensuring that the pieces fit together and function correctly (see ADDENDA B).
展望未来,我们将使用Reporting Services系统变量User !UserID ,正是该变量的值将从报表主体传递到存储过程。 此变量是确保各个部件装配在一起并正常运行的关键组件(请参阅ADDENDA B)。
User!UserID contains the Domain and user ID of the individual requesting access to the data.
User!UserID包含请求访问数据的个人的域和用户ID。
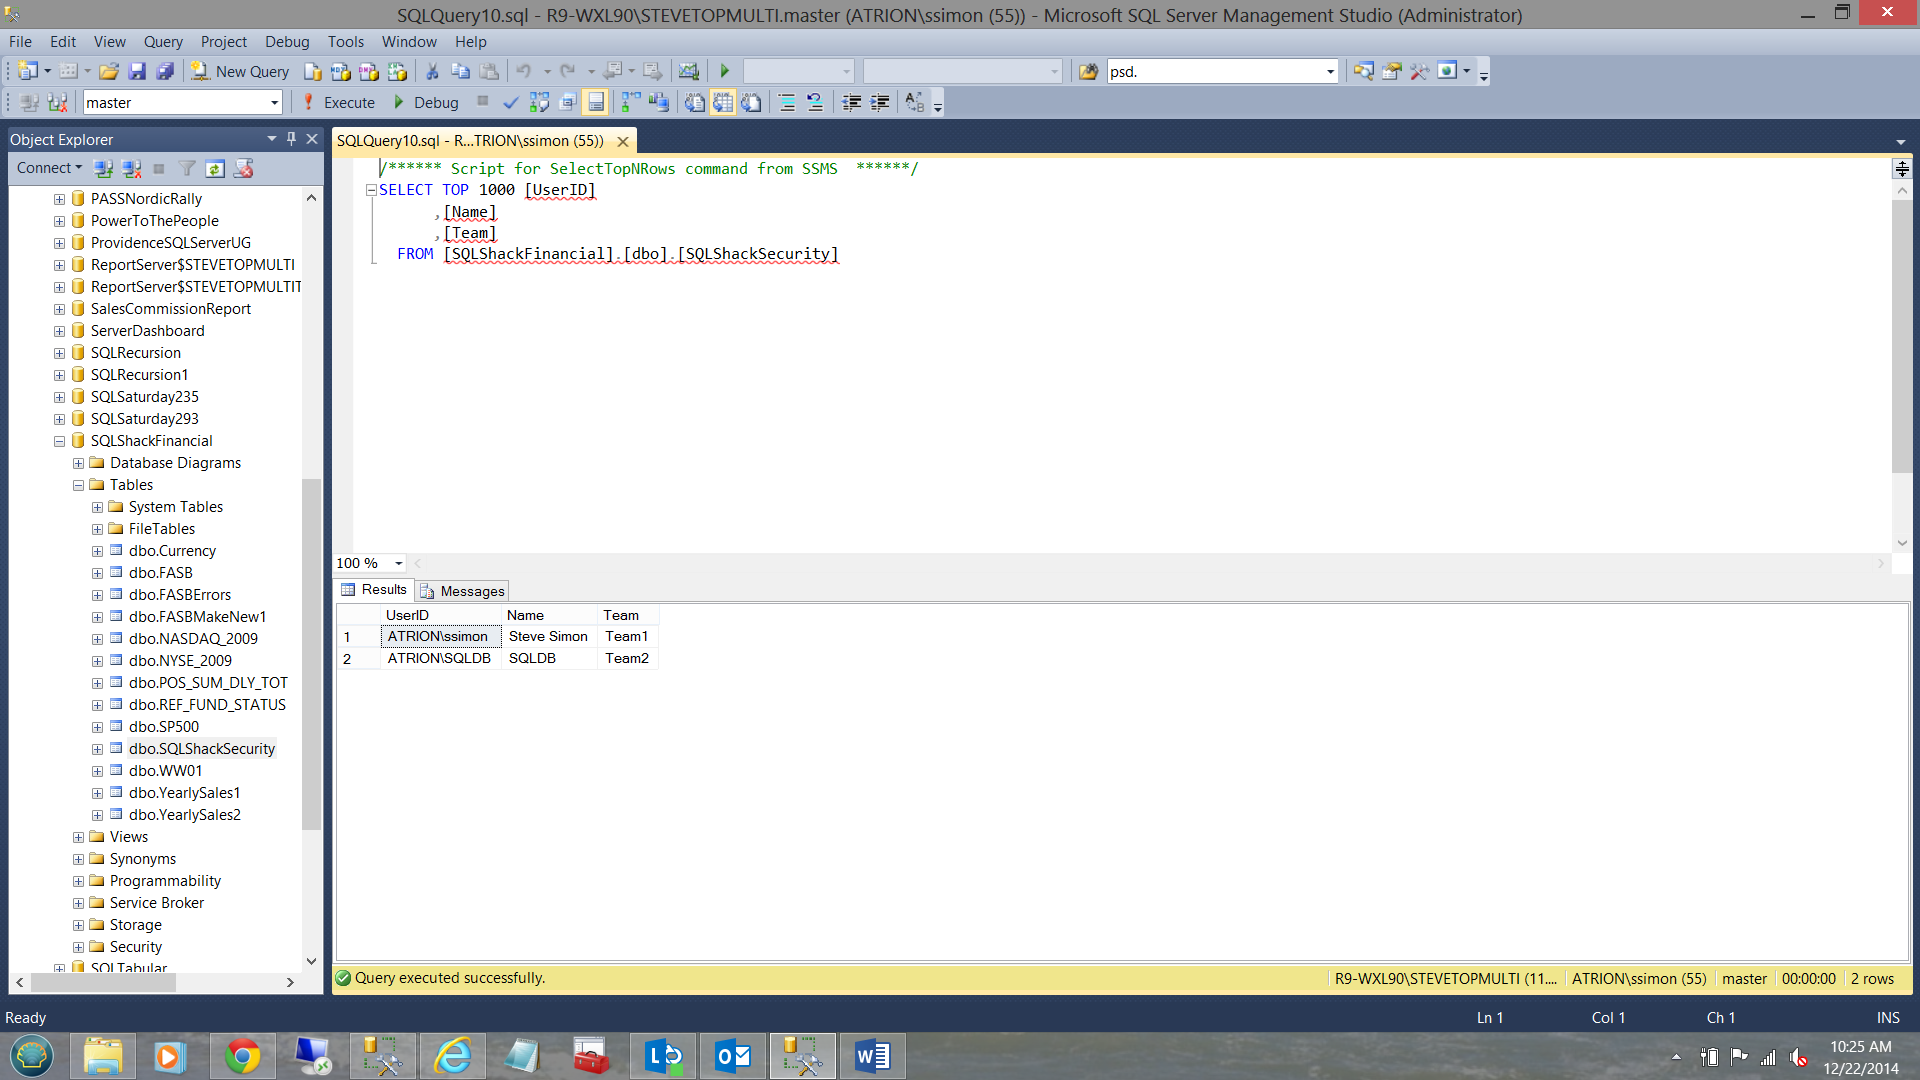
Let us have a quick look at the contents of the security table.
让我们快速看一下安全性表的内容。

We note that there are two main users. User “ATRION\ssimon” is entitled to the Team 1 data and user “ATRION\SQLDB” is entitled to view only the Team2 data.
我们注意到有两个主要用户。 用户“ ATRION \ ssimon”有权使用团队1数据,而用户“ ATRION \ SQLDB”则只能查看Team2数据。
构建我们的存储过程 ( Constructing our stored procedures )
Having created the necessary infrastructure, let us look at a small query which is going to return the required data to the appropriate teams.
创建了必要的基础结构之后,我们来看一个小的查询,该查询将把所需的数据返回给适当的团队。
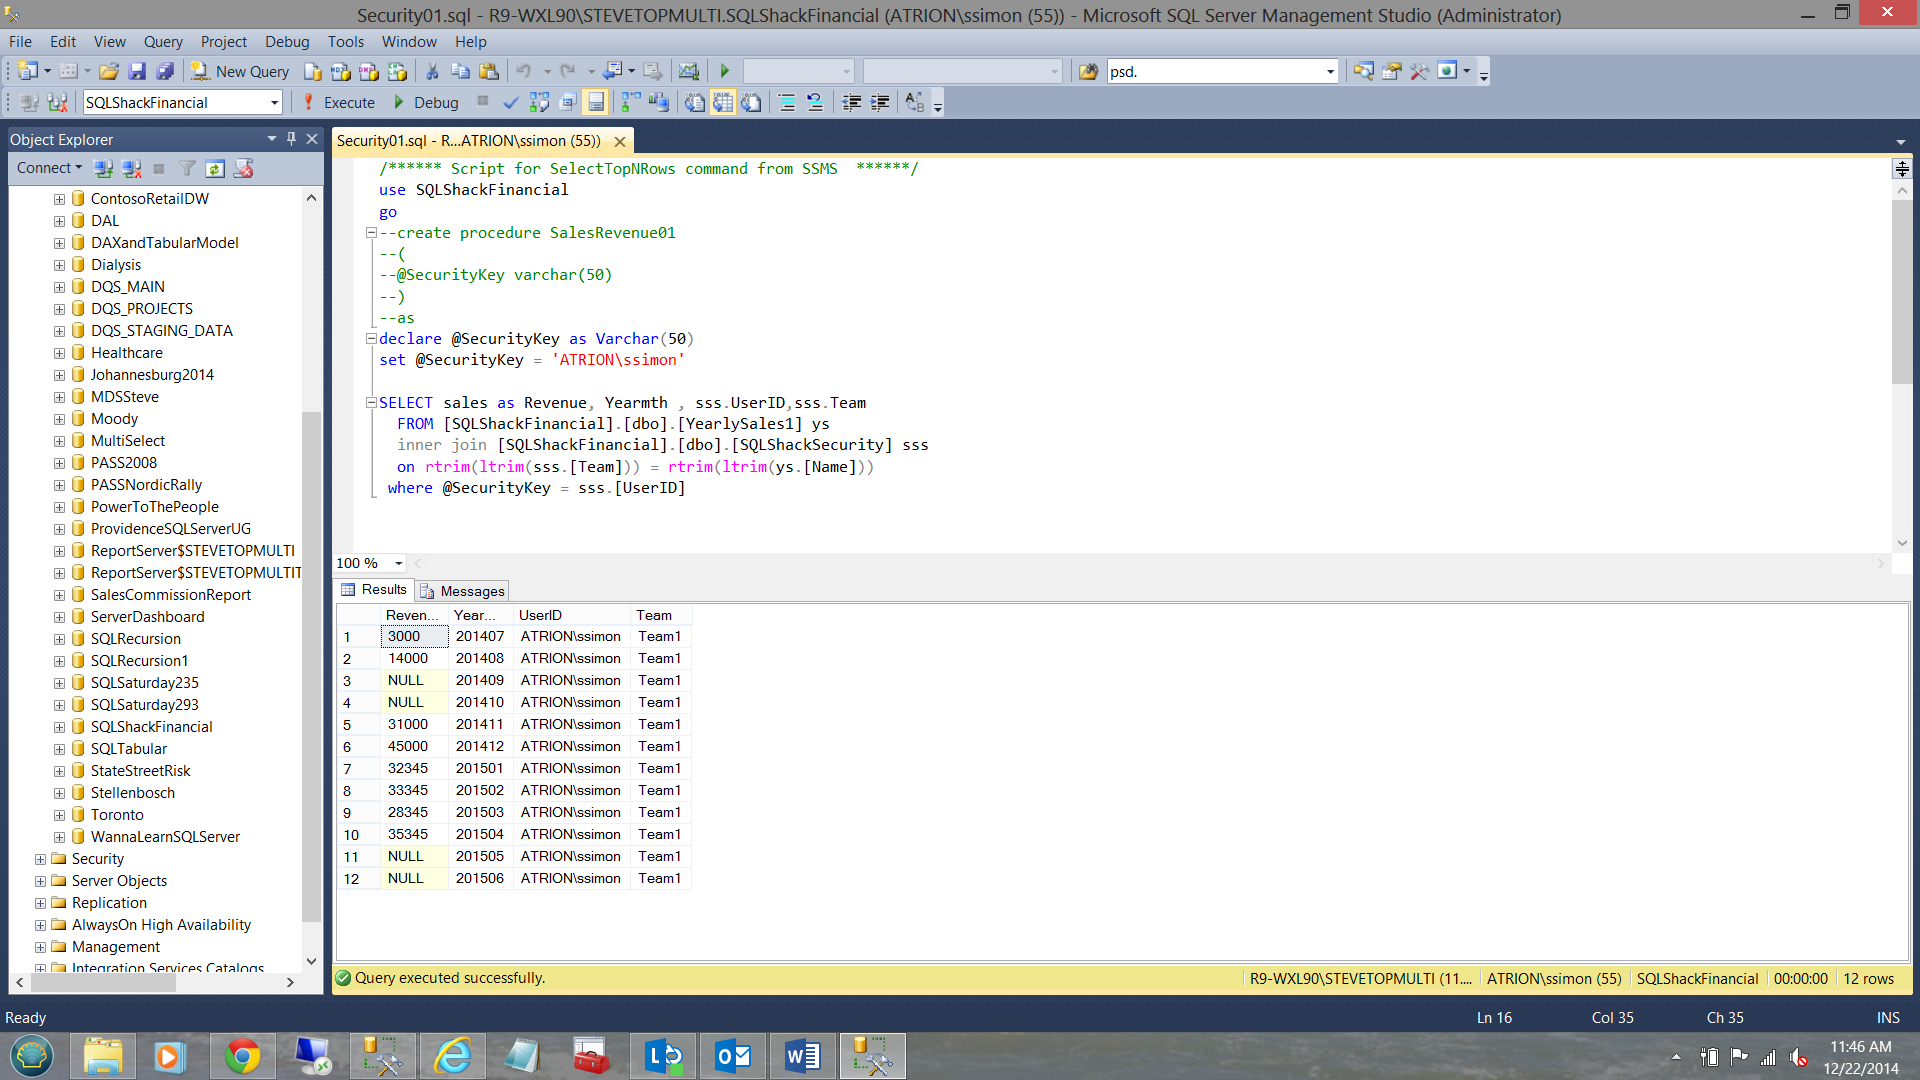
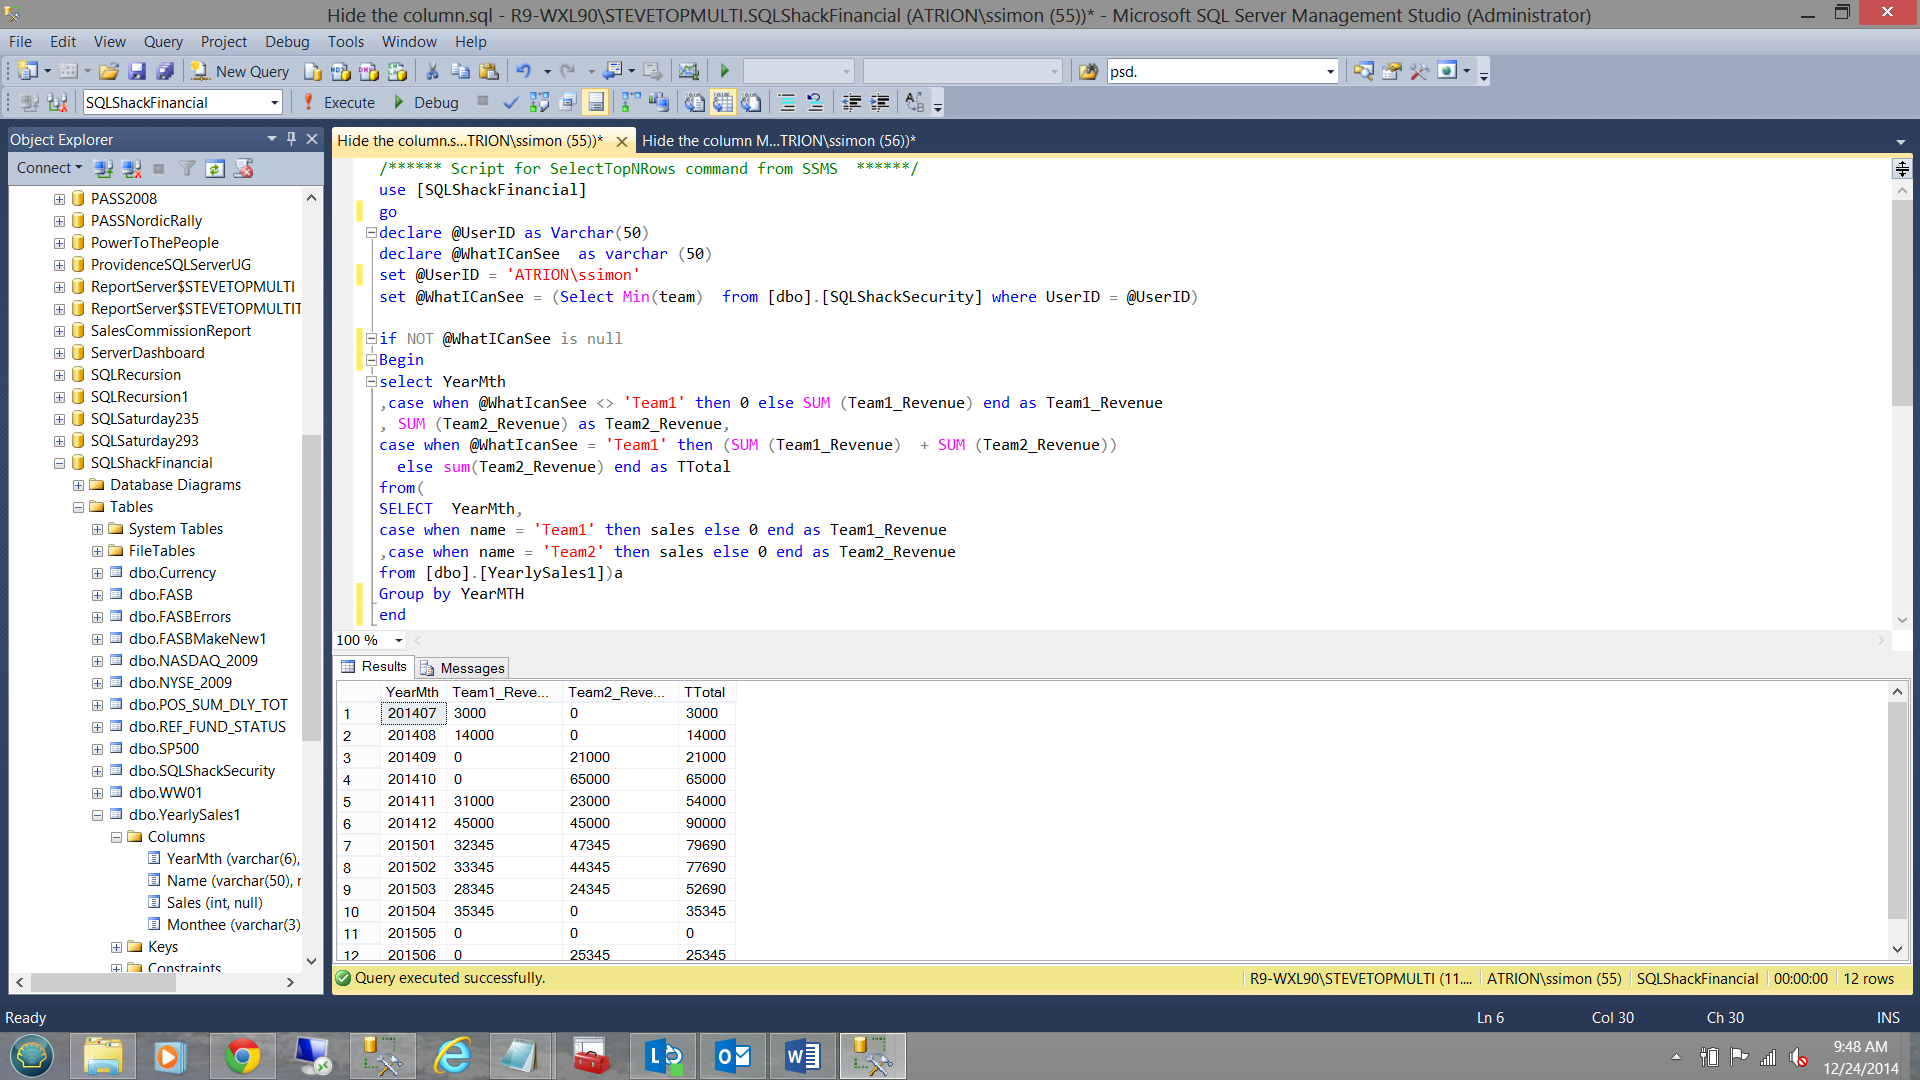
We see that (as is) the query returns all the data for Team1 as user “ATRION\ssimon” is permitted to see Team1 data.
我们看到查询按原样返回了Team1的所有数据,因为允许用户“ ATRION \ ssimon”查看Team1数据。
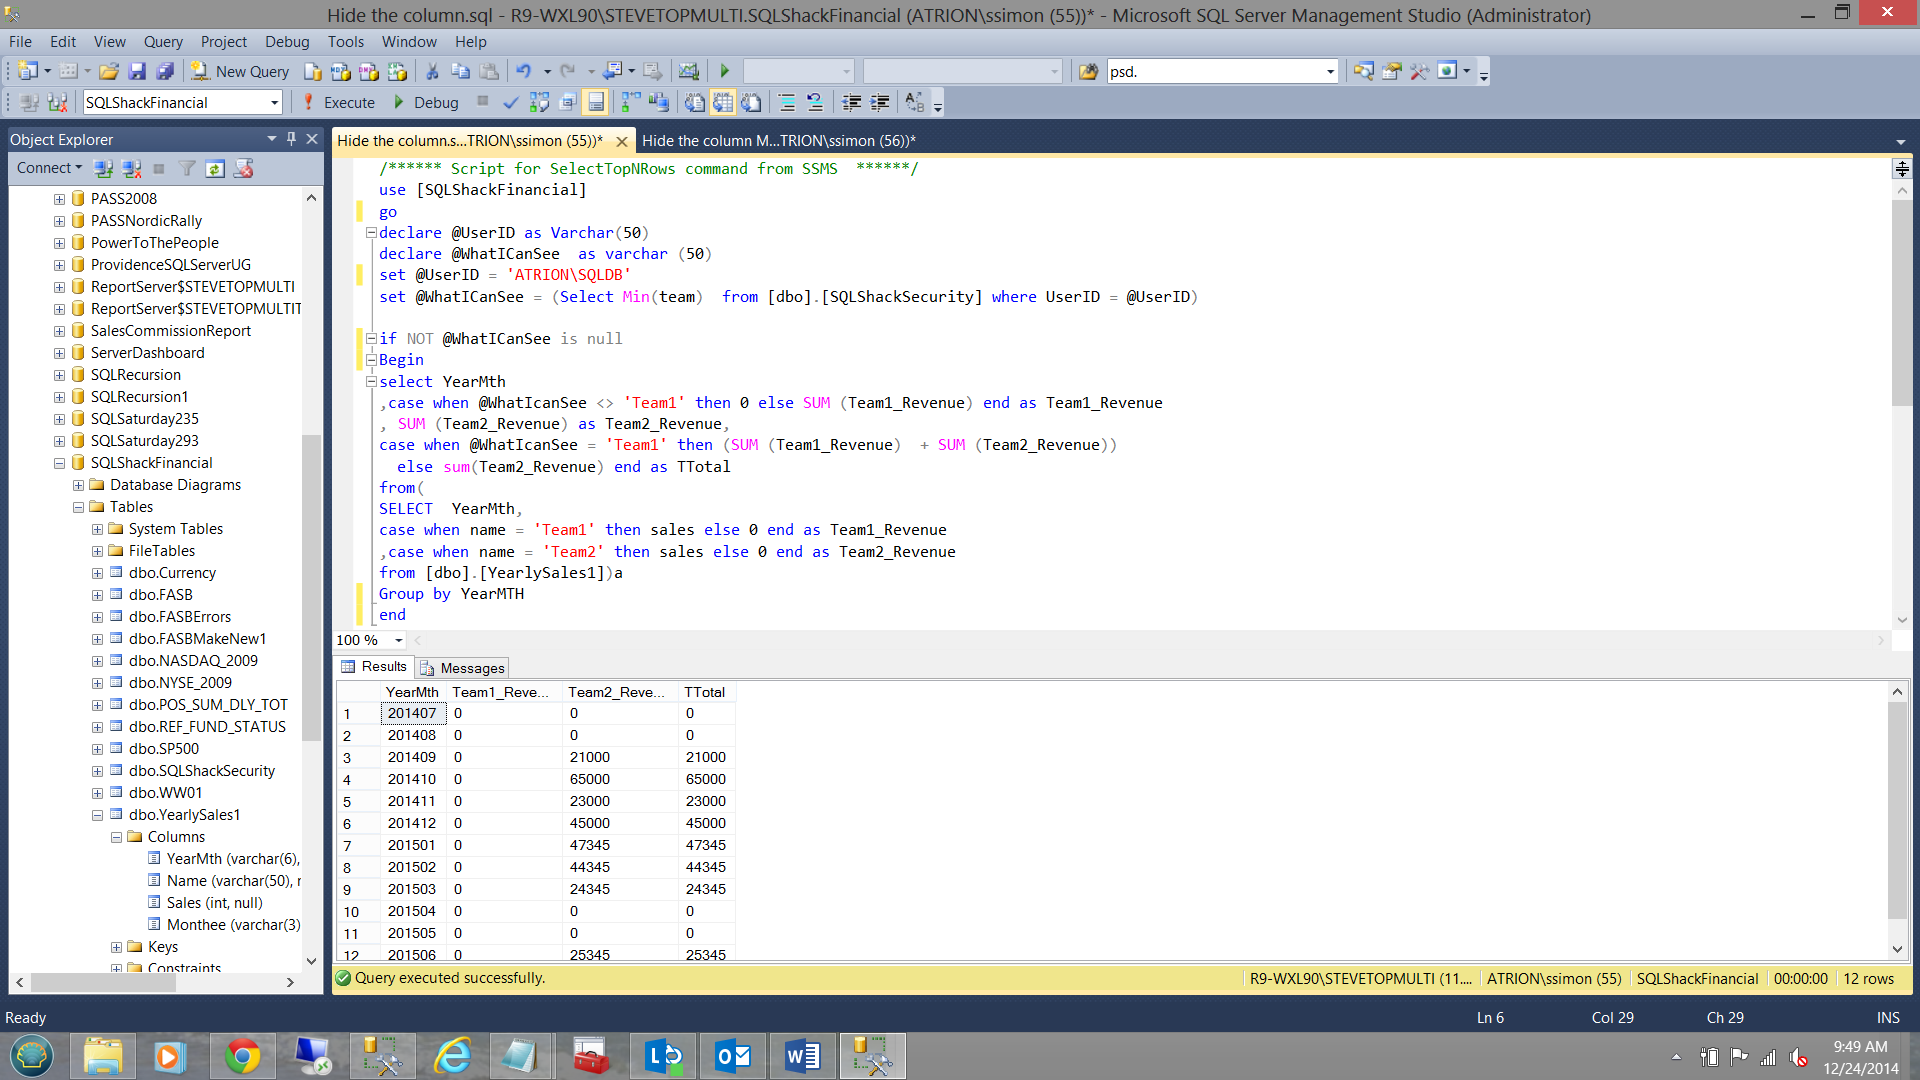
Changing the user to “ATRION\SQLDB” the following data is returned.
将用户更改为“ ATRION \ SQLDB”,将返回以下数据。

限制数据列 ( Restricting data columns )
After a meeting with SQLShack Industries management, we find that there is additional data that must be locked down.
与SQLShack Industries管理层会面后,我们发现必须锁定其他数据。
Many SQLShack Industries reports contain a Total Sales per month field and management feels that Team1 should be able to view all corporate monthly sales, whilst the remaining teams may only view their own results.
许多SQLShack Industries报告包含“每月总销售额”字段,并且管理层认为Team1应该能够查看所有公司的每月销售额,而其余团队则只能查看自己的结果。
The following piece of code will help us achieve the desired results. Once again permissions are based upon the user ID detected upon entry into the Reporting Services / SharePoint Environment.
以下代码段将帮助我们获得所需的结果。 权限再次基于进入Reporting Services / SharePoint环境时检测到的用户ID。
declare @UserID as Varchar(50)
declare @WhatICanSee  as varchar (50)
set @UserID = 'ATRION\ssimon'
set @WhatICanSee = (Select Min(team)  from [dbo].[SQLShackSecurity] where UserID = rtrim(ltrim(@UserID)))

if NOT @WhatICanSee is null
Begin
select YearMth
,case when @WhatIcanSee <> 'Team1' then 0 else SUM (Team1_Revenue) end as Team1_Revenue
, SUM (Team2_Revenue) as Team2_Revenue,
case when @WhatIcanSee = 'Team1' then (SUM (Team1_Revenue)  + SUM (Team2_Revenue))
  else sum(Team2_Revenue) end as TTotal
from(
SELECT YearMth,
case when name = 'Team1' then sales else 0 end as Team1_Revenue
,case when name = 'Team2' then sales else 0 end as Team2_Revenue
from [dbo].[YearlySales1])a
Group by YearMTH
end
A note of explanation is required for the following line of the code:
以下代码行需要注释说明:
set @WhatICanSee = (Select Min(team) from [dbo].[SQLShackSecurity] where UserID = rtrim(ltrim(@UserID)))
As we see in the table below, we may find the condition where a user has access to the data from more than one team. In this case, the rights are assigned based upon the rights allocated to the lowest team number (i.e. Team1).
如下表所示,我们可能会发现一种情况,即用户可以从多个团队访问数据。 在这种情况下,根据分配给最低团队编号(即Team1)的权限来分配权限。
ATRION\ssimon | Team1 GLOBAL RIGHTS |
ATRION\ssimon | Team2 Team 2 ONLY |
ATRION \ Ssimon | Team1全球权利 |
ATRION \ Ssimon | 仅限Team2团队2 |
Running our query for user ATRION\SQLDB we find that the figure for the Total Sales / Revenue are as follows:
运行针对用户ATRION \ SQLDB的查询,我们发现Total Sales / Revenue的数字如下:
Changing the user to ATRION\ssimon we find the following results.
将用户更改为ATRION \ ssimon,我们发现以下结果。
The astute reader will note that in the case of user ATRION\SQLDB, he or she is only able to see the data for Team2 and the total column reflects that.
精明的读者会注意到,对于用户ATRION \ SQLDB,他或她只能看到Team2的数据,而total列反映了这一点。
User ATRION\ssimon, on the other hand is able to see all the data and therefore his or her total field reflects the summary total of sales for Team1 and Team2. We make one final change to this code and that is to add a new calculated field called “Monthee” which will contain the first three letters of the calendar month name (e.g. ‘Jan’). We utilize the RIGHT() function “RIGHT(YEARMTH,2)”.
另一方面,用户ATRION \ ssimon可以查看所有数据,因此他或她的总计字段反映了Team1和Team2的销售汇总。 我们对该代码进行了最后更改,即添加了一个新的计算字段“ Monthee”,其中将包含日历月份名称的前三个字母(例如'Jan' )。 我们利用RIGHT()函数“ RIGHT(YEARMTH,2)”。
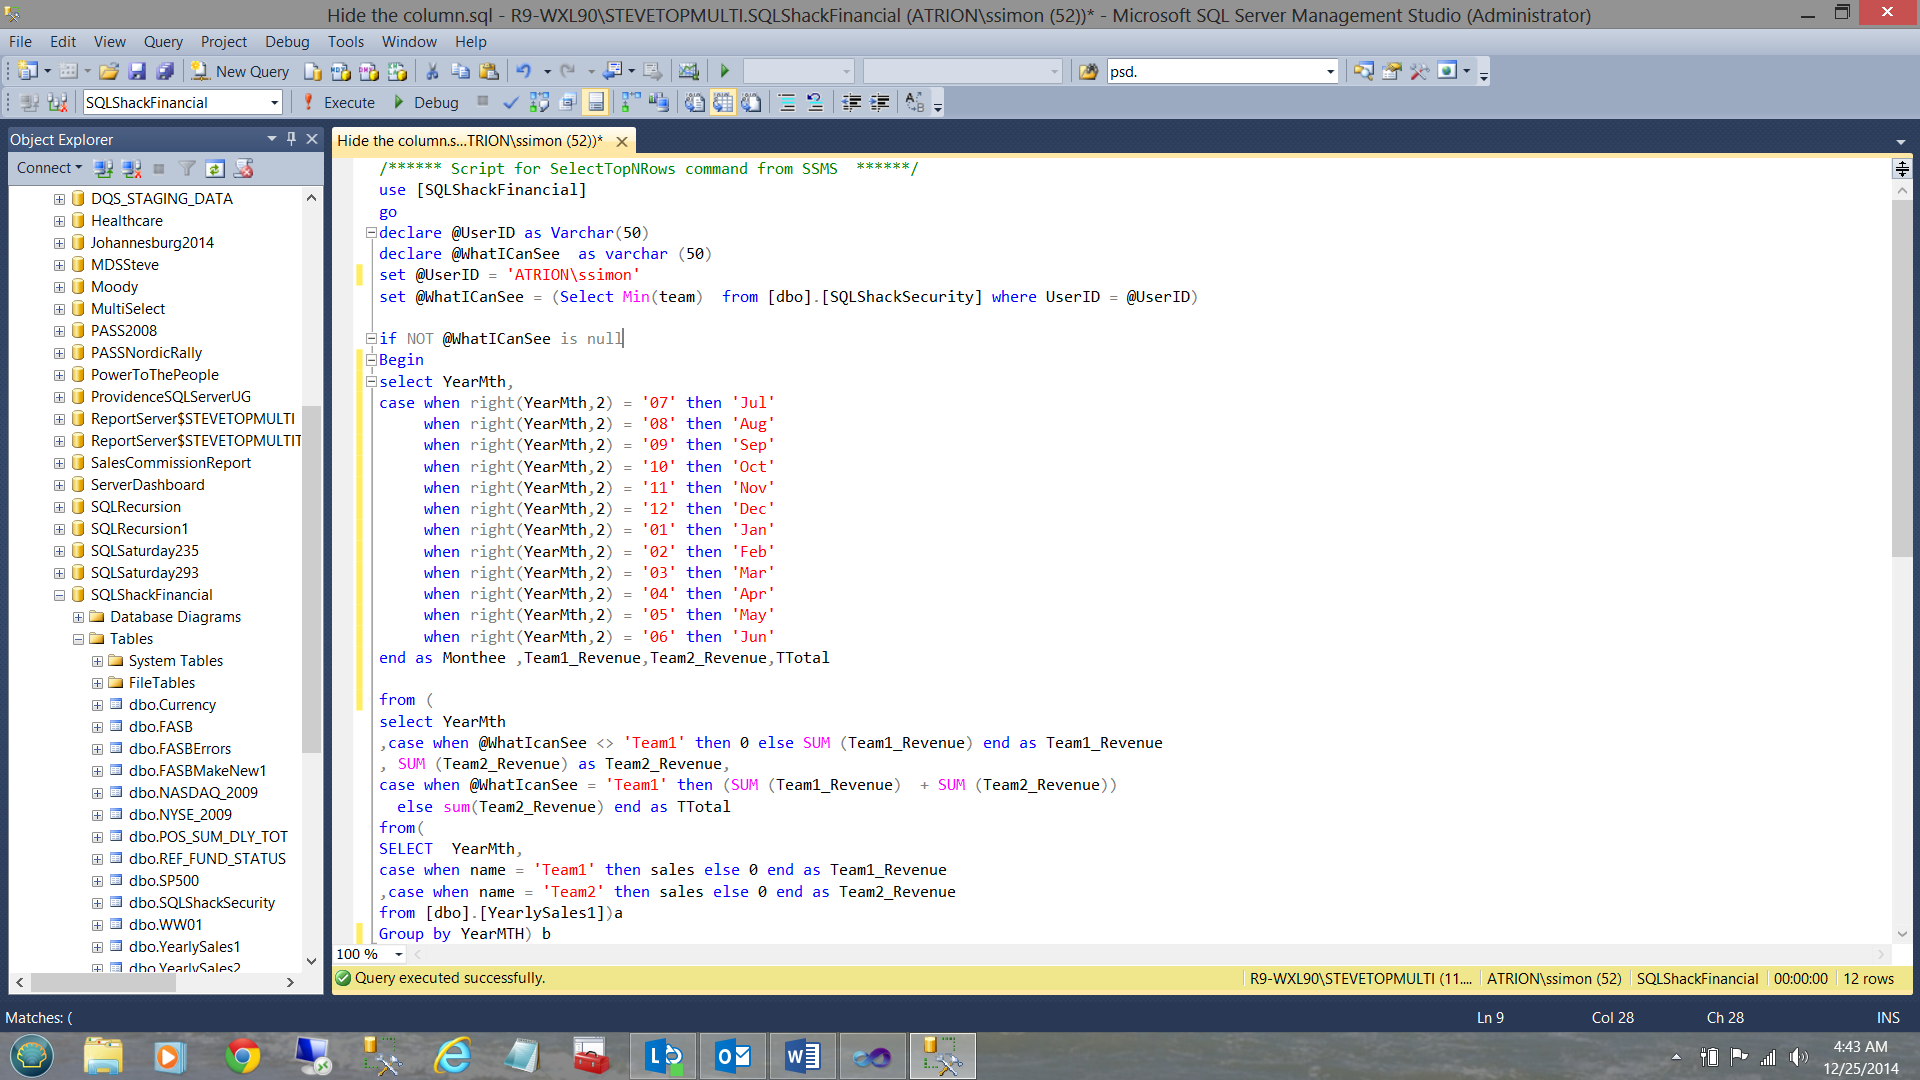
Note the usage of the RIGHT function to set the calendar month name (see above).
请注意使用RIGHT功能设置日历月名称(请参见上文)。
数据格式转换,用于基于矩阵的报告 ( Data format conversion for matrix based reporting )
Financial management at SQLShack Industries has also tasked us with showing these results in the form of a matrix. The thought behind this is, that it makes the results clearer to the decision maker. It should be remembered that the data format that we have just finished dealing with, is probably more conducive for a chart. This said, we are now going to structure a NEW stored procedure that will render the data in a format suitable for a matrix.
SQLShack Industries的财务管理还要求我们以矩阵形式显示这些结果。 其背后的想法是,它使决策者更清楚地了解结果。 应当记住,我们刚刚处理的数据格式可能更有利于图表。 也就是说,我们现在将构建一个NEW存储过程,该存储过程将以适合矩阵的格式呈现数据。
We begin by adding twelve variables @Month01 through @Month12. By using the code at the top of the screen dump below, we are able to populate these twelve variables. The complete code listing may be found in ADDENDA A.
我们从添加12个变量@ Month01到@ Month12开始。 通过使用下面屏幕转储顶部的代码,我们可以填充这十二个变量。 完整的代码清单可在ADDENDA A中找到。
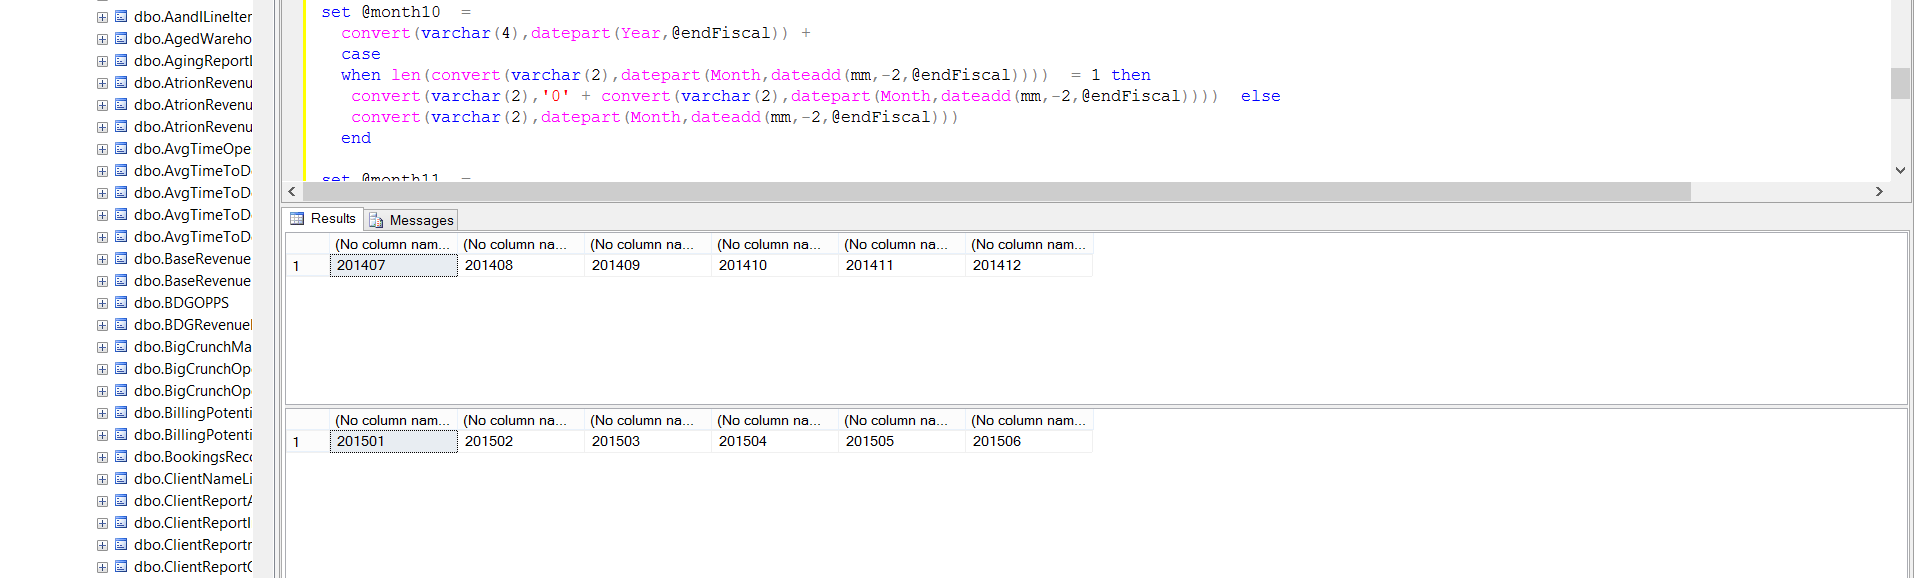
The eagle–eyed reader will ask, why declare and populate twelve variable fields, when the year and month already exist within the “YearlySales1” database table.
眼花reader乱的读者会问,为什么“ YearlySales1”数据库表中已经存在年和月,为什么要声明并填充十二个变量字段。
In approaching the extract in this manner, i.e. utilizing the twelve variables, we are certain of obtaining the current twelve month period (once again, please see the code in ADDENDA A). Remember that the table could contain data from a plethora of years.
以这种方式(即利用十二个变量)处理摘录时,我们确定将获得当前的十二个月期限(再次,请参见ADDENDA A中的代码)。 请记住,该表可能包含很多年的数据。
Adding the following pivot code to our original code (that we used for the chart), we now have a query that is more conducive to a matrix format.
将以下枢轴代码添加到原始代码(用于图表)中,现在我们有了一个更有助于矩阵格式的查询。
–– The values for @month01 through @month12 are calculated on the fly. The code to do so
–– may be found in the ADDENDA at the end of this article.
– – @ month01到@ month12的值是即时计算的。 这样做的代码
– –可以在本文末尾的ADDENDA中找到。
set @sql =
' select  name, [' +  @month01+ '],[' + @month02+ '],[' +@month03+ '],[' +@month04+ '],[' +@month05 +'],['
 + @month06+ '],[' +@month07+ '],[' +@month08+ '],[' +@month09+ '],[' +@month10+ '],[' +
  @month11+ '],[' +@month12 +
']   from ' +
' ( ' +
'  select Yearmth, name, value ' +
'  from #rawdata1 ' +
'  unpivot ' +
'  ( ' +
'    value for name in ([Team1_Revenue],[Team2_Revenue],[TTotal]) ' +
'  ) unpiv '+
' ) src ' +
' pivot ' +
' ( ' +
'  sum(value) ' +
'  for YearMth in (['
 + @month01+ '],[' + @month02+ '],[' +@month03+ '],[' +@month04+ '],[' +@month05 +'],['
 + @month06+ '],[' +@month07+ '],[' +@month08+ '],[' +@month09+ '],[' +@month10+ '],['
 + @month11+ '],[' +@month12  +'] )) piv '
 + ‘order by name asc '

 set @sql1 = @sql
 CREATE TABLE #rawdata55(
	[name] [varchar](75) NULL,
	[Month01] [decimal](10, 2) NULL,
	[Month02] [decimal](10, 2) NULL,
	[Month03] [decimal](10, 2) NULL,
	[Month04] [decimal](10, 2) NULL,
	[Month05] [decimal](10, 2) NULL,
	[Month06] [decimal](10, 2) NULL,
	[Month07] [decimal](10, 2) NULL,
	[Month08] [decimal](10, 2) NULL,
	[Month09] [decimal](10, 2) NULL,
	[Month10] [decimal](10, 2) NULL,
	[Month11] [decimal](10, 2) NULL,
	[Month12] [decimal](10, 2) NULL
)

--select @sql
insert #rawdata55
exec sp_executesql @SQL1 with recompile
select * from #rawdata55
END
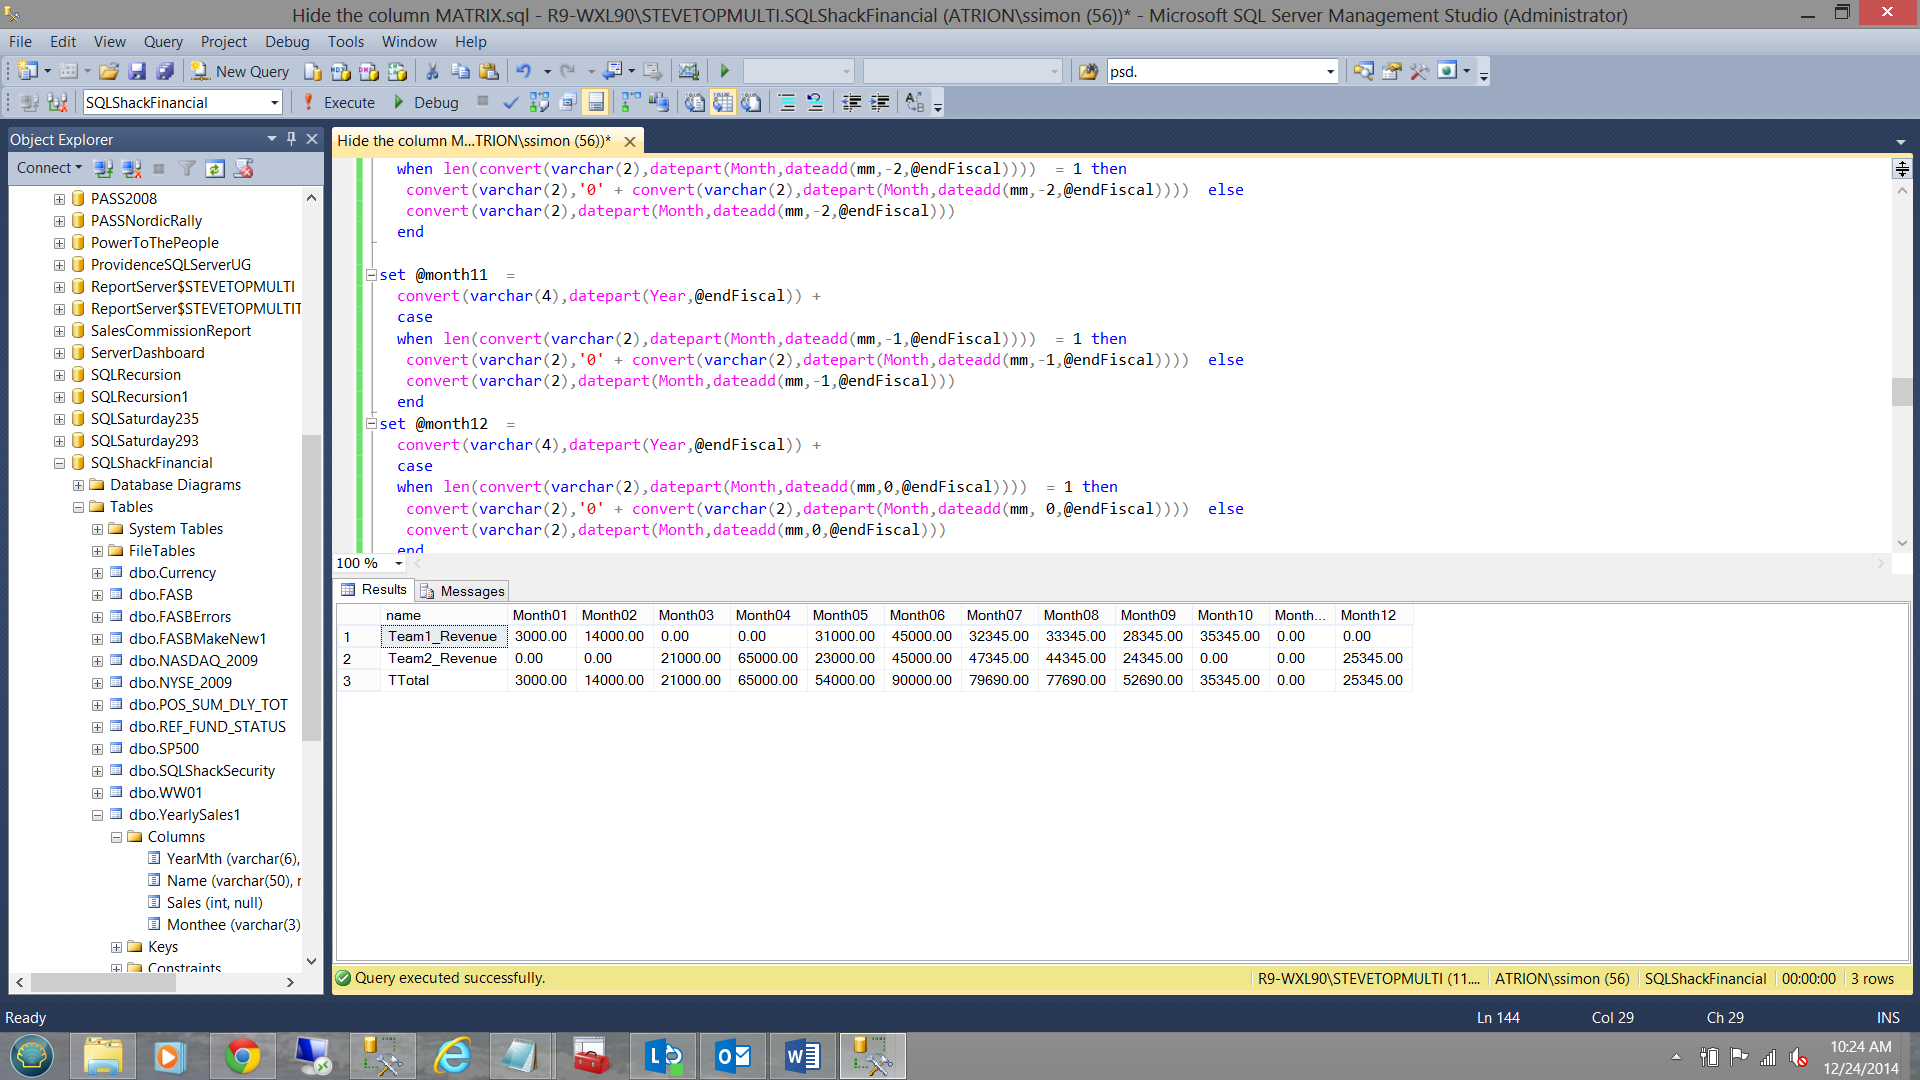
Now executing the query for user ATRION\ssimon we find:
现在执行用户ATRION \ ssimon的查询,我们发现:
and for user ATRION\SQLDB we find:
对于用户ATRION \ SQLDB,我们发现:
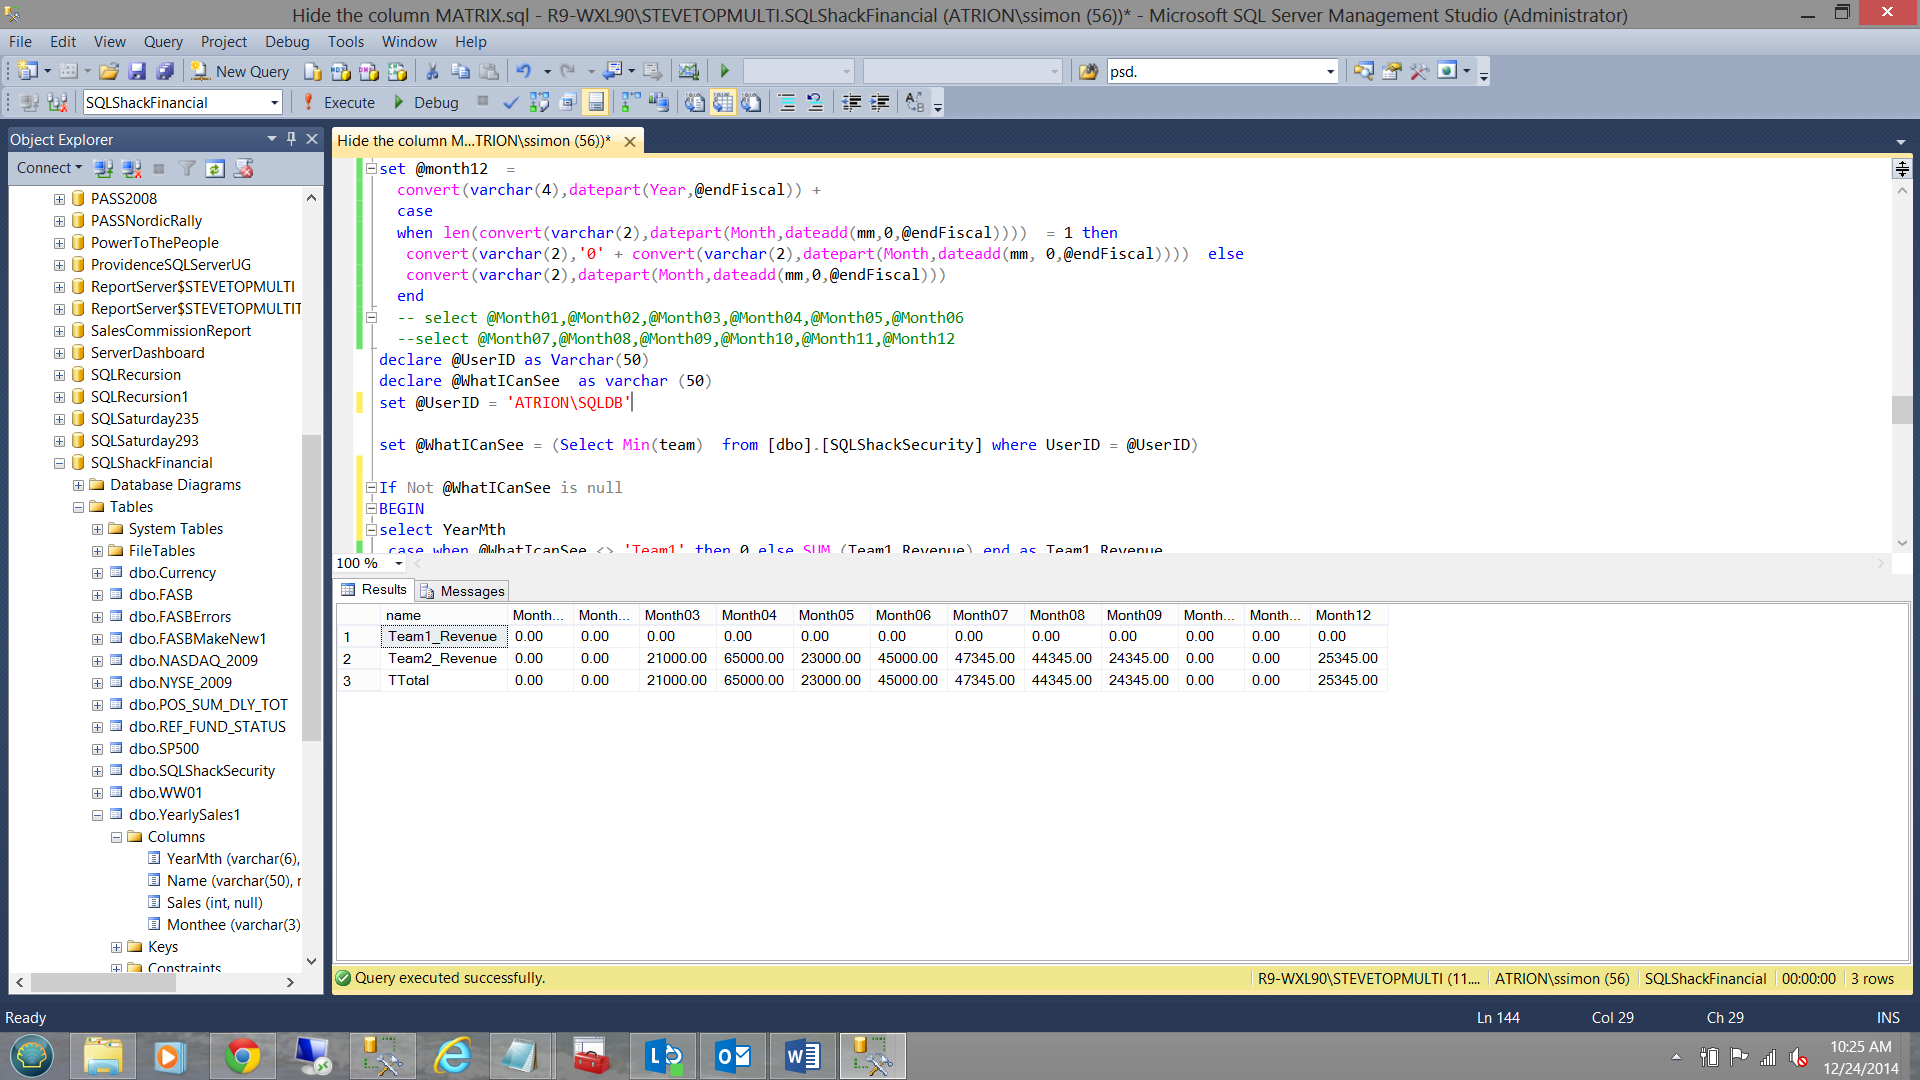
These are the results that we would have expected to obtain (see above).
这些是我们期望获得的结果(请参见上文)。
创建我们的第一个生产报告 ( Creating our first production reports )
Opening SQL Server Data Tools, we create a new Reporting Services Project and name it “SQLShackReportingSecurity”. Should you be unfamiliar with Reporting Services or how to create a project, please do have a look at my earlier article entitled: “Now you see it, now you don’t”
打开SQL Server数据工具 ,我们创建一个新的Reporting Services项目,并将其命名为“ SQLShackReportingSecurity”。 如果您不熟悉Reporting Services或如何创建项目,请阅读我之前的文章,标题为“现在您看到了,现在您不知道了”。
Within this article I describe in great detail how to get started creating a Reporting Services project.
在本文中,我将详细介绍如何开始创建Reporting Services项目。
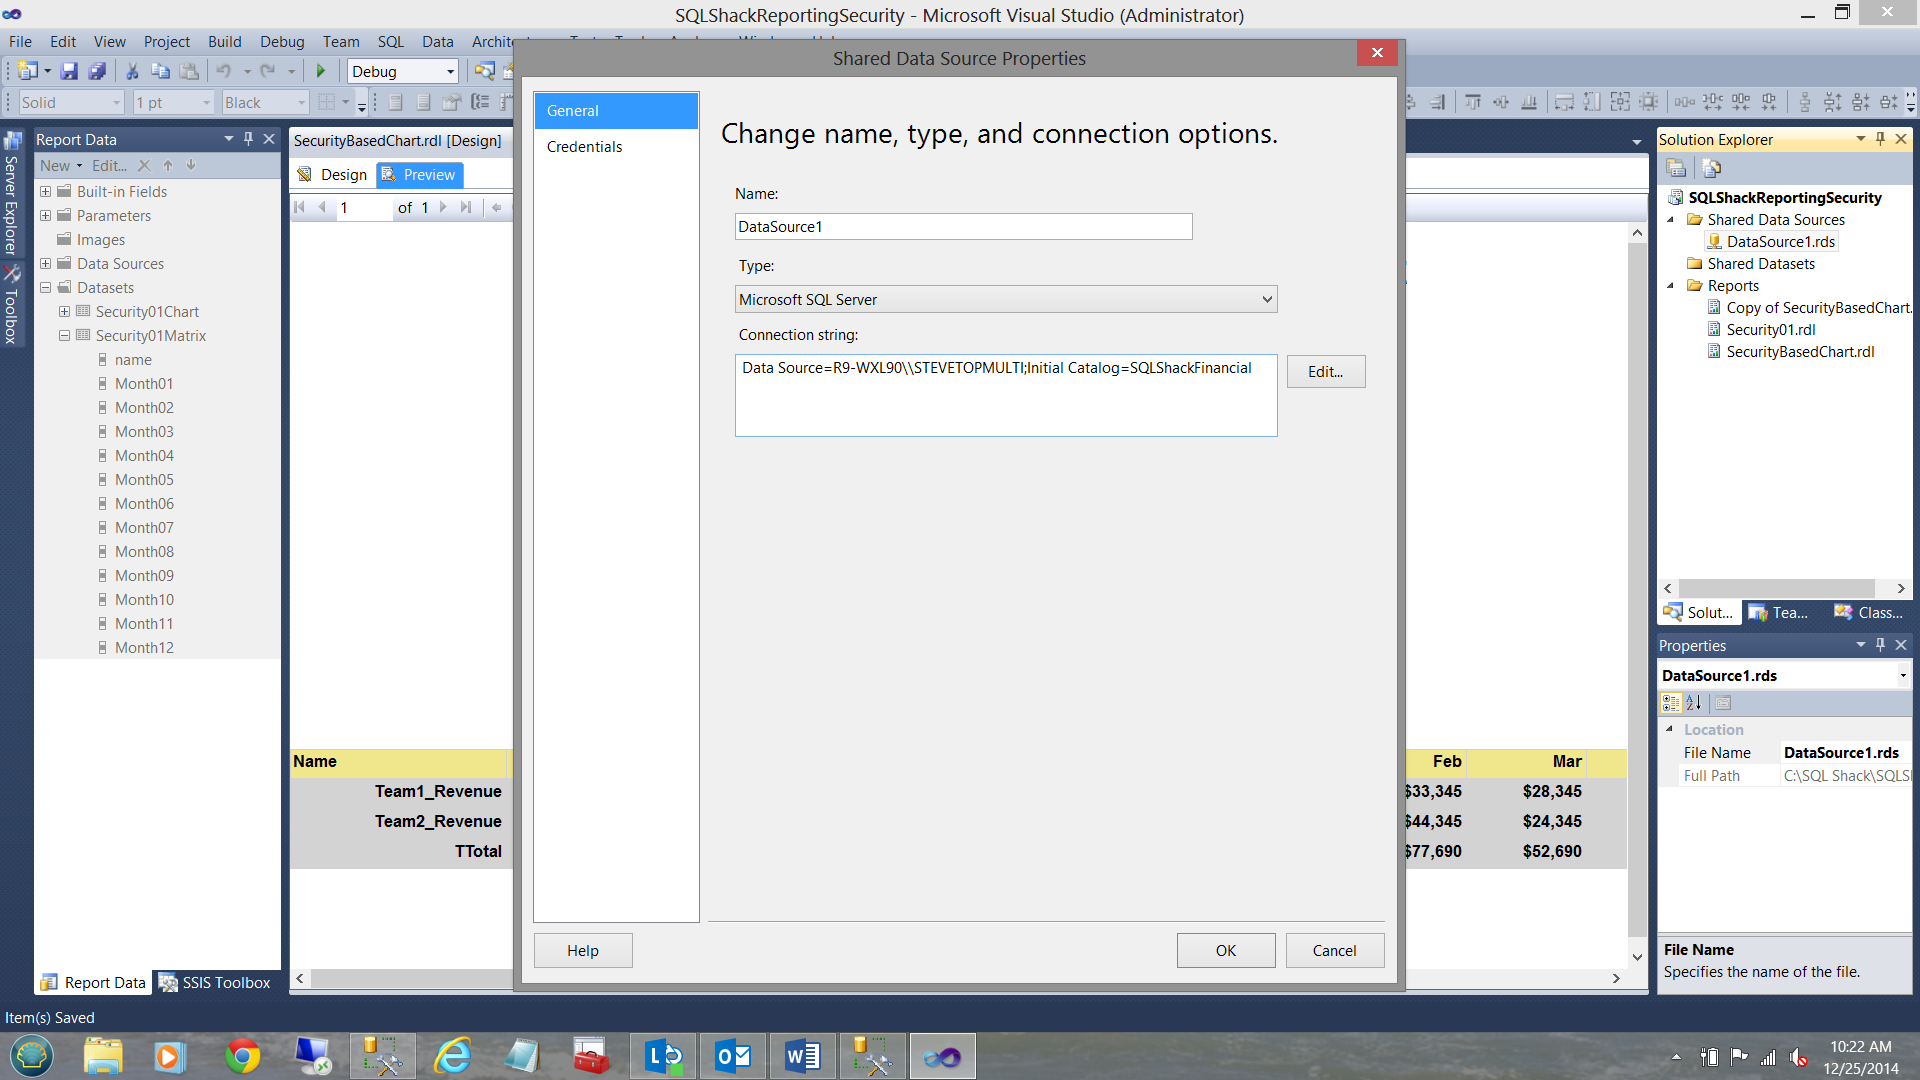
We first create a shared “Data Source” (see below). This data source contains the necessary information to connect to the source data within the SQL Server database.
我们首先创建一个共享的“数据源”(见下文)。 此数据源包含必要的信息,以连接到SQL Server数据库中的源数据。
创建我们的第一个报告 ( Creating our first report )
Within our project we right click on the report folder, select “Add” and “New Item”.
在我们的项目中,我们右键单击报告文件夹,选择“添加”和“新项目”。
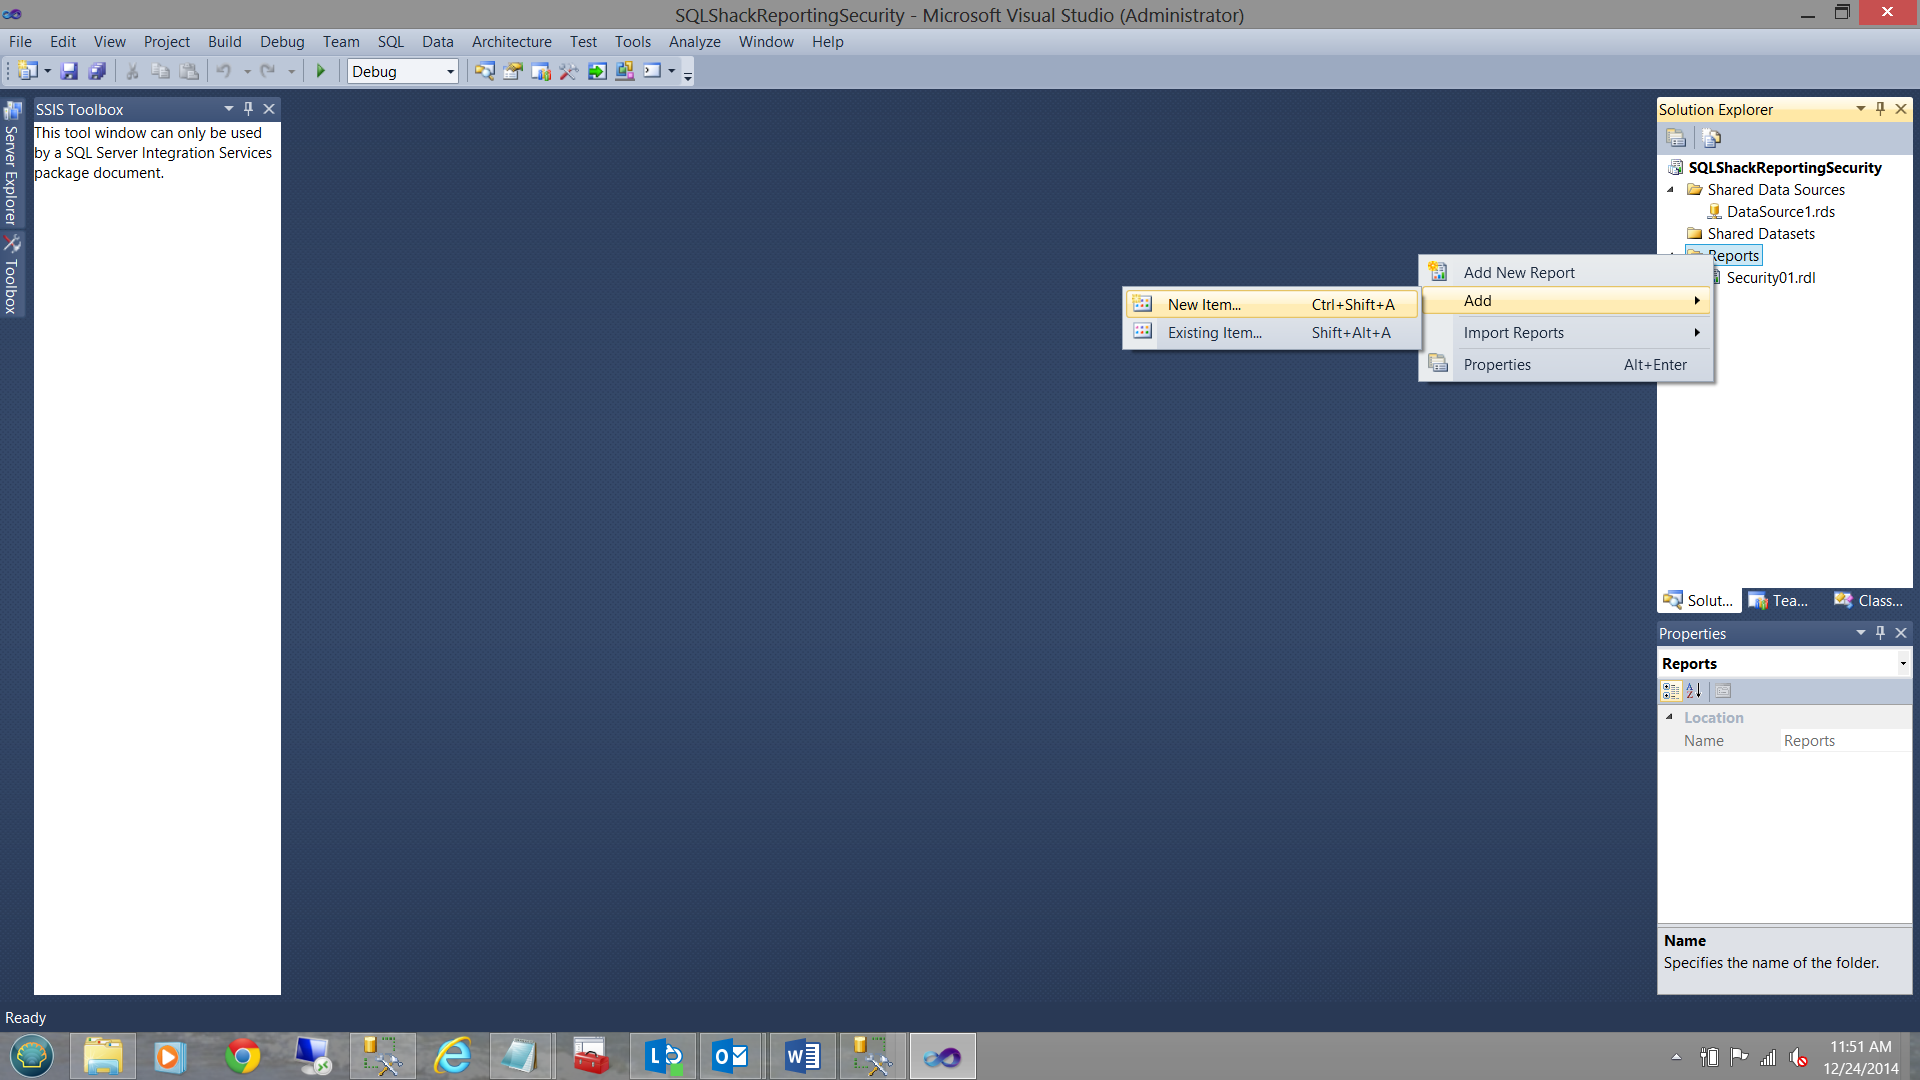
We add a new report as shown below:
我们添加一个新报告,如下所示:
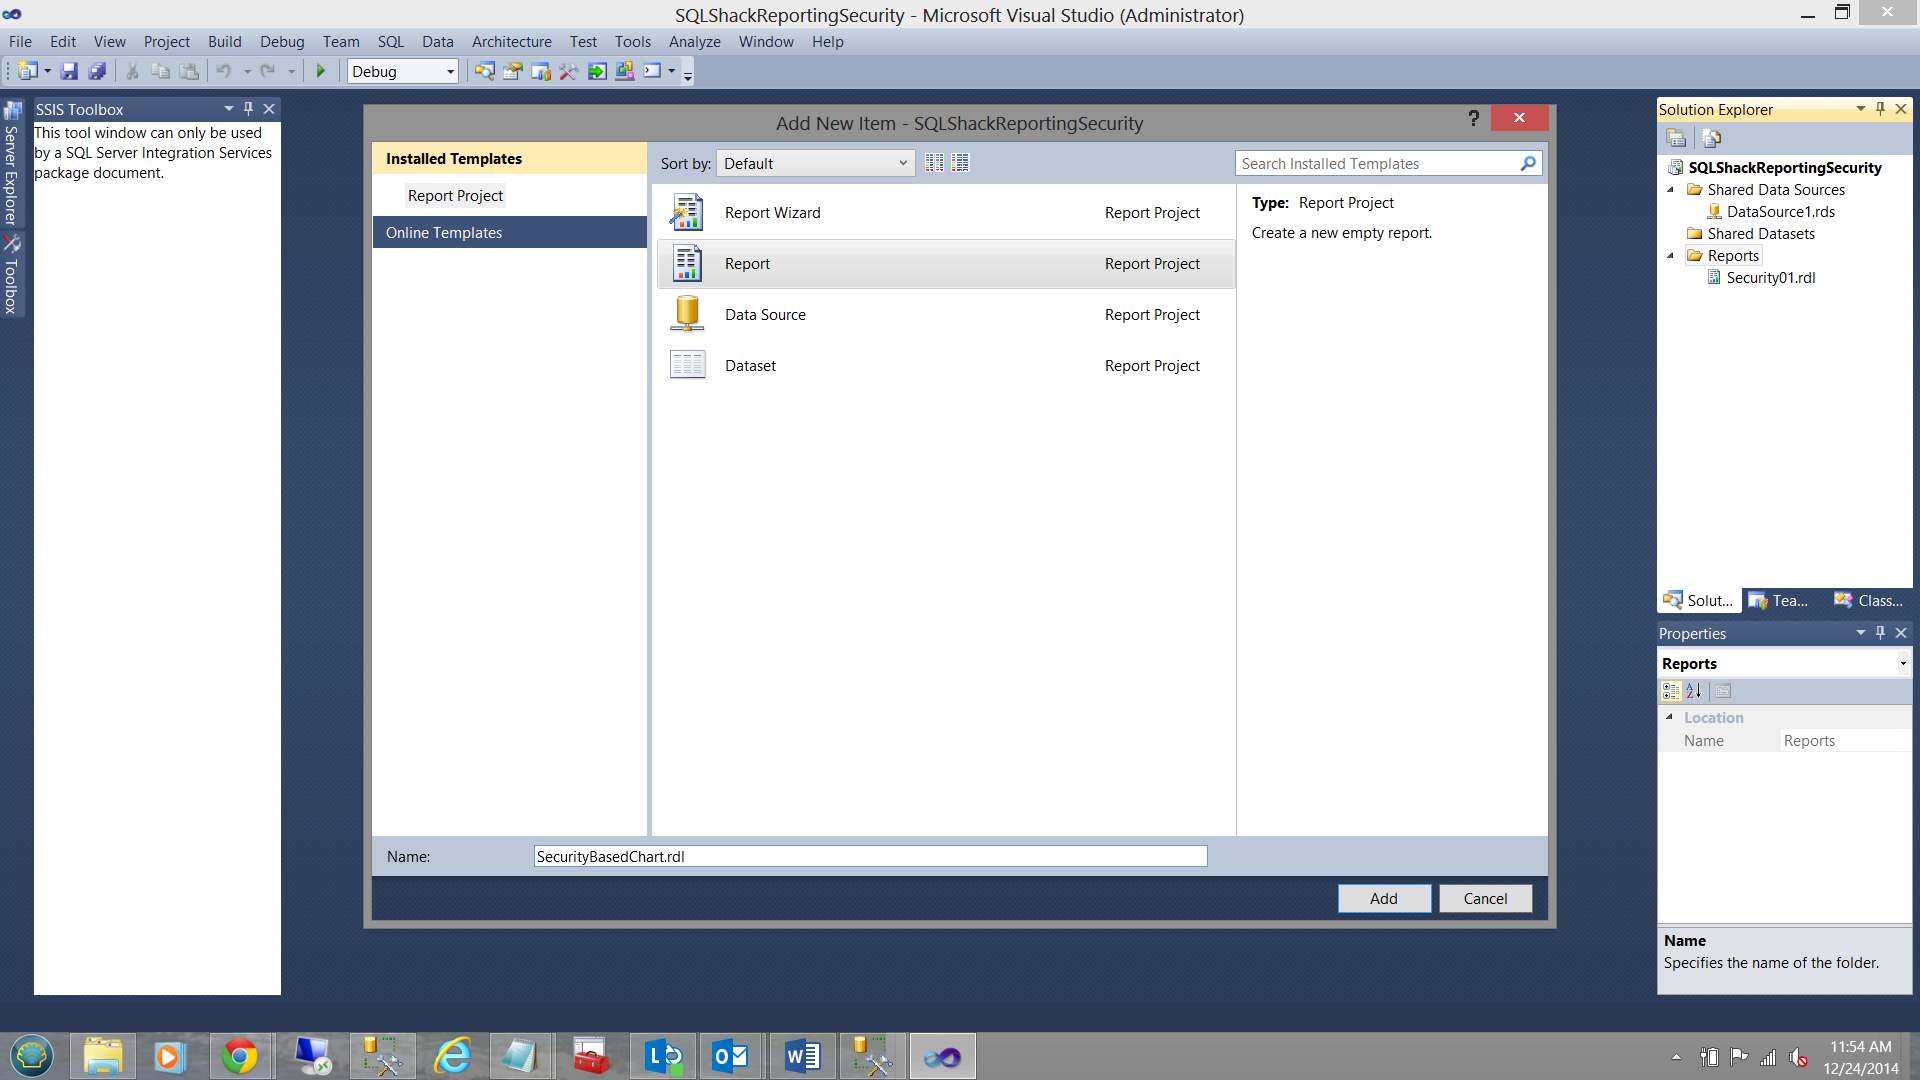
We click “Add” and we are returned to the report drawing surface.
单击“添加”,然后返回到报表图纸图面。
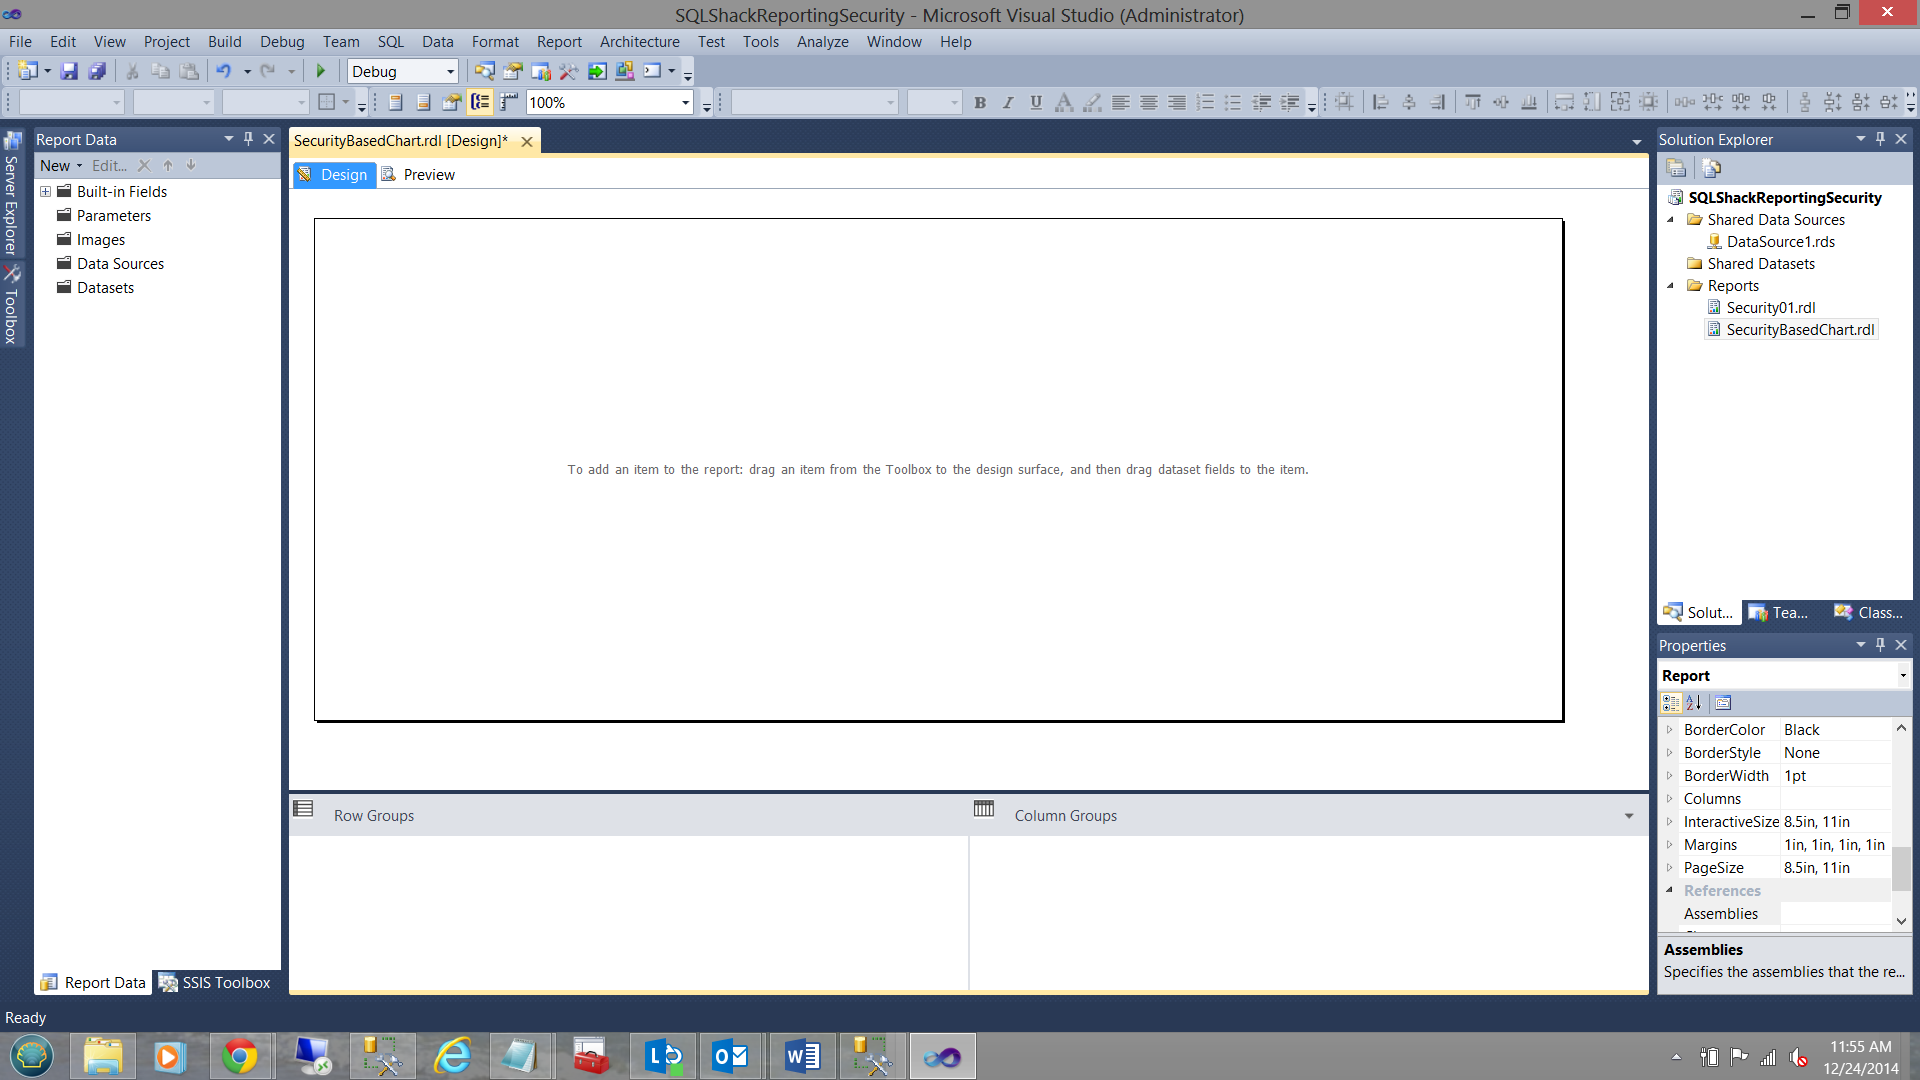
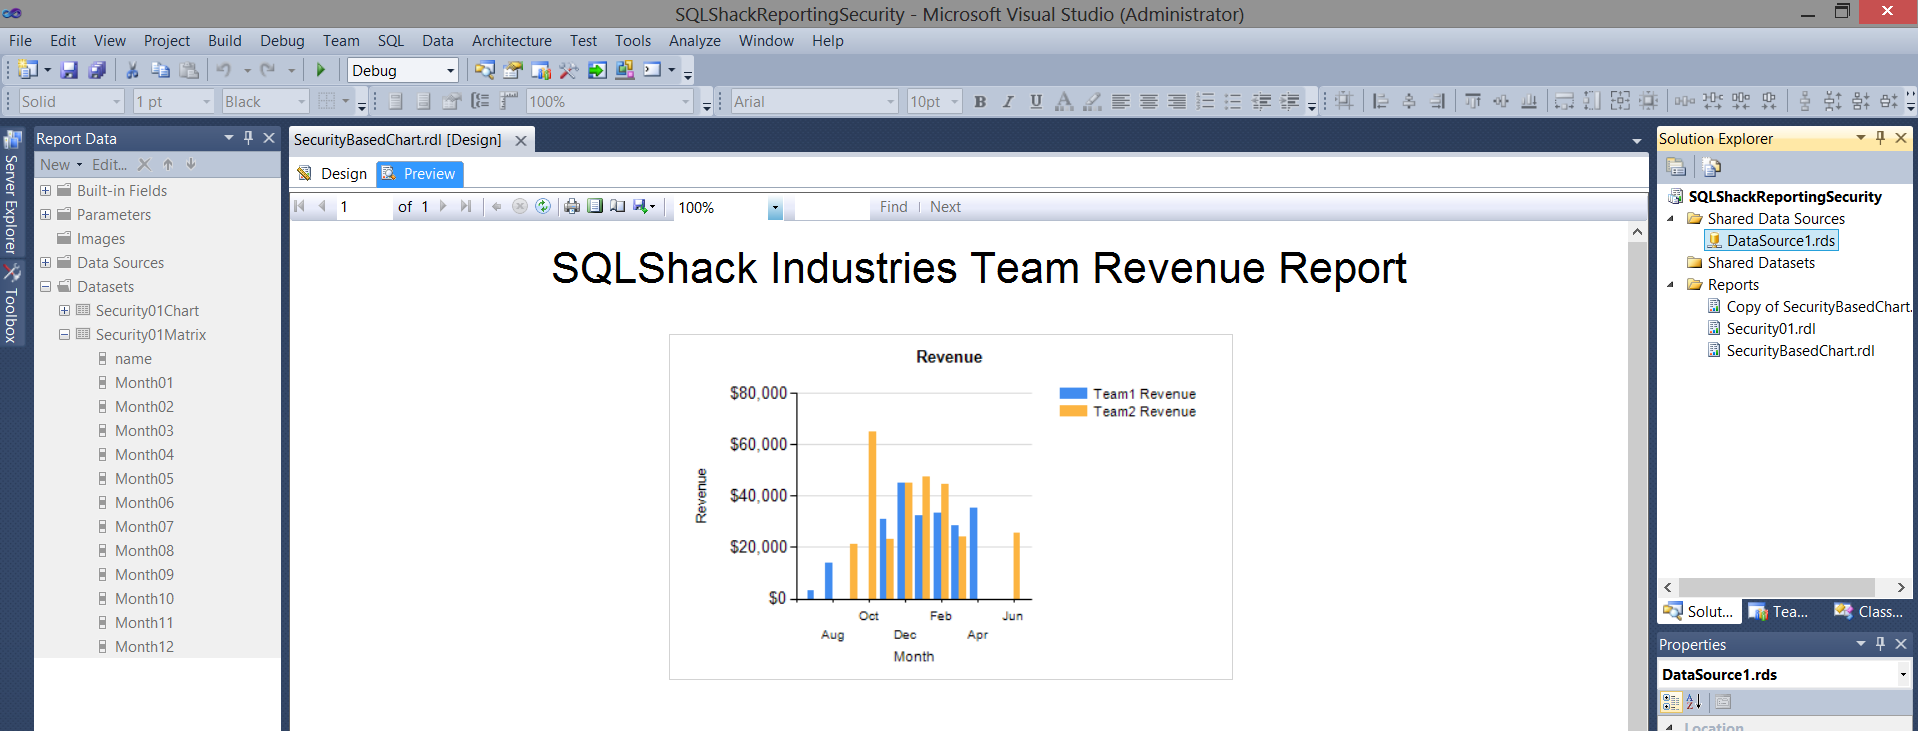
We are now going to create a vertical bar chart graph (see below).
现在,我们将创建一个垂直条形图图(请参见下文)。
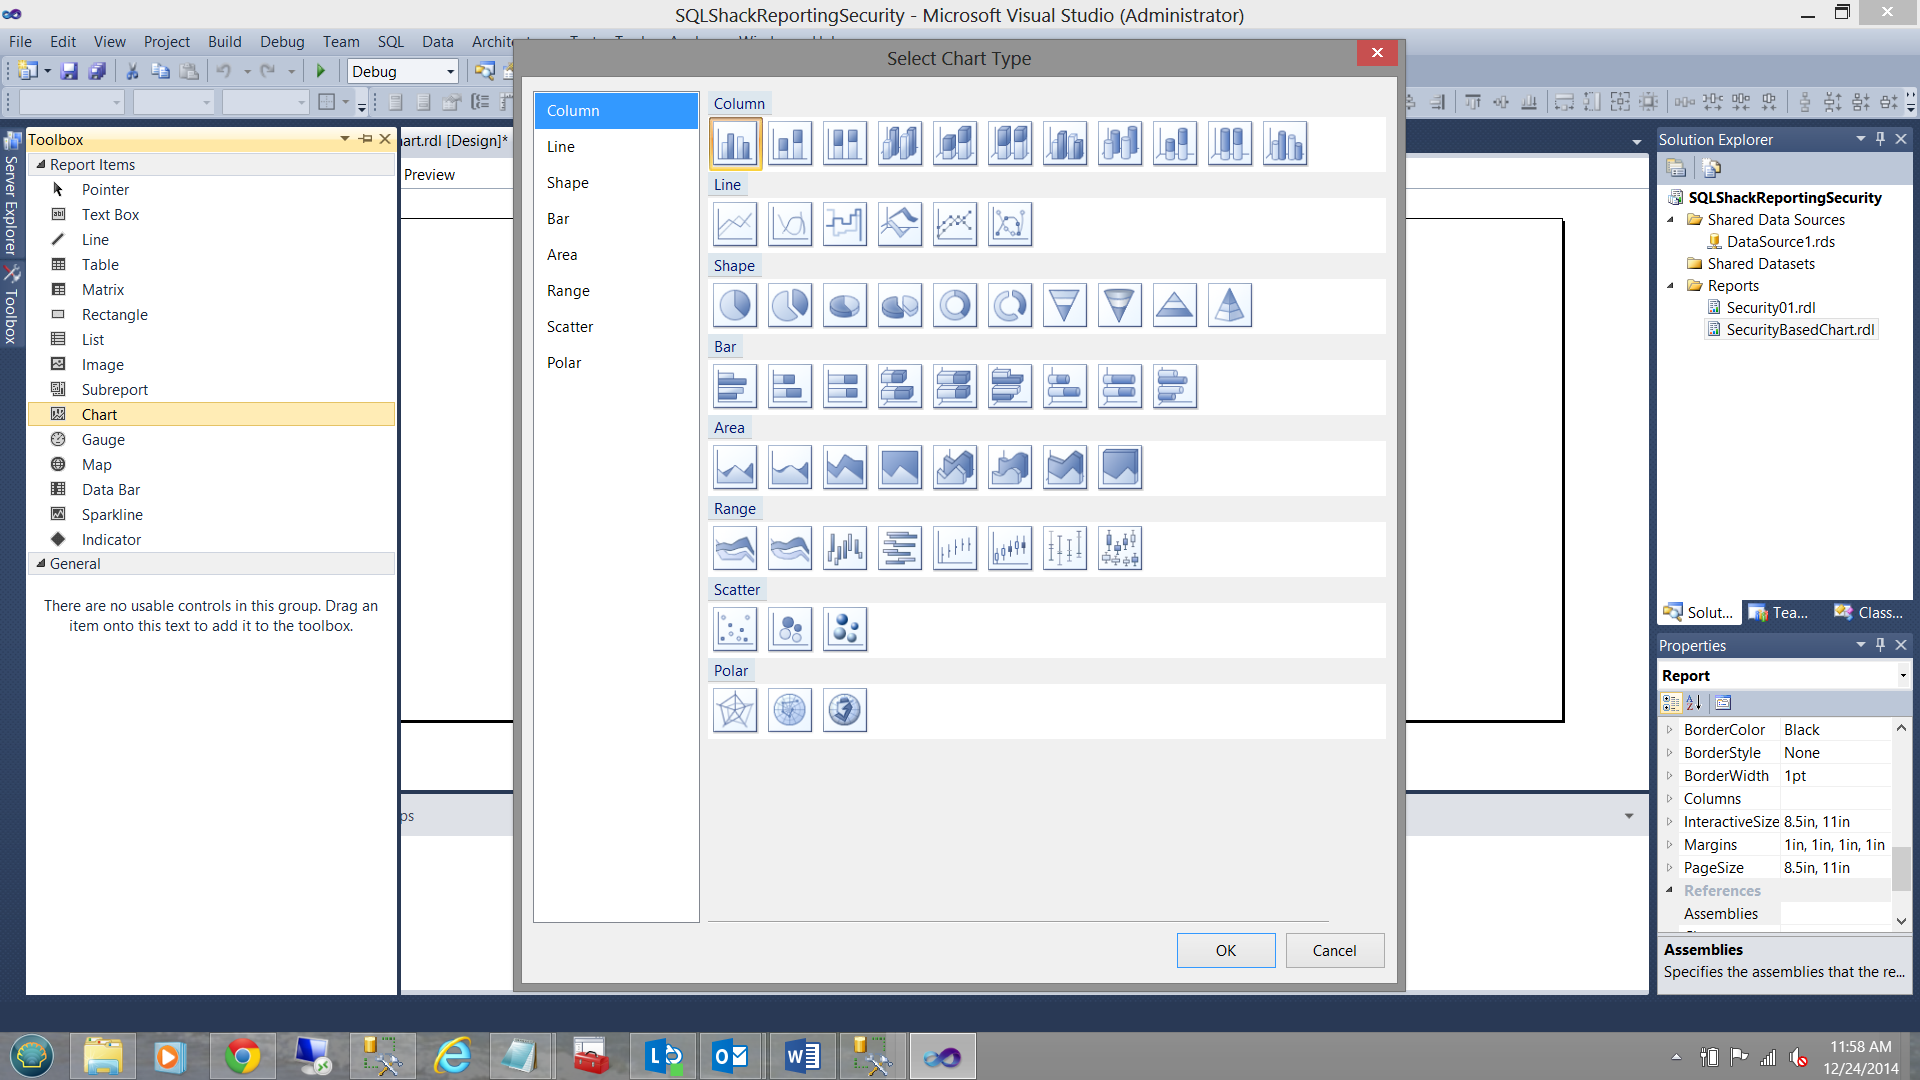
For this exercise we shall be utilizing a column chart (see above).
在本练习中,我们将使用柱形图(请参见上文)。
创建我们的数据集 ( Creating our dataset )
In order for us to access the raw data from the database table (i.e. the data which will be consumed by our bar chart), we must first create a dataset. Should you be unfamiliar with the process or not understand the concept of a “dataset”, then please do have a look at one of my earlier articles “Now you see it, now you don’t”
为了使我们能够访问数据库表中的原始数据(即条形图将使用的数据),我们必须首先创建一个数据集。 如果您不熟悉该过程或不了解“数据集”的概念,那么请看一下我以前的一篇文章“现在您看到了,现在您不知道了”
We click the “New” button (see above). The local data source dialog box is brought up (see below).
我们点击“新建”按钮(见上文)。 出现本地数据源对话框(请参见下文)。
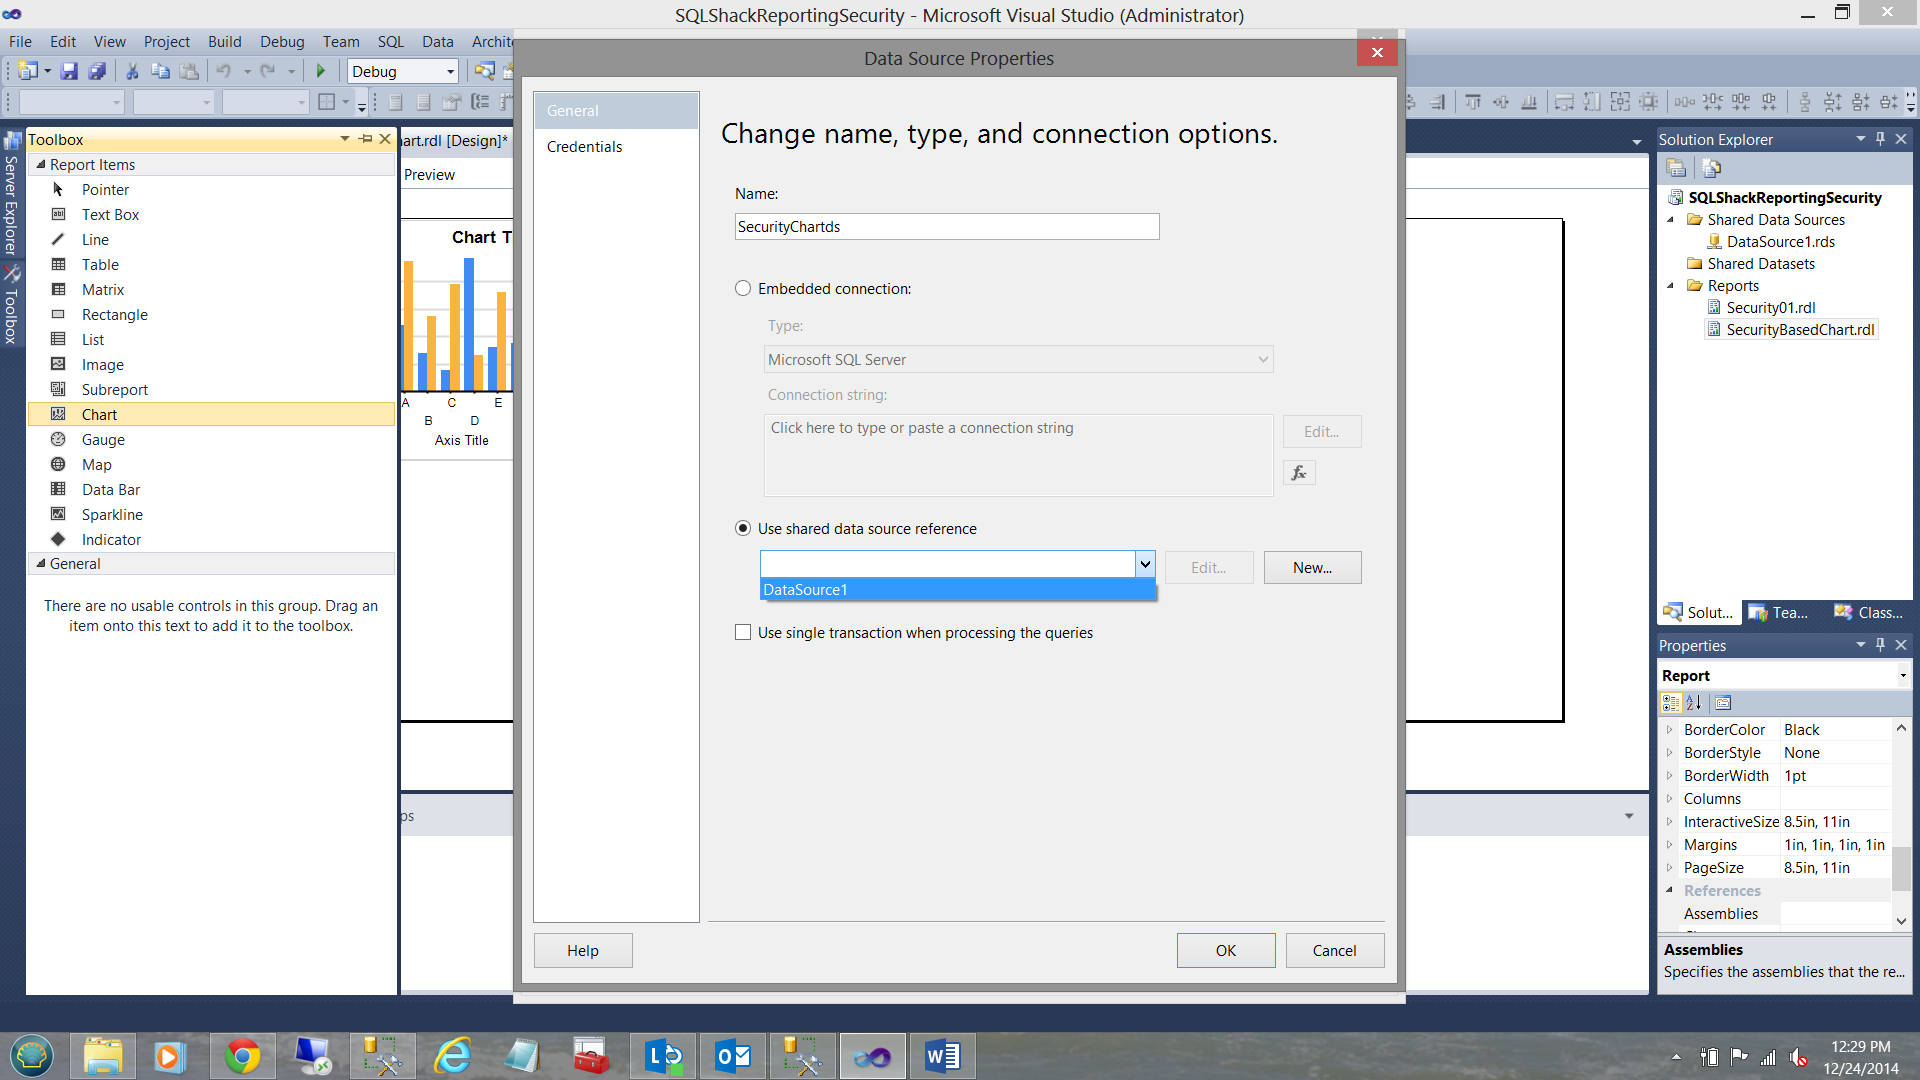
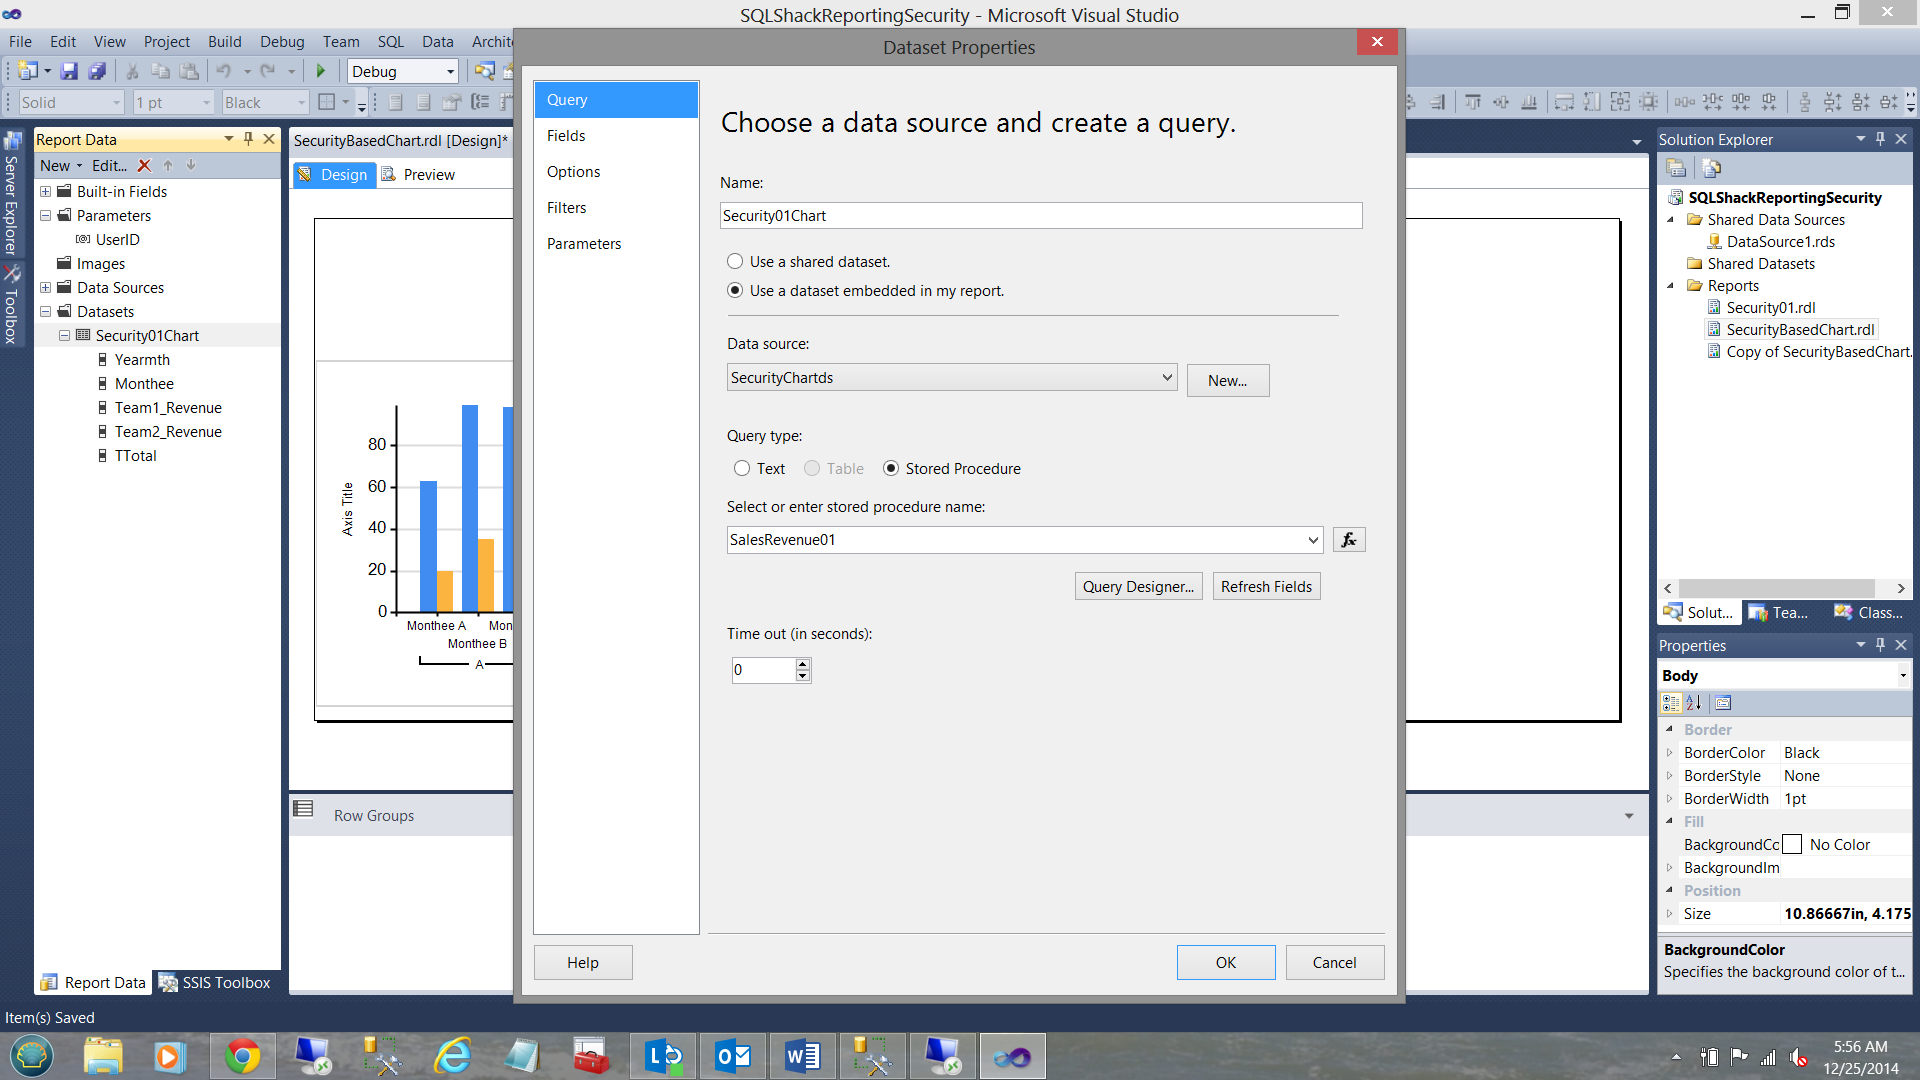
We note above that we opt to use as “Shared Data Source”. This is the shared data source that we created at the start of the project. We click “OK” to leave the local data source dialog box and we are returned to the “DataSet Properties” box (see below).
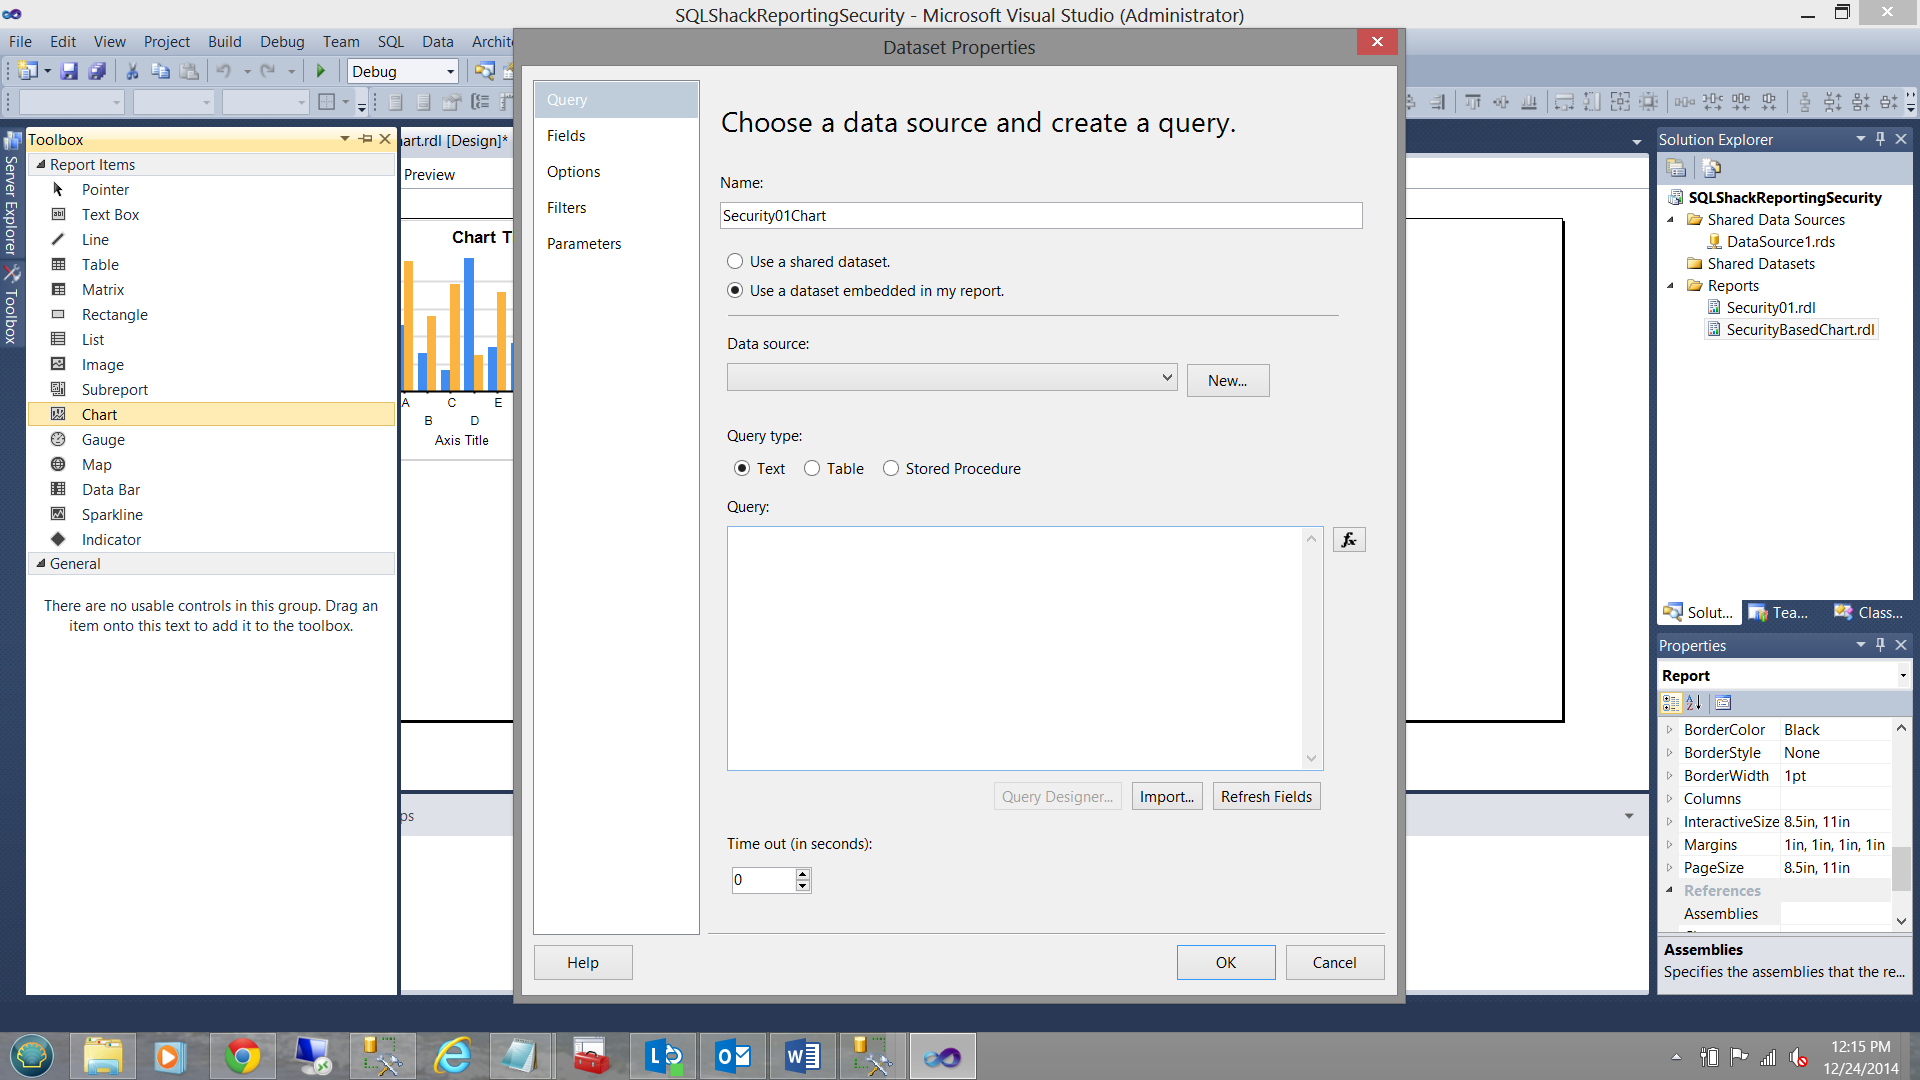
我们在上面注意到,我们选择用作“共享数据源”。 这是我们在项目开始时创建的共享数据源。 我们单击“确定”离开本地数据源对话框,然后返回到“数据集属性”框(见下文)。
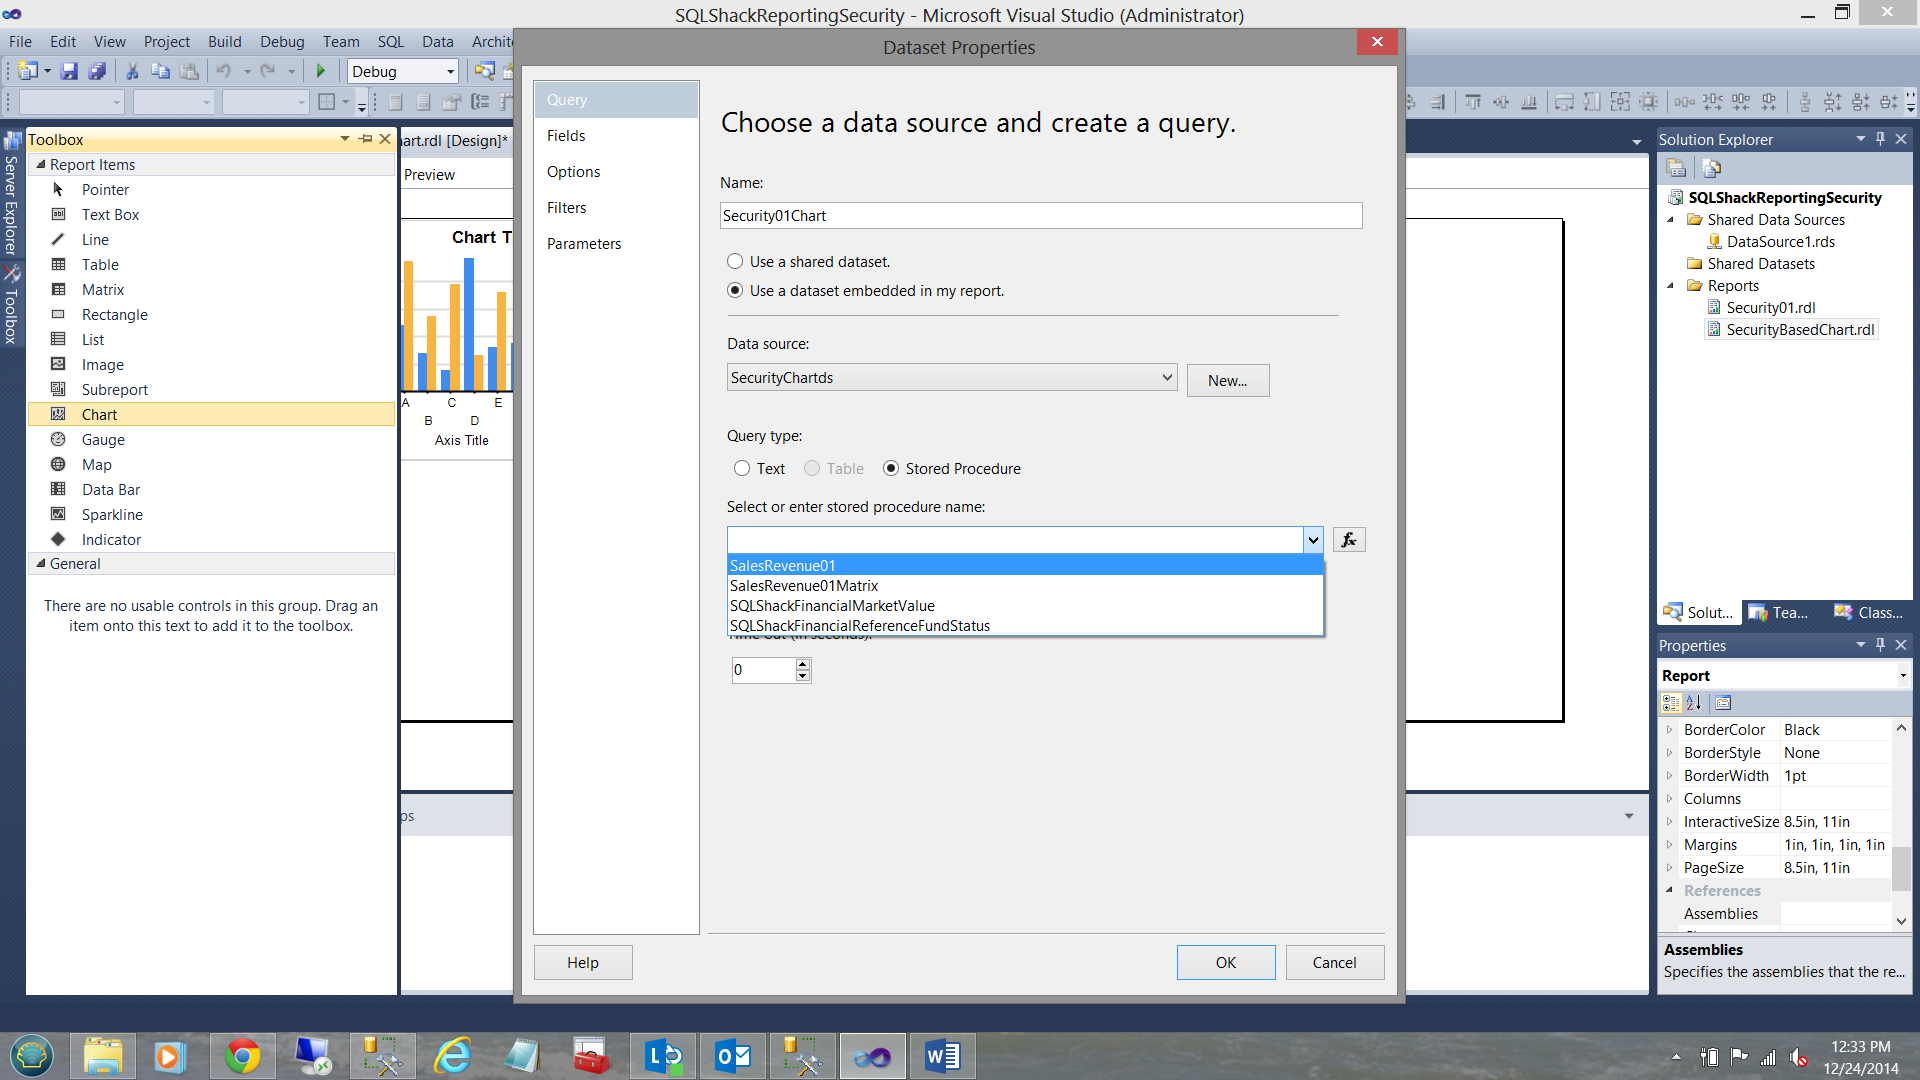
We opt for the “Stored Procedure” as the “Query type” and select “ServiceRevenue01” option as the procedure that we wish to utilize. We click OK to exit the “Dataset Properties” dialog box and we are returned to the report drawing surface (see below).
我们选择“存储过程”作为“查询类型”,然后选择“ ServiceRevenue01”选项作为我们要利用的过程。 我们单击“确定”退出“数据集属性”对话框,然后返回到报表工程图表面(请参见下文)。
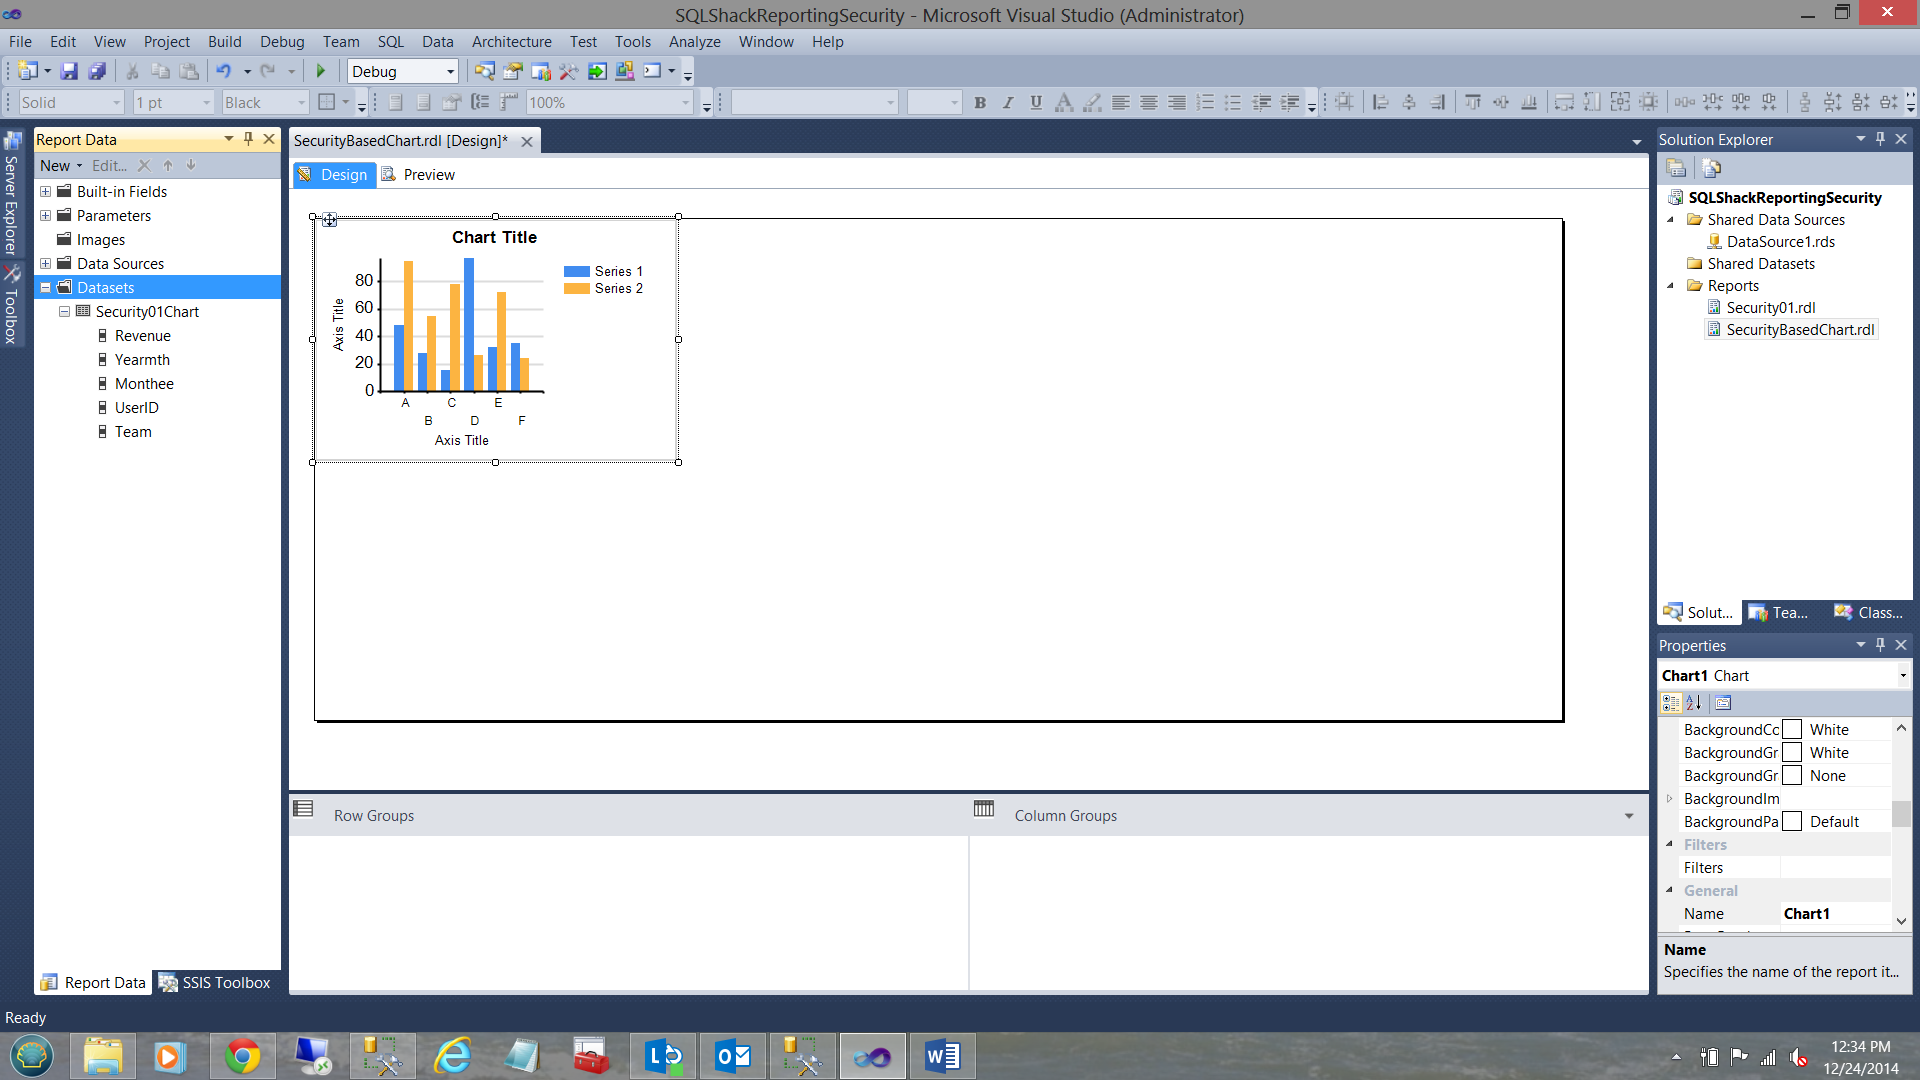
Note our new dataset appears on the left hand side of the screen shot (see above).
请注意,我们的新数据集显示在屏幕截图的左侧(请参见上文)。
We now resize our chart control and assign the dataset (that we have just created) as the source of data for the chart (see below and to the right).
现在,我们调整图表控件的大小,并将刚刚创建的数据集分配为图表的数据源(请参见下面和右边)。
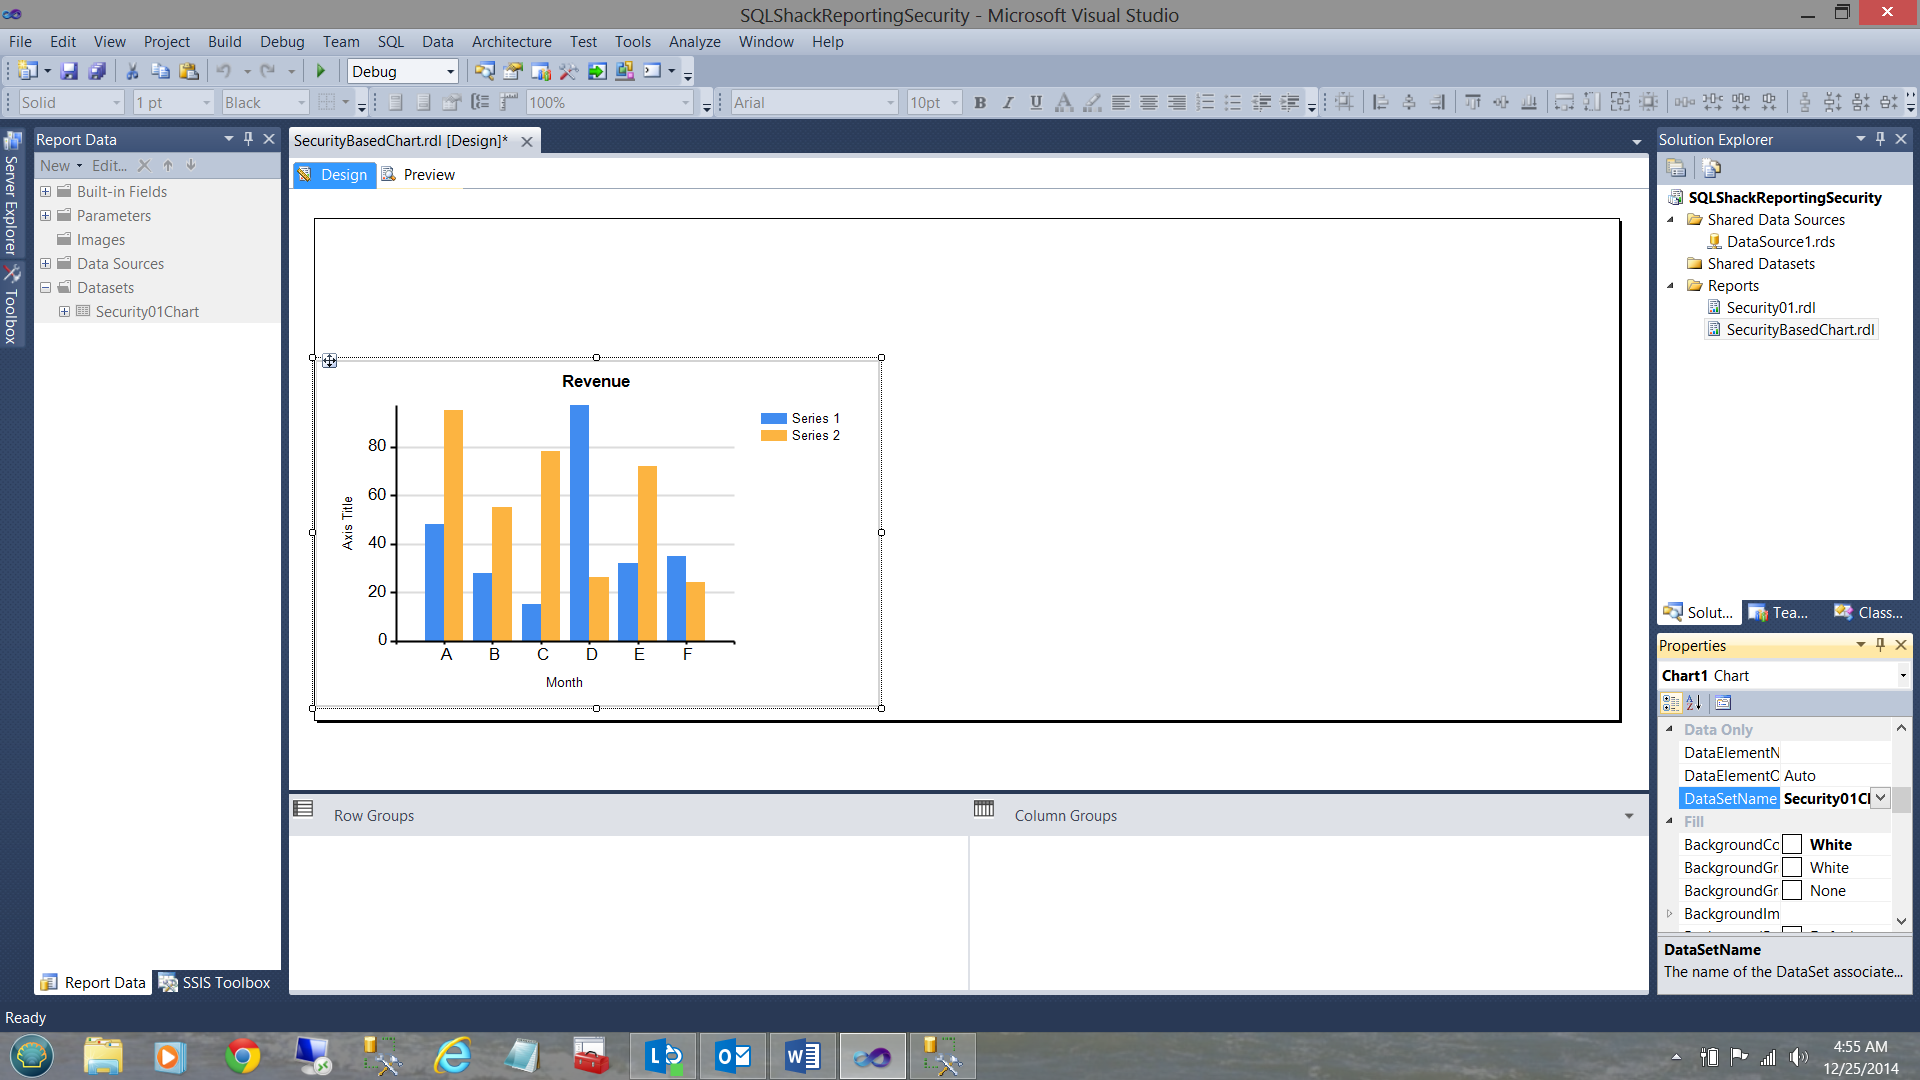
We also add a title to the chart and call it “Revenue”. We set the charts series, values and category groups (See below).
我们还向图表添加标题,并将其称为“收入”。 我们设置图表系列,值和类别组(请参见下文)。
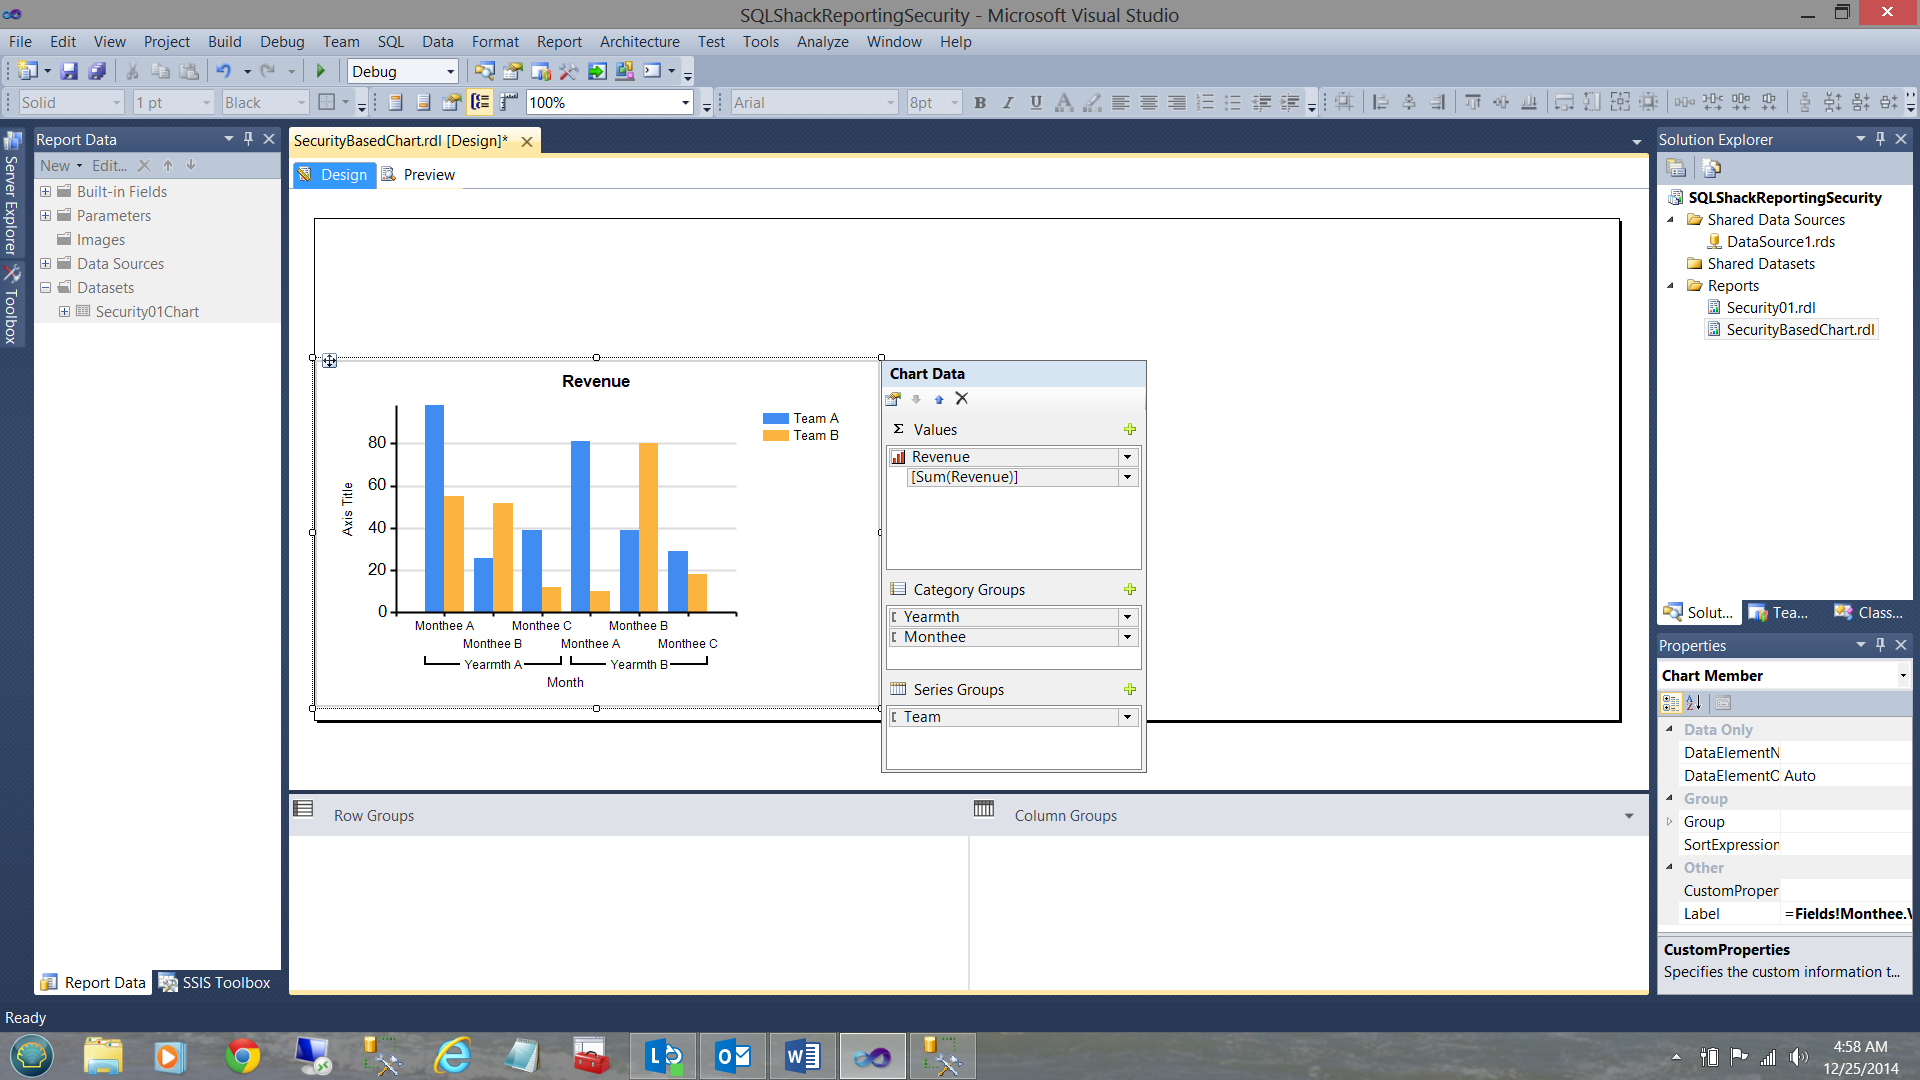
As we have done in past sessions together, we shall be using the “YearMth” field purely as a sorting field and use the “month names” column, “Monthee” as the ‘labels’ for the X axis. Note the way that we prevent the values of “YearMth” from appearing when the report is run (see below).
就像我们在过去的会议中所做的一样,我们将纯粹使用“ YearMth”字段作为排序字段,并使用“ month name”列“ Monthee”作为X轴的“标签”。 请注意我们在运行报告时防止出现“ YearMth”值的方式(请参见下文)。
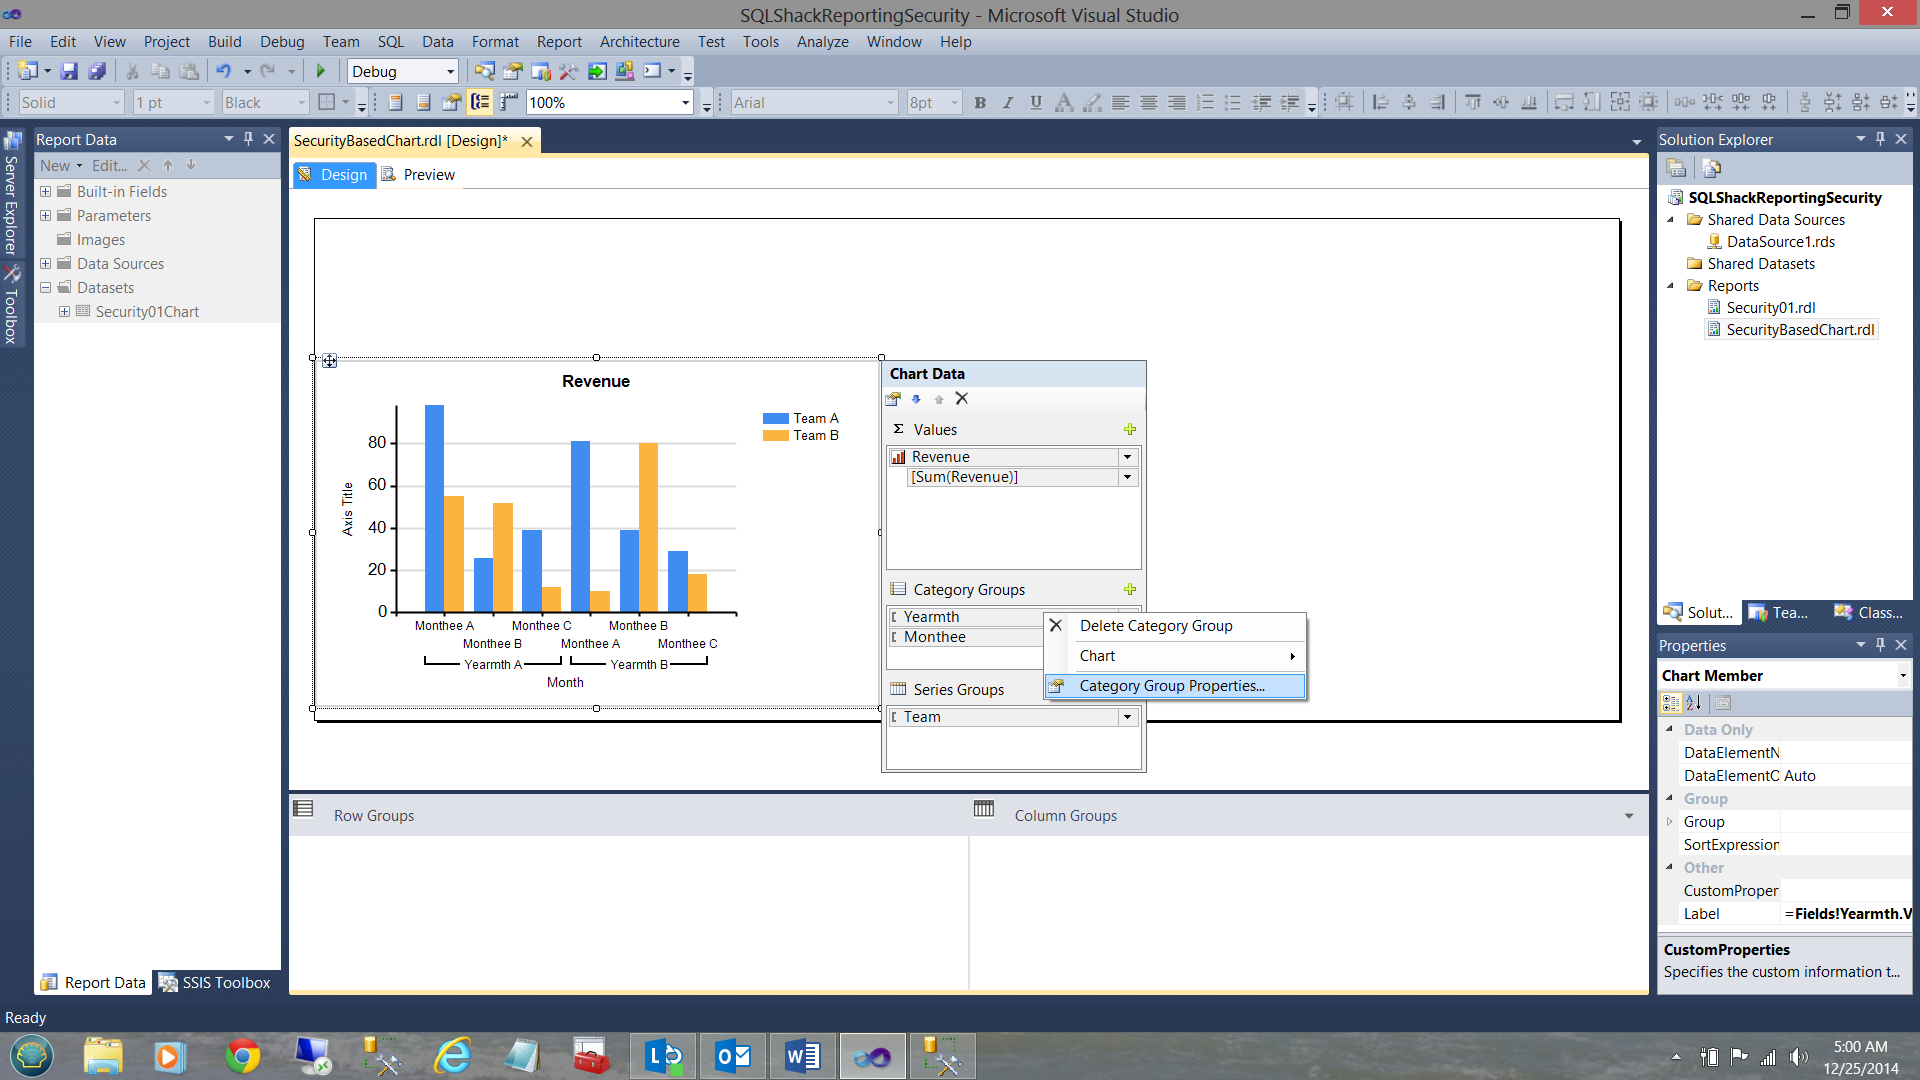
Highlighting “YearMth” and selecting the “Category Group Properties” tab (see above) we bring up the “Category Group Properties” dialog box.
突出显示“ YearMth”并选择“ Category Group Properties”选项卡(见上文),我们将弹出“ Category Group Properties”对话框。
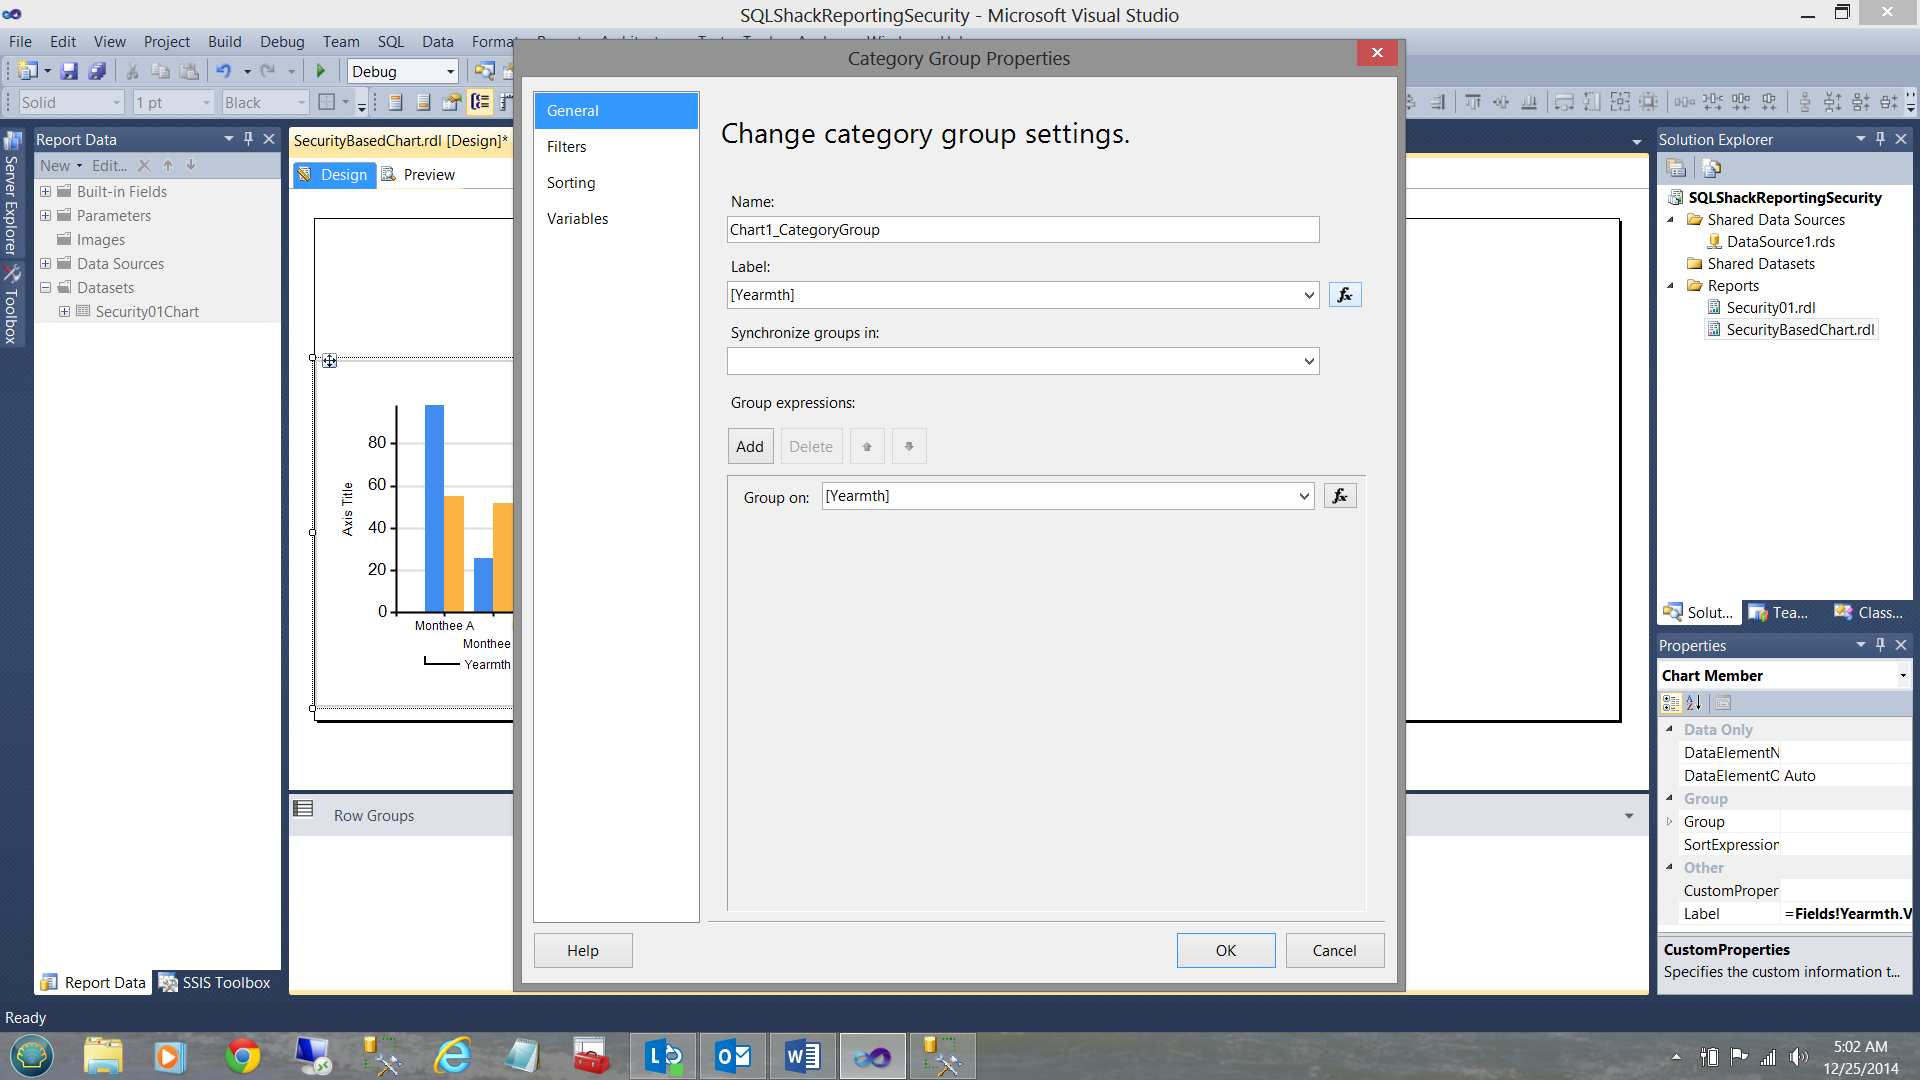
We click the expression box for the “Label” option. The expression box opens.
我们单击“标签”选项的表达式框。 表达式框打开。
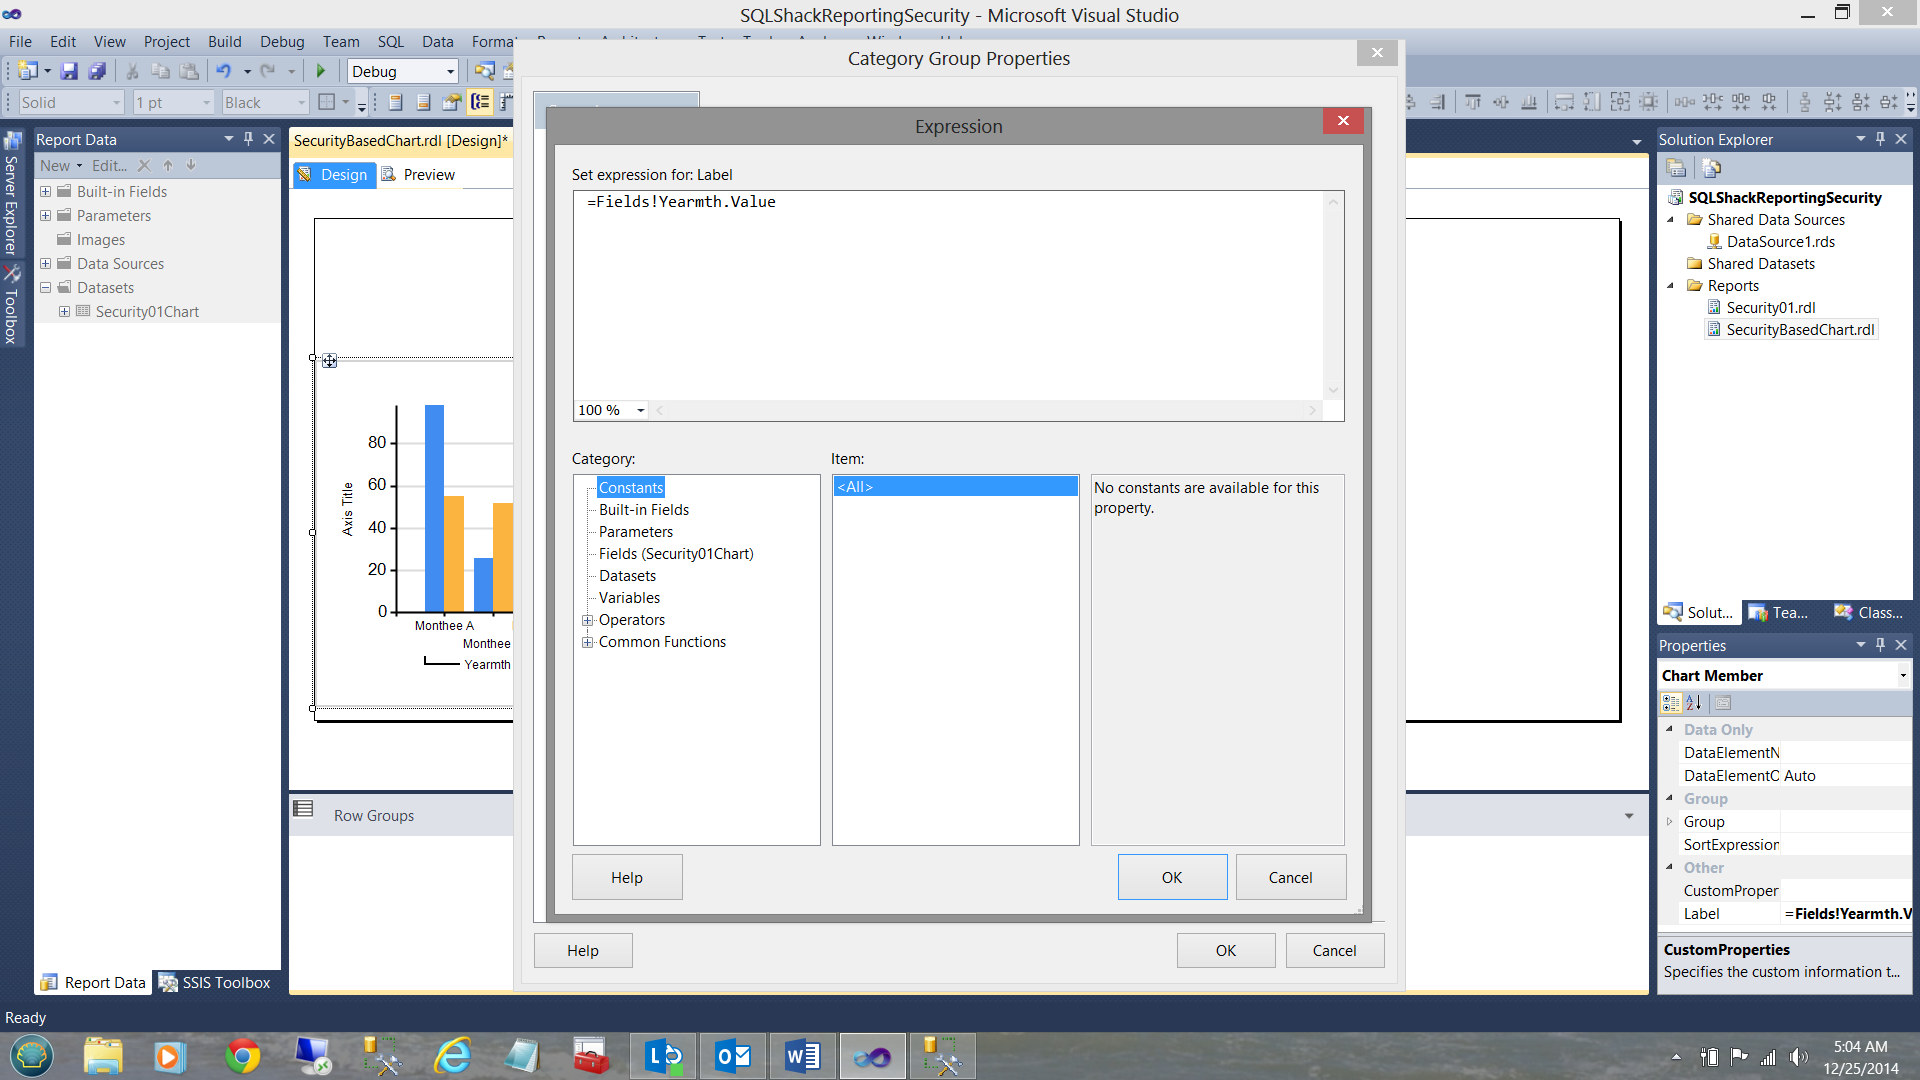
We replace the value “=Fields!Yearmth.Value” with “=Nothing” and Click OK,OK to exit the “Properties” box.
我们将值“ = Fields!Yearmth.Value”替换为“ = Nothing”,然后单击“确定”,“确定”退出“属性”框。
配置必要的参数 ( Configuring the necessary parameters )
While the chart and the necessary data fields are now in place, we must now complete the necessary “wiring” and obtain the user’s login ID and pass that through to the stored procedure thus ensuring that the correct data is extracted and rendered.
当图表和必要的数据字段现在就位时,我们现在必须完成必要的“接线”并获取用户的登录ID, 并将其传递给存储过程,从而确保提取和呈现正确的数据。
We define a Parameter called UserID (see below)
我们定义一个称为UserID的参数(见下文)
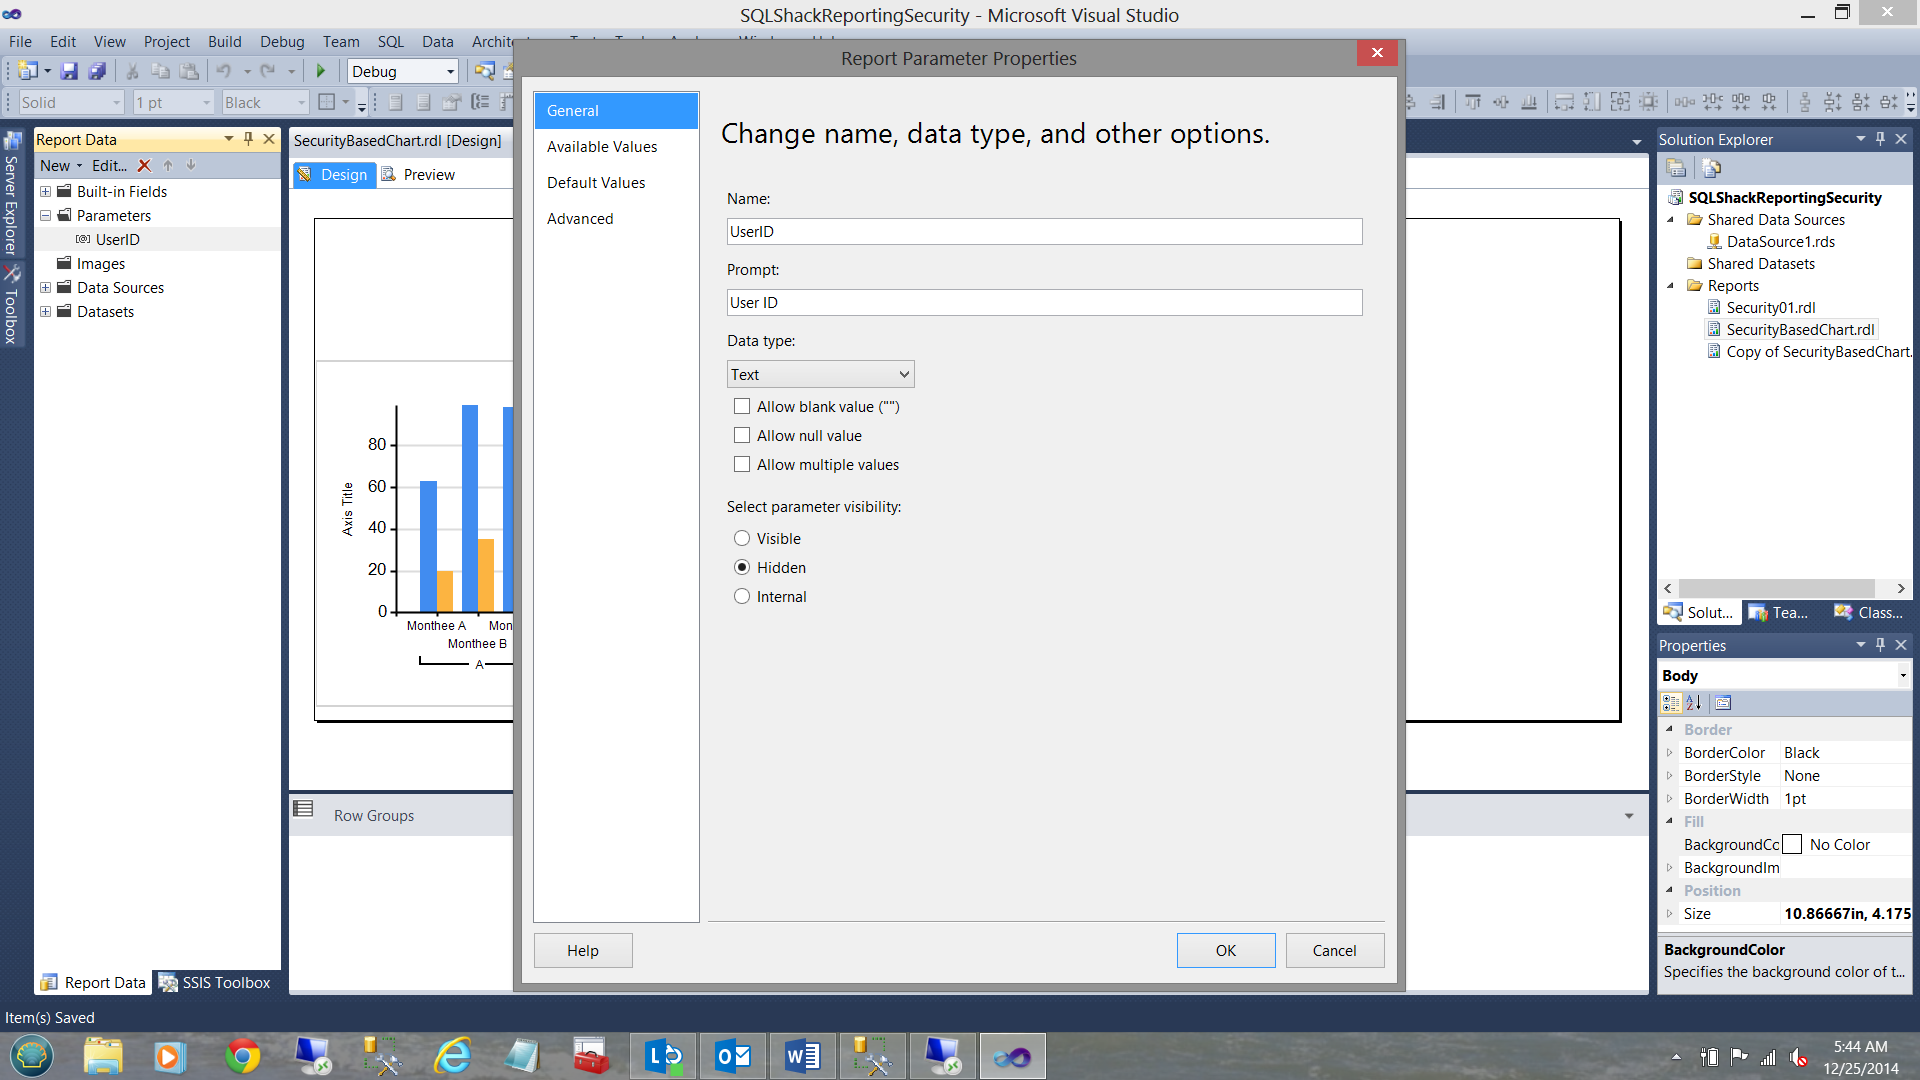
Note that our parameter is going to be “Hidden”.
请注意,我们的参数将为“隐藏”。
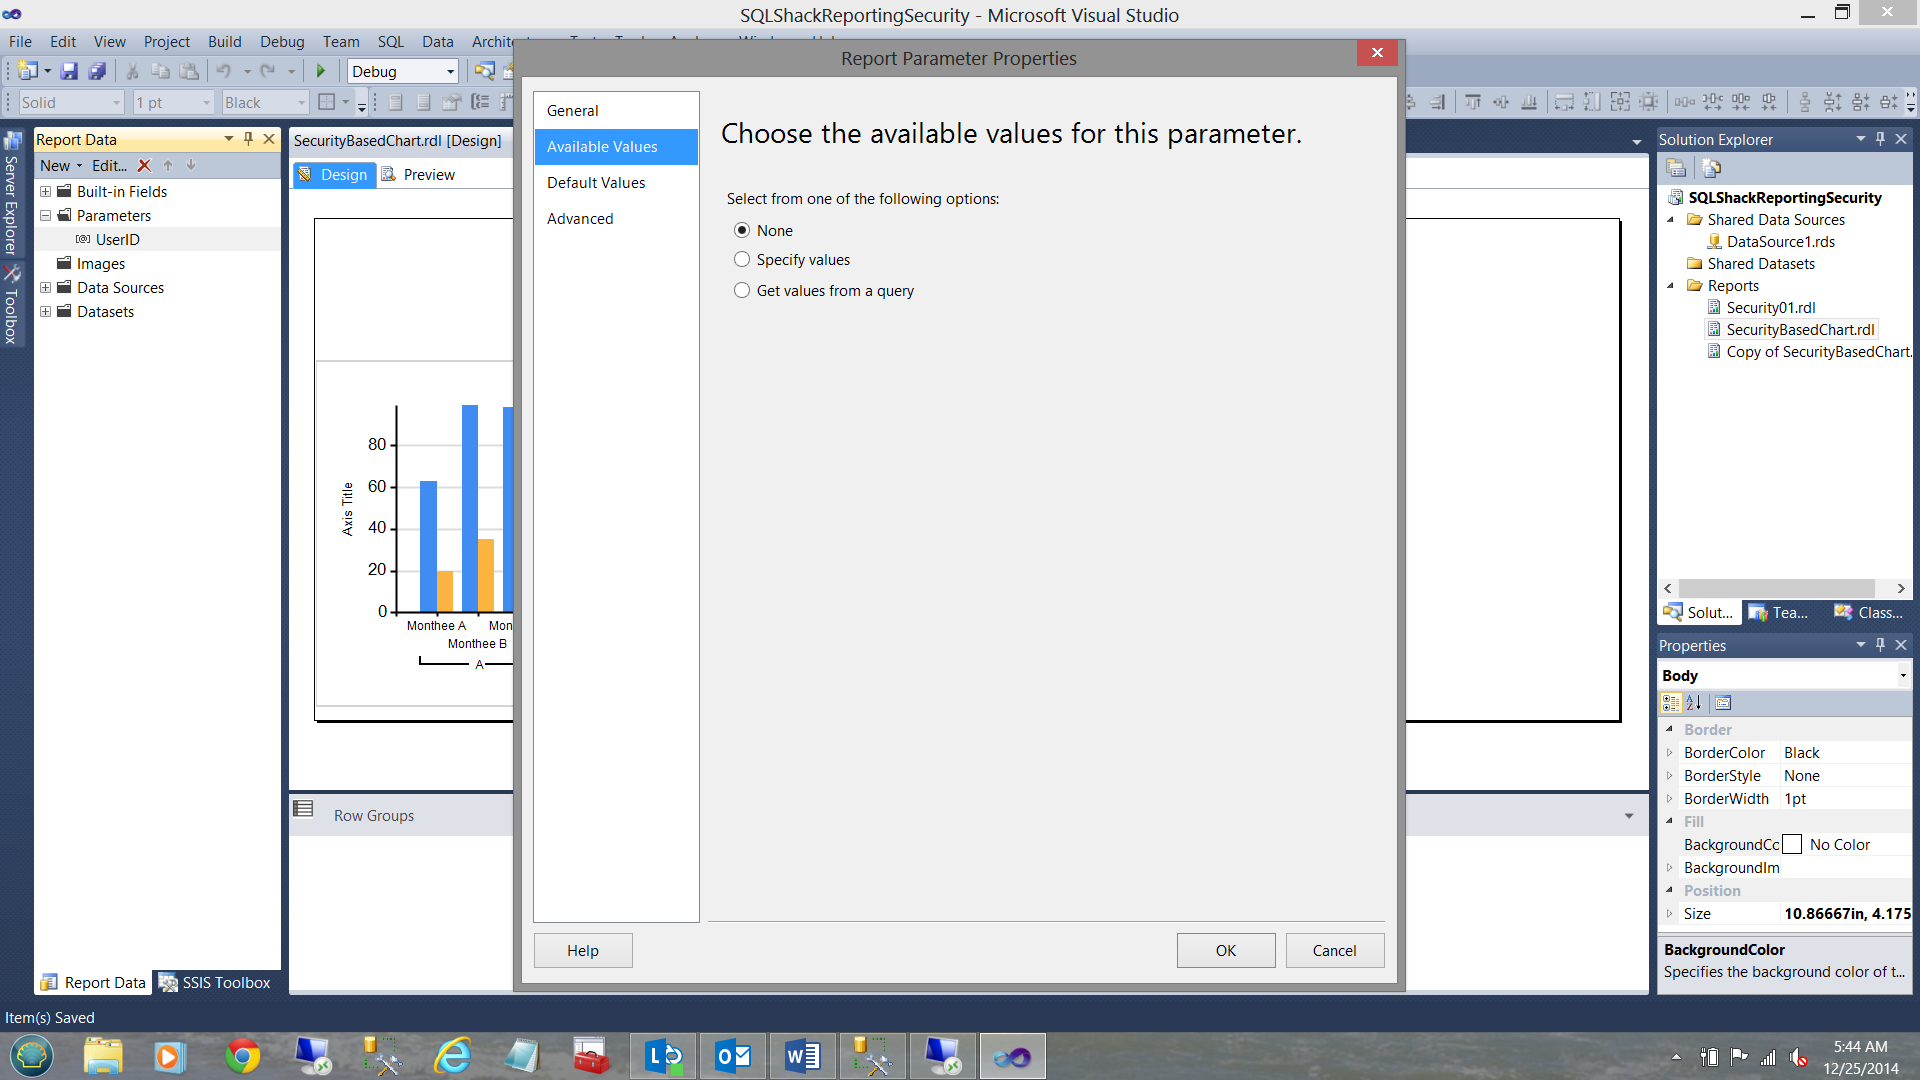
On the “Available Values” tab, we leave the “Select from one of the following options:” radio button ‘as is’.
在“可用值”选项卡上,我们保留“从以下选项之一中选择:”单选按钮“按原样”。
Moving to the “Default Values” tab, we are going to set a default.
转到“默认值”标签,我们将设置一个默认值。

We click on the “Specify values” radio button and click the “Add” and click the expressions box to open the “Expression” editor.
我们单击“指定值”单选按钮,然后单击“添加”,然后单击表达式框以打开“表达式”编辑器。
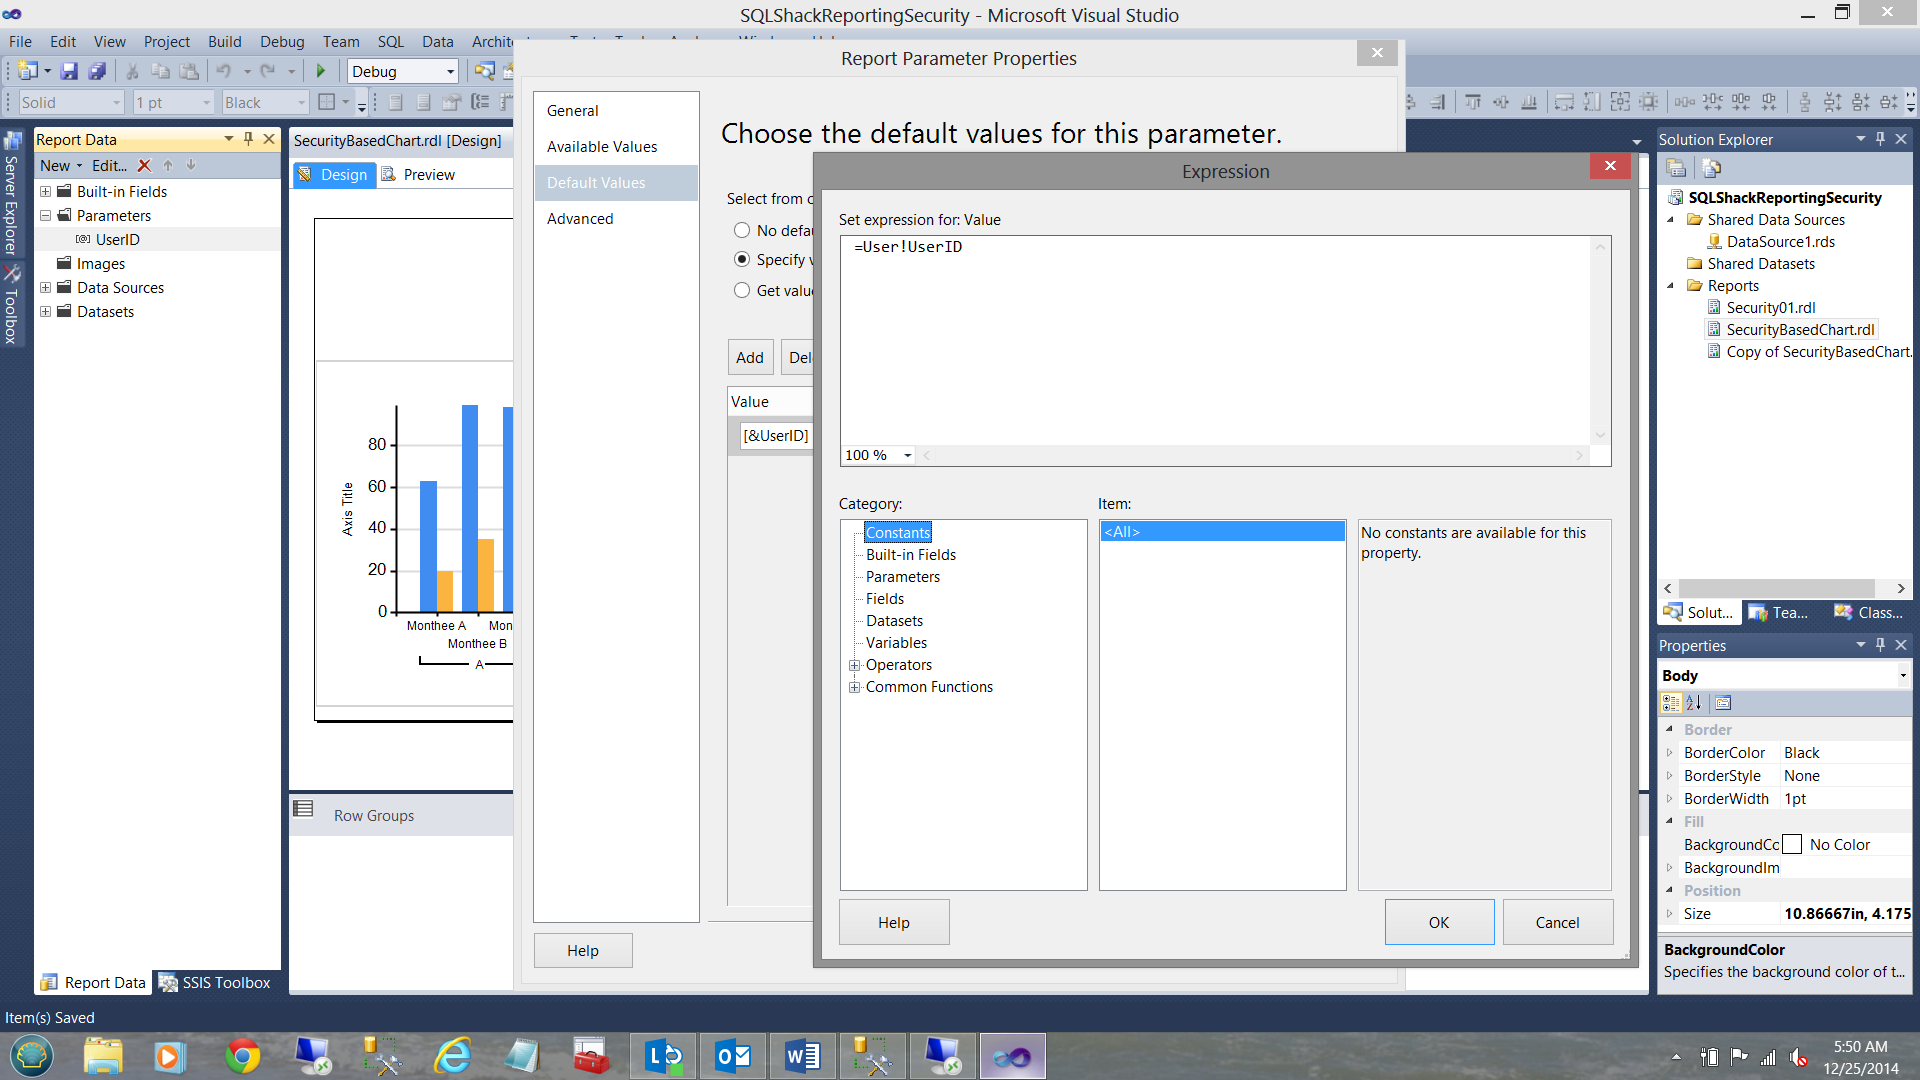
The expressions box opens and we add “ =User!UserID” (see above). We click OK and OK to exit the “Report Parameter Properties” box.
表达式框打开,我们添加“ = User!UserID ”(请参见上文)。 我们单击“确定”,然后单击“确定”退出“报表参数属性”框。
Moving to our dataset, we right click on the dataset name and open its properties dialog box.
移至数据集,我们右键单击数据集名称,然后打开其属性对话框。
We click on the “Parameters” tab.
我们单击“参数”选项卡。
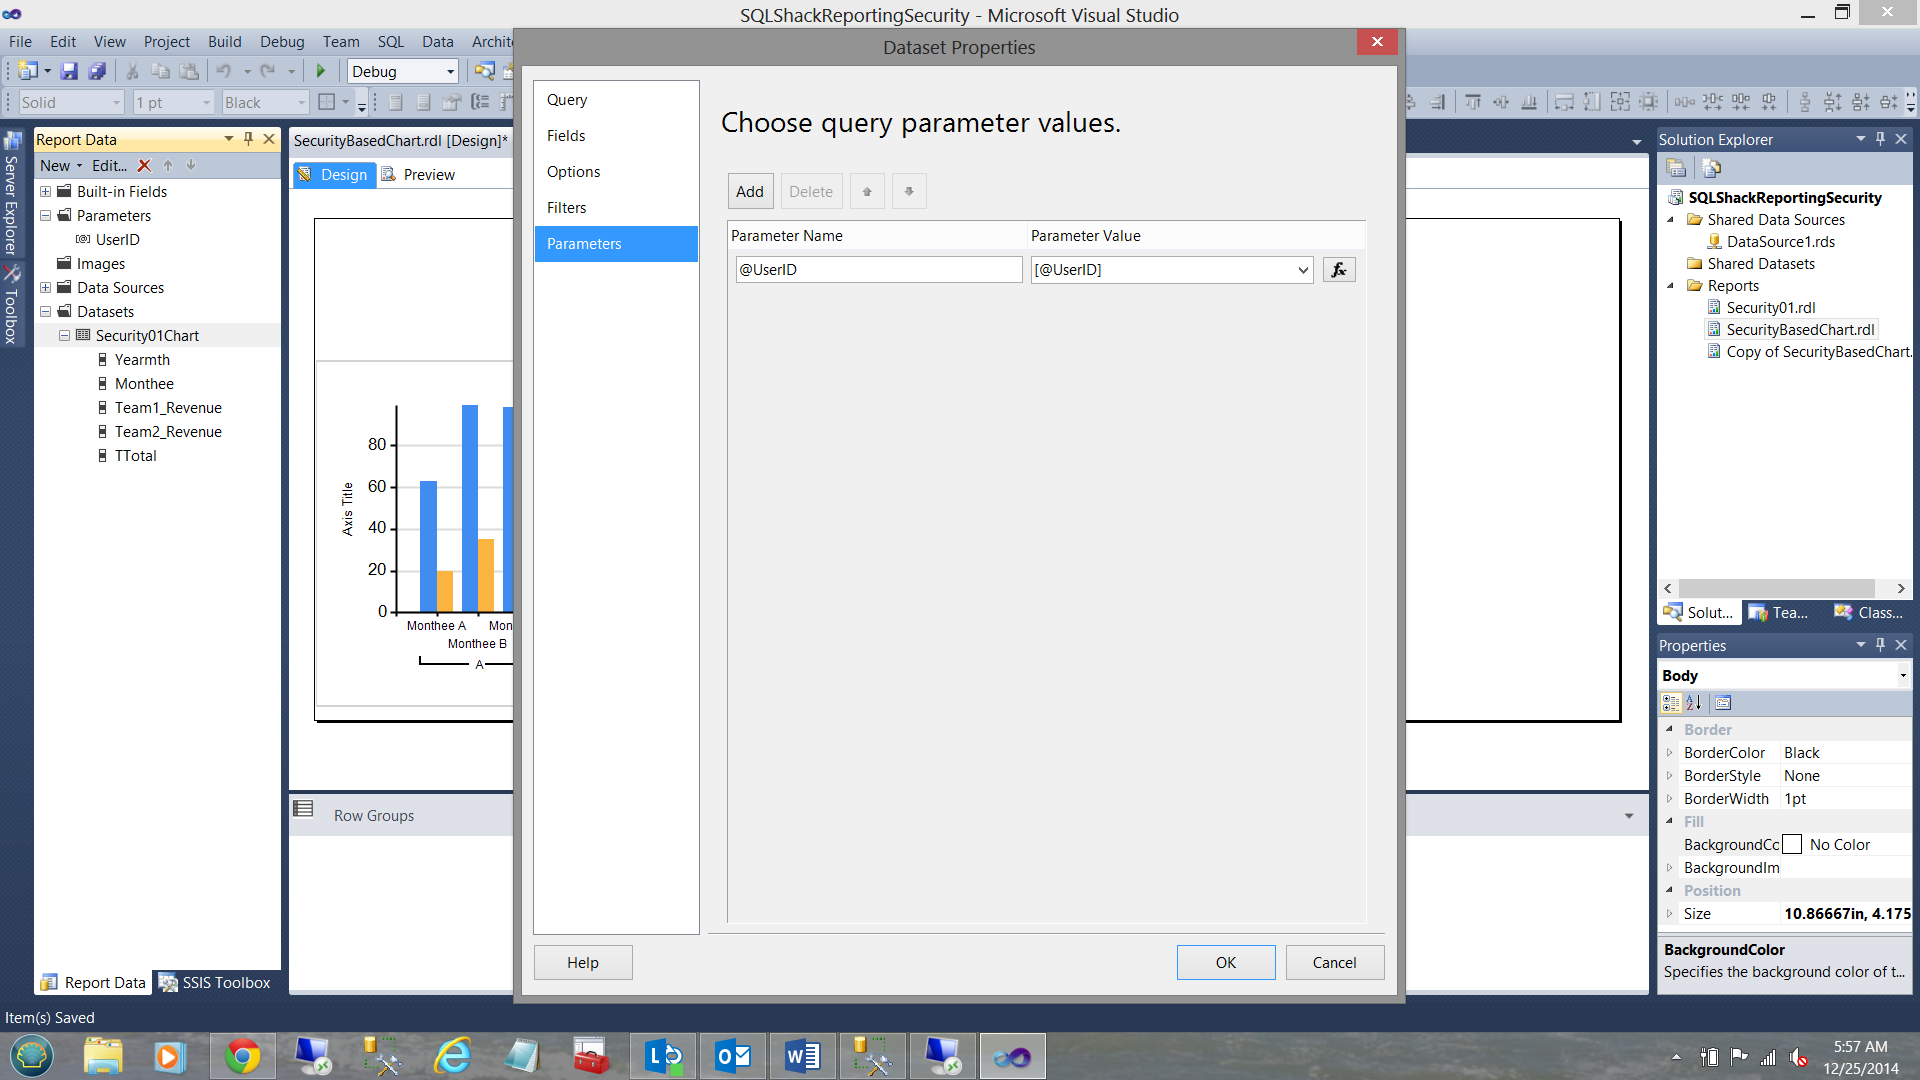
Should our parameter @UserID not be there, then we must select the “Add” button to add the parameter @UserID (see above).
如果我们的参数@UserID不存在,那么我们必须选择“添加”按钮以添加参数@UserID(请参见上文)。
Let us now run our report to see the results.
现在让我们运行报告以查看结果。
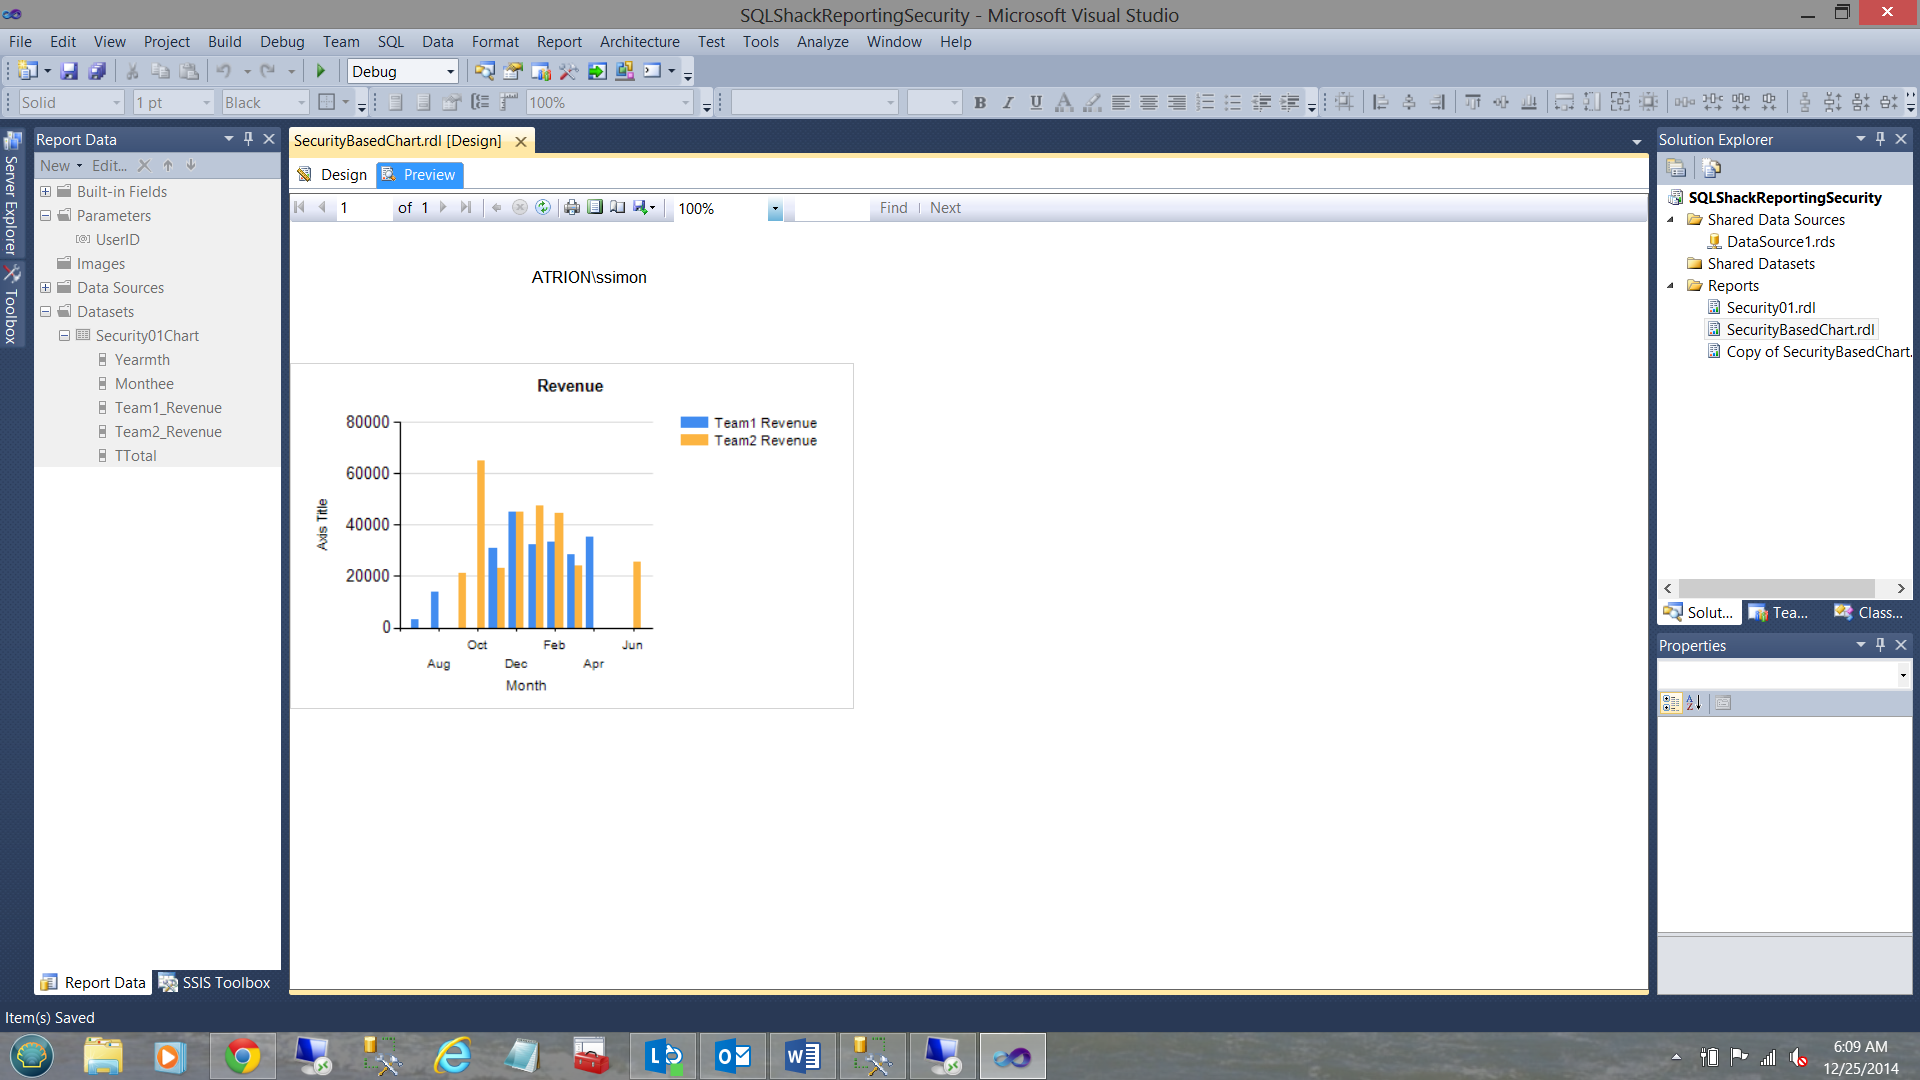
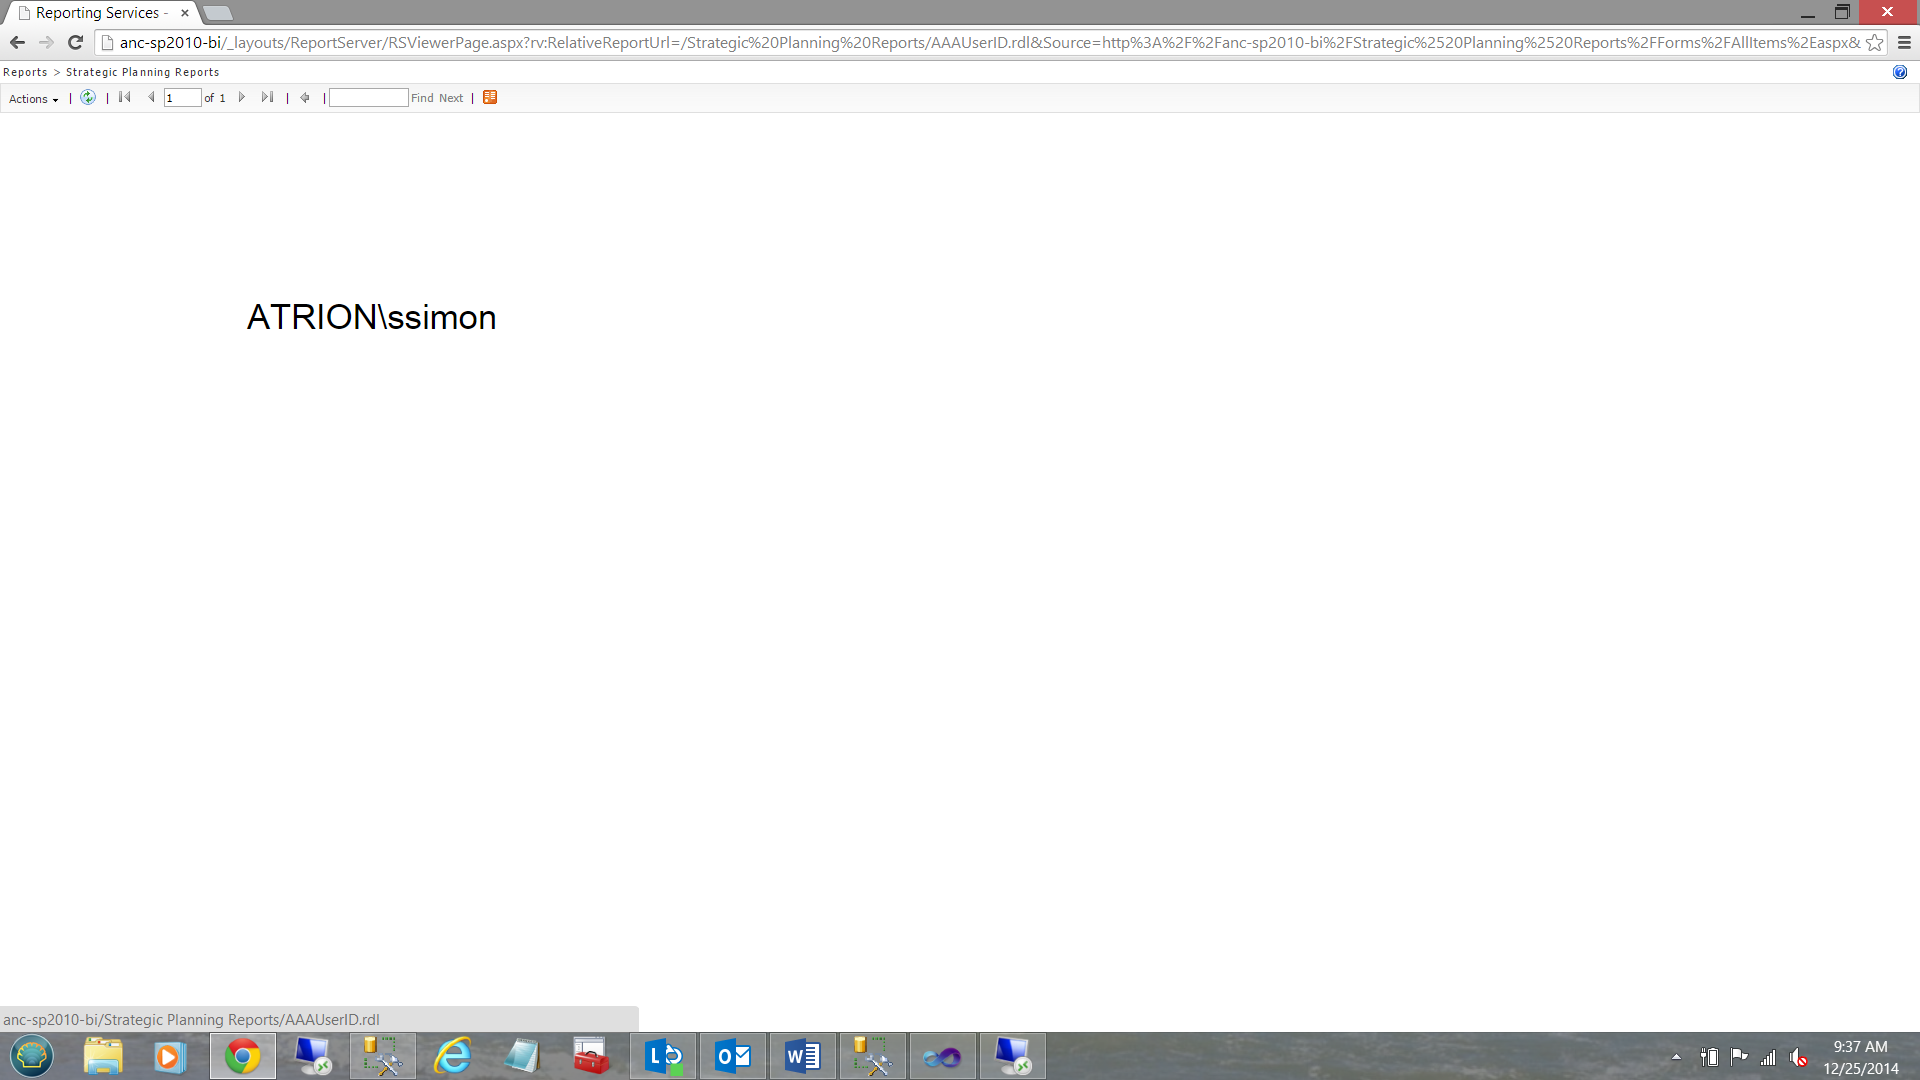
The reader will note that I inserted a text box above the chart, to display the value of @UserID (see above).
读者会注意到,我在图表上方插入了一个文本框,以显示@UserID的值(请参见上文)。
This obviously would NOT be there within the production environment and going forward, I have removed this text box from further screen shots.
在生产环境中显然不会出现这种情况,并且以后,我从进一步的屏幕截图中删除了此文本框。
“重新布置家具” ( “Re-arranging the furniture” )
Prior to adding our matrix based report, we should really re-arrange the controls that we currently show upon our screen.
在添加基于矩阵的报告之前,我们应该真正重新排列当前在屏幕上显示的控件。
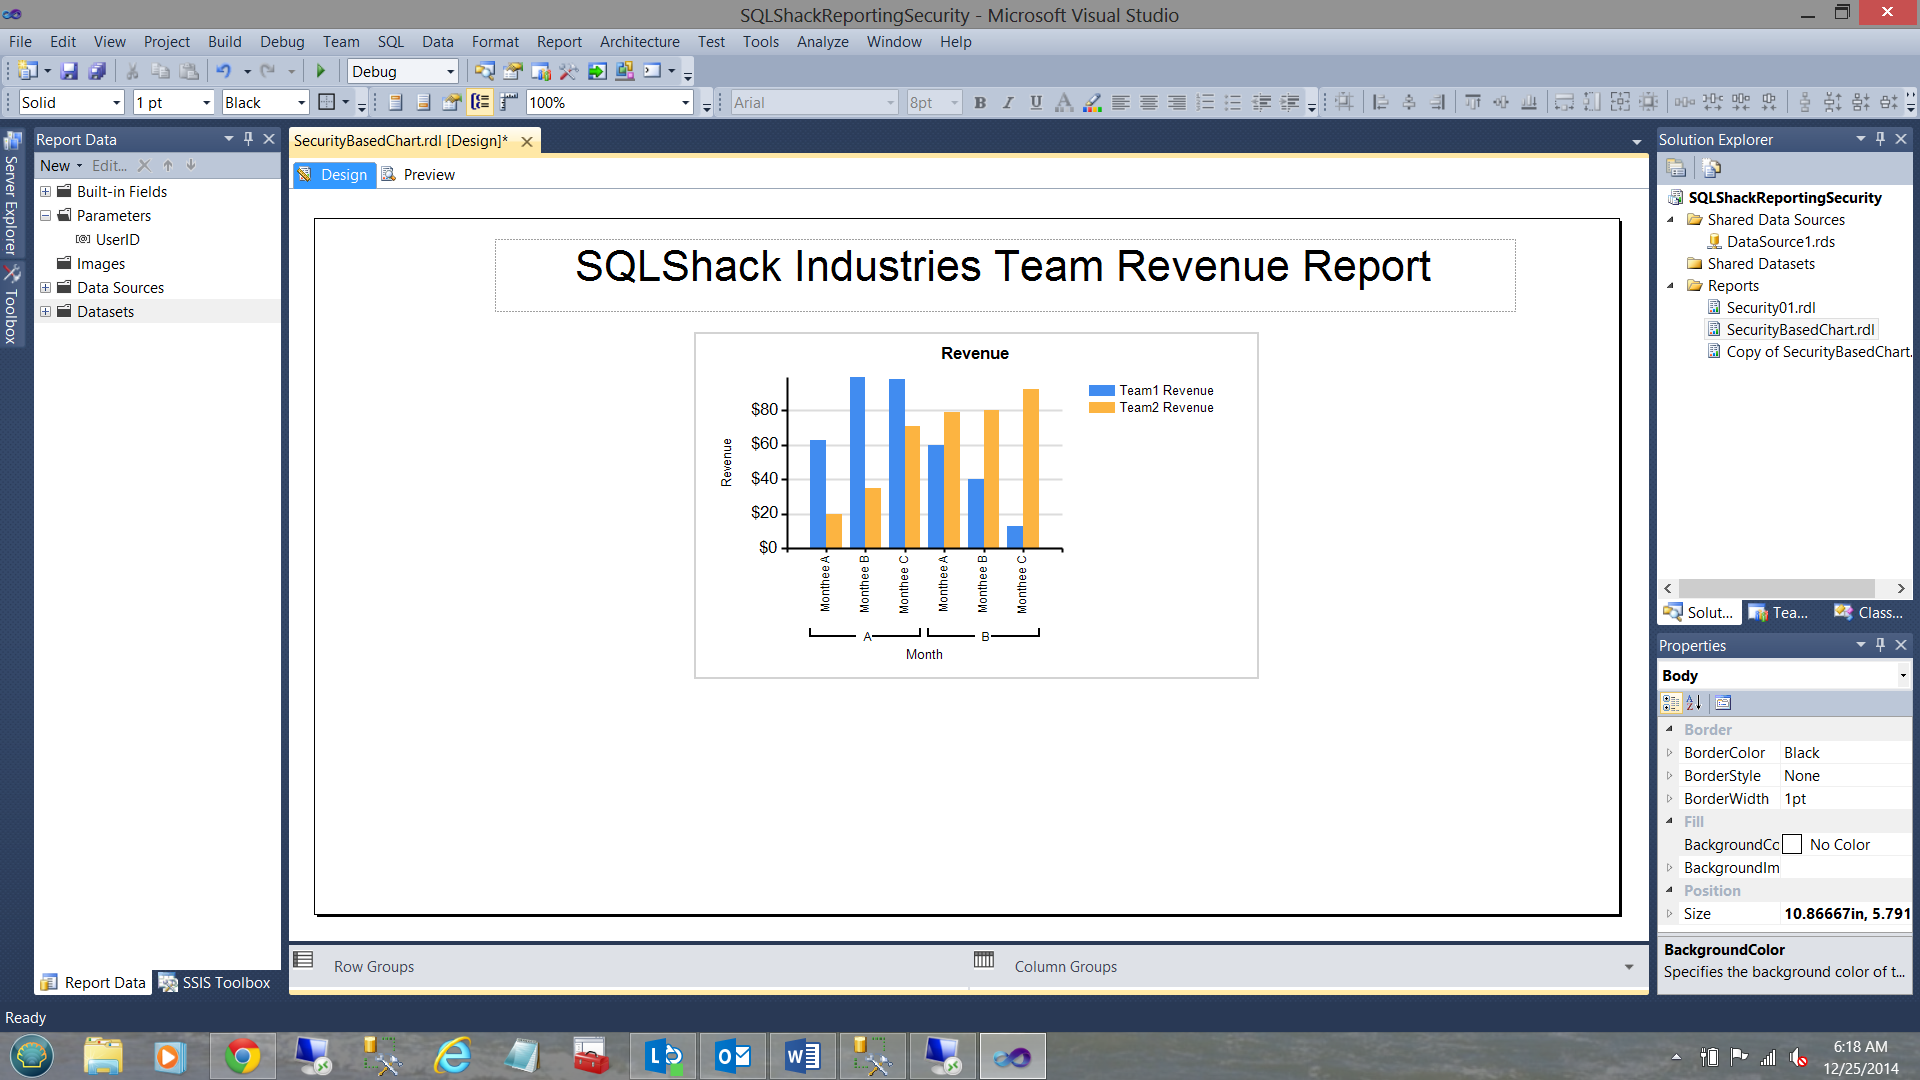
I have taken the liberty of adding a text box above the chart and I have given my report the title “SQLShack Industries Team Revenue Report”.
我随意在图表上方添加一个文本框,并给我的报告标题为“ SQLShack行业团队收入报告”。
Further, I have labelled the Y axis as “Revenue” and set the property to currency (see above).
此外,我将Y轴标记为“收入”,并将该属性设置为货币(请参见上文)。
向混合添加矩阵 ( Adding a matrix to the mix )
As you will remember, we created two store procedures. The second one was in the format that could be utilized with a matrix. We are now going to add that matrix to our report.
您会记得,我们创建了两个存储过程。 第二个是可以与矩阵一起使用的格式。 现在,我们将该矩阵添加到我们的报告中。
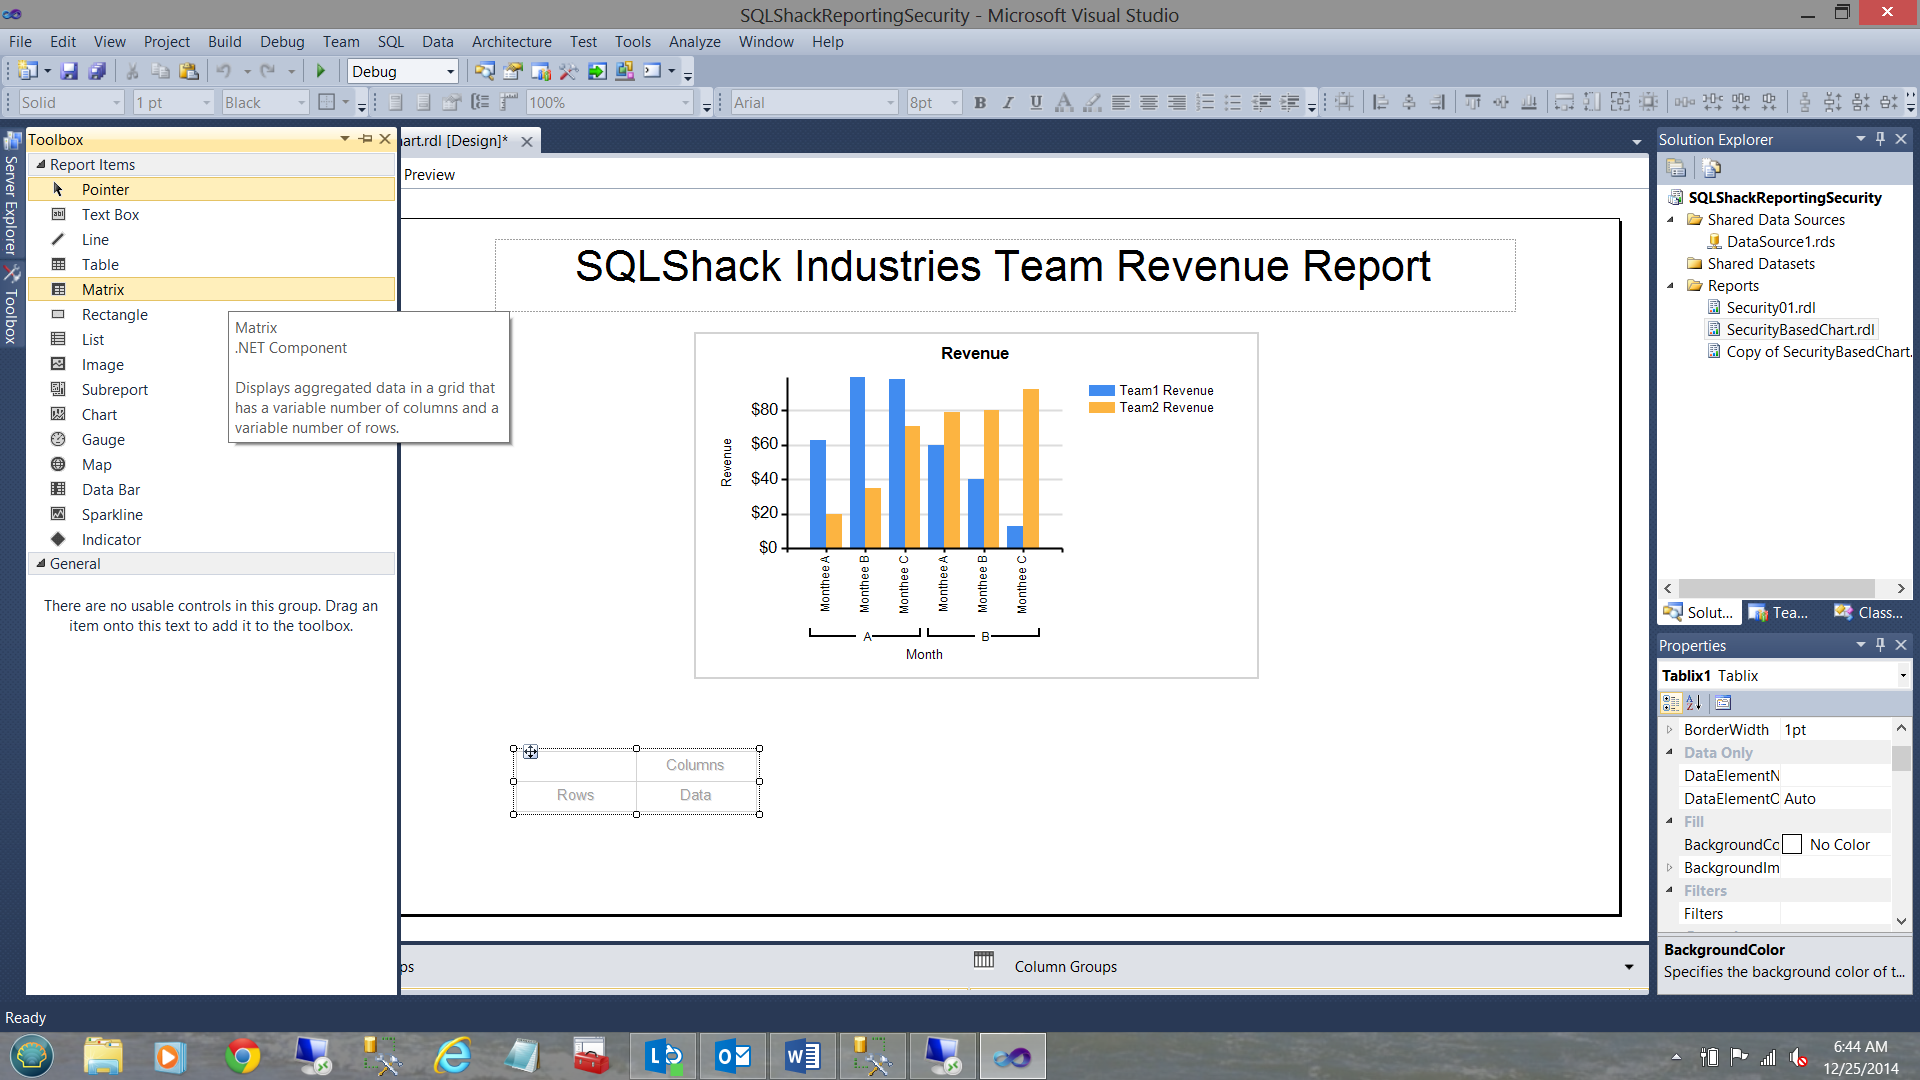
We drag a “Matrix Report Item” onto the drawing surface.
我们将“矩阵报告项目”拖到绘图表面上。
In a similar manner to which we created the chart dataset (above), we create an additional dataset for the matrix. The question that DOES arise is, “Could we have created one data set for both?” The answer is yes HOWEVER, I prefer to keep the processes as simple as possible as this gives you added flexibility to handle ‘change’.
以类似于创建图表数据集(上文)的方式,我们为矩阵创建了另一个数据集。 确实出现的问题是:“我们能为两者创建一个数据集吗?” 答案是肯定的,但是我更喜欢保持流程尽可能简单,因为这为您提供了更大的灵活性来处理“变更”。
The screen shot above shows the dataset for the Matrix.
上面的屏幕快照显示了Matrix 的数据集 。
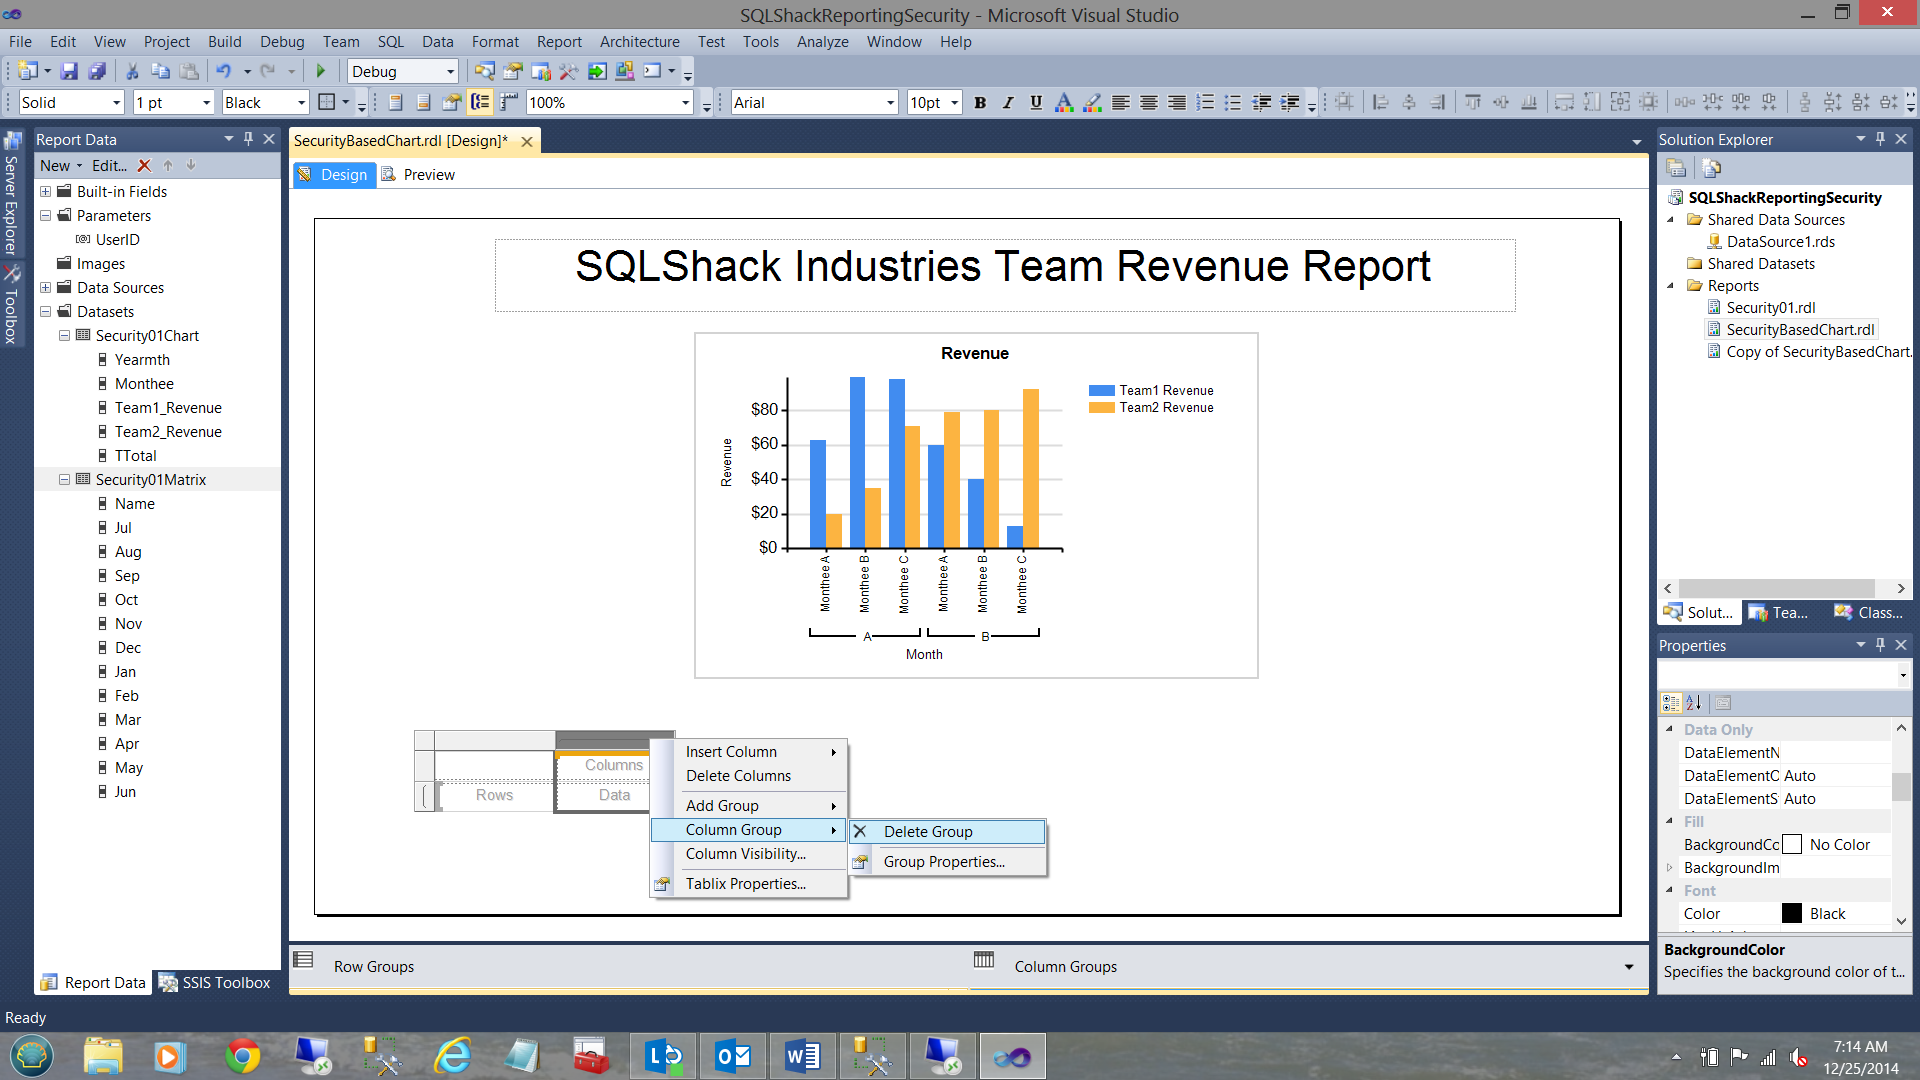
Prior to configuring the matrix, we remove the “Column Grouping” as shown above (middle bottom).
在配置矩阵之前,我们如上图所示(中间底部)删除了“列分组”。
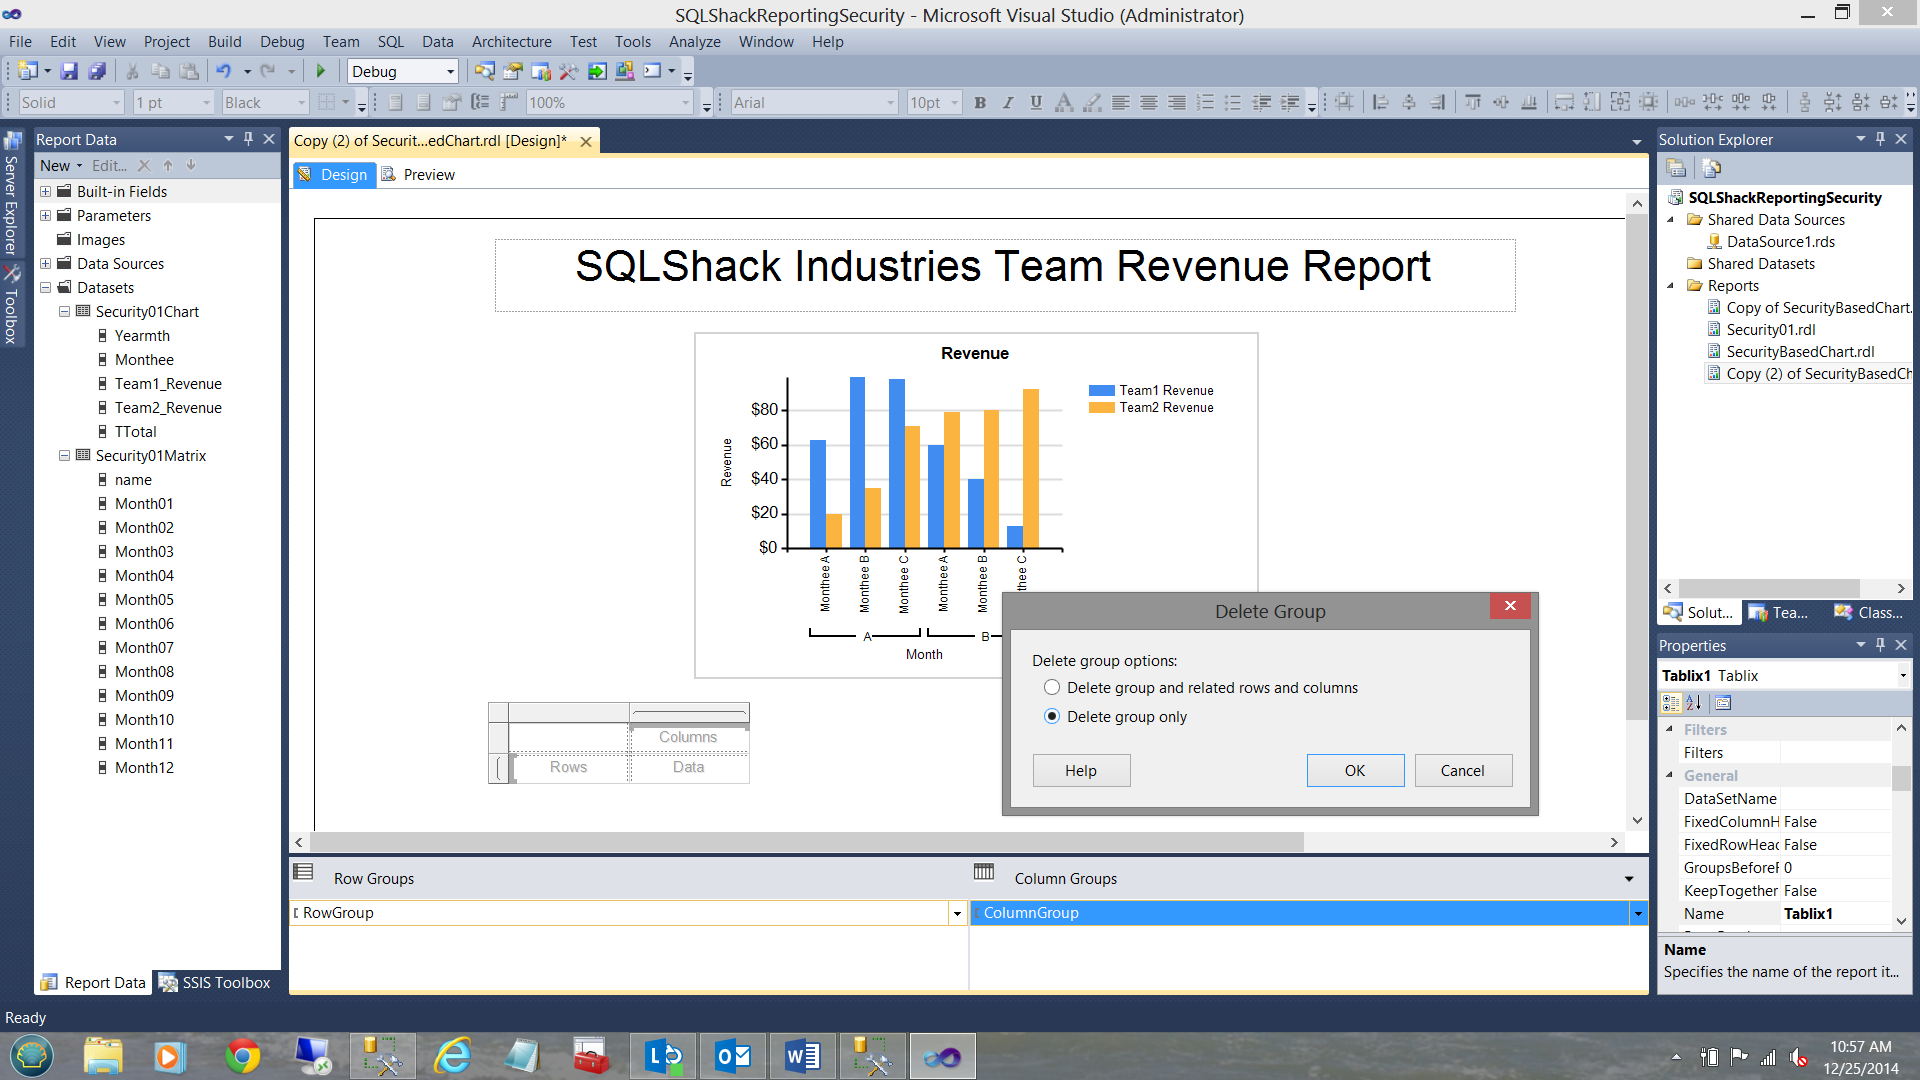
Further we are ONLY removing the Grouping and NOT the data (see above).
此外,我们仅删除分组,而不删除数据(请参见上文)。
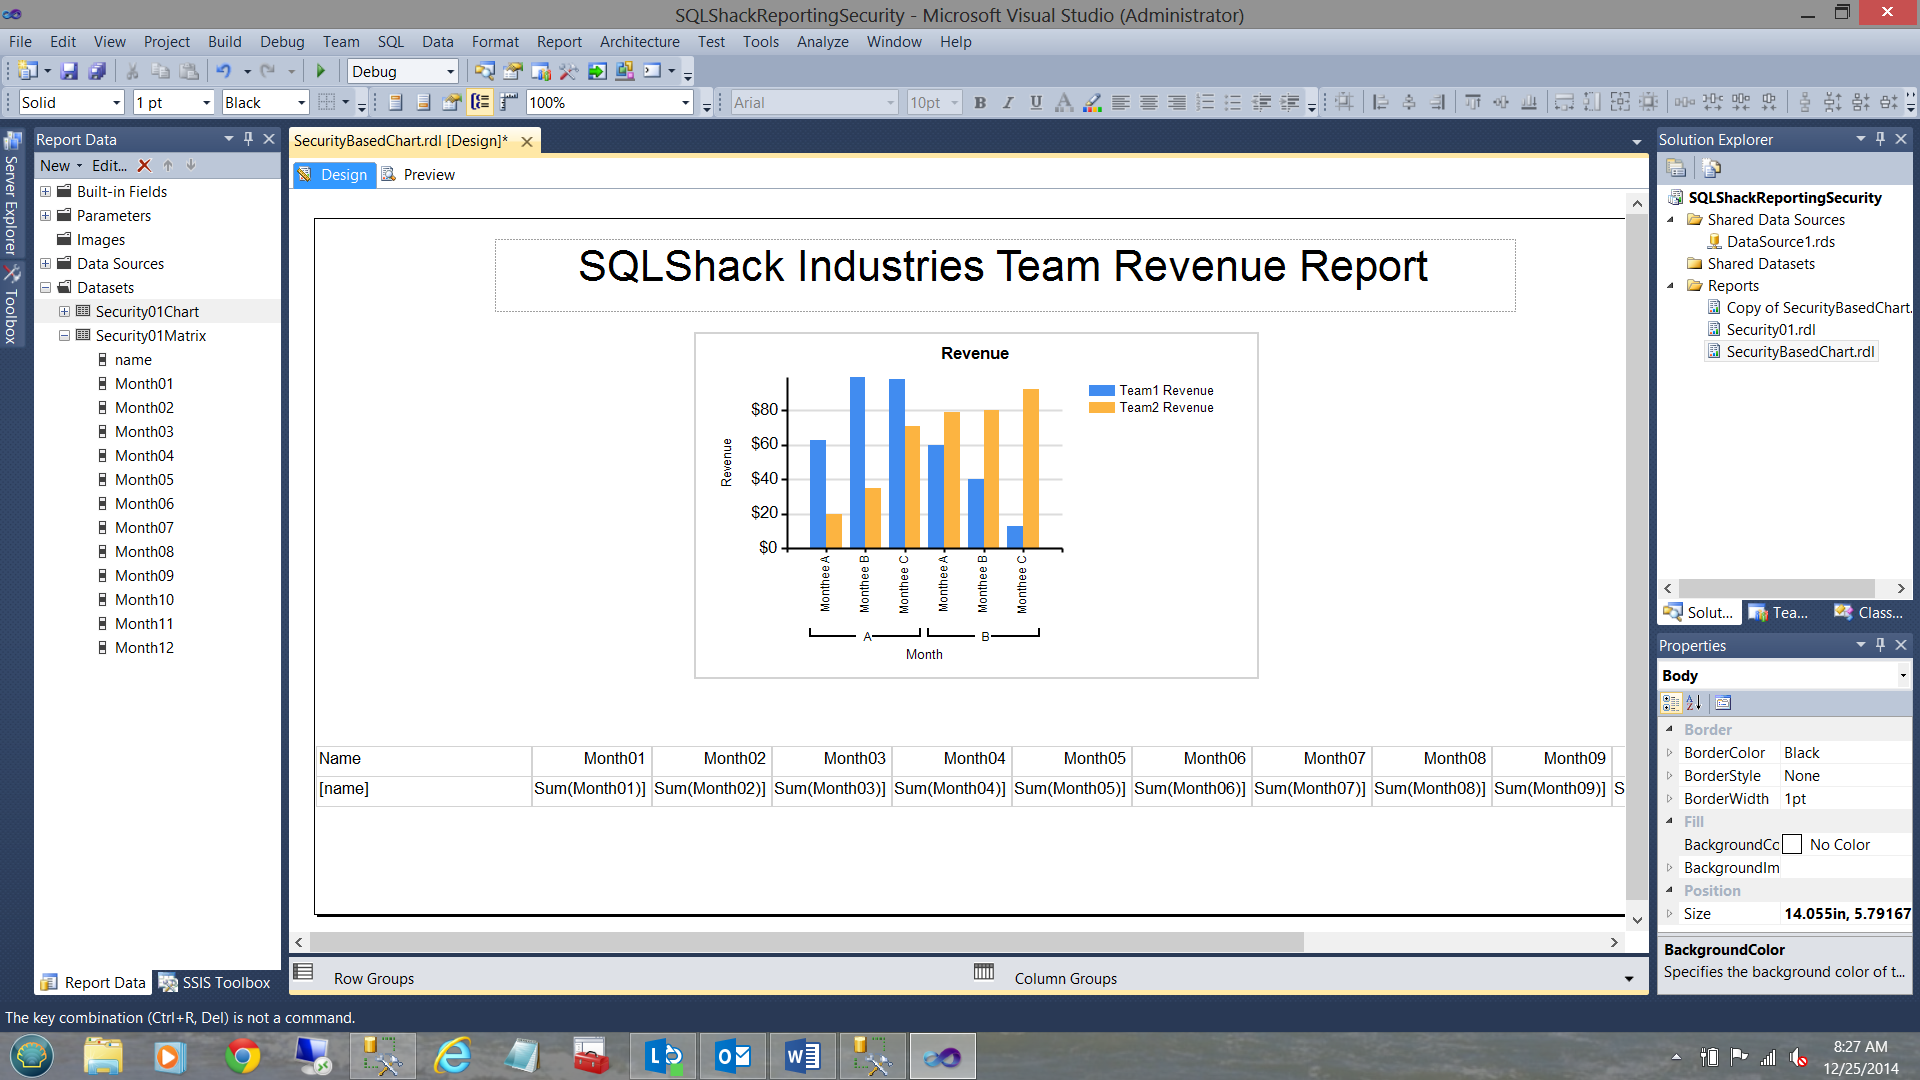
Note that the left most column of the matrix is the “grouping“column. We are going to use the column “Name” (which contains the Team names) as the grouping field (see above). Further, we add eleven more columns to ensure that we have enough columns for the twelve months of the year.
请注意,矩阵的最左列是“分组”列。 我们将使用“名称”列(包含团队名称)作为分组字段(请参见上文)。 此外,我们增加了11列,以确保一年中的12个月中有足够的列。
We are now going change the column headers to something more meaningful. We shall also right orient the revenue fields, in addition to adding fill to the matrices’ cells (see below).
现在,我们将列标题更改为更有意义的内容。 除了在矩阵的单元格中添加填充(参见下文)之外,我们还应正确调整收入字段的方向。
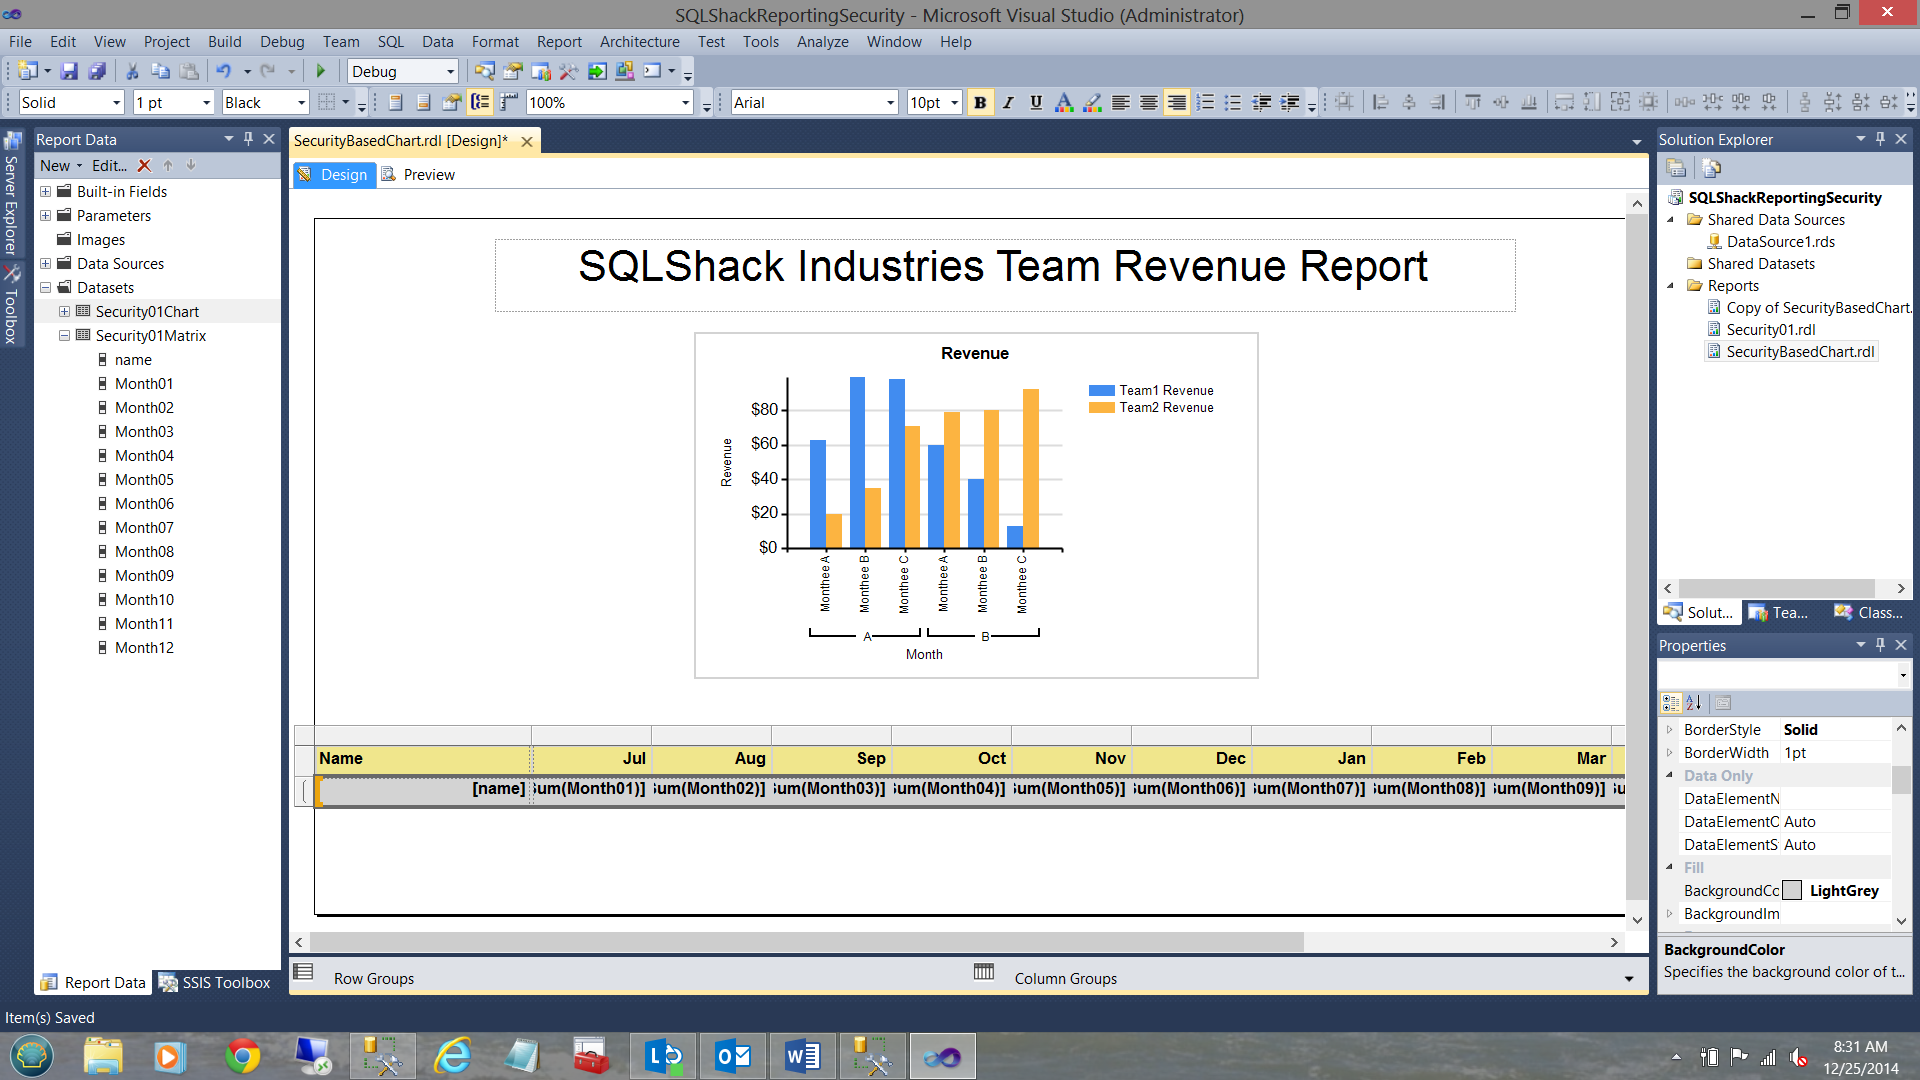
When we run our report for “ATRION\ssimon”, we find the following (see below).
当我们为“ ATRION \ ssimon”运行报告时,会发现以下内容(请参见下文)。
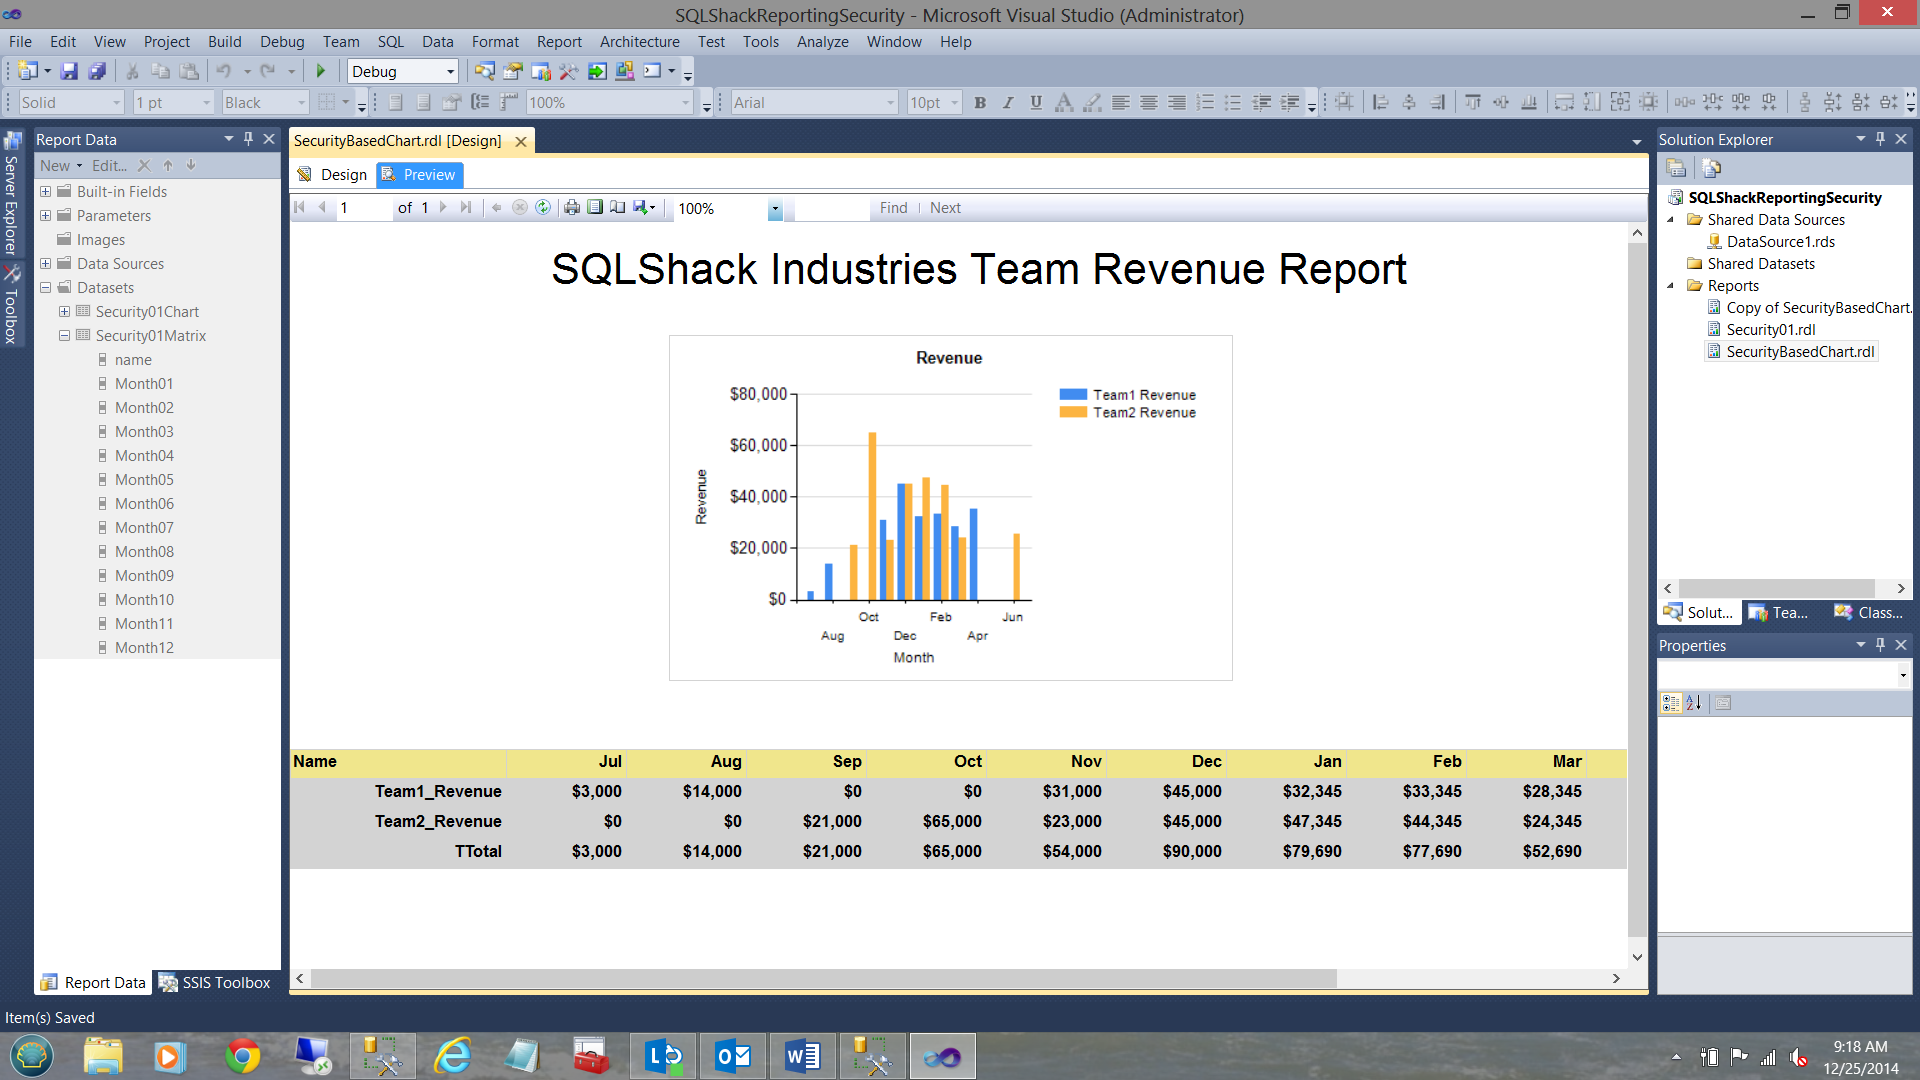
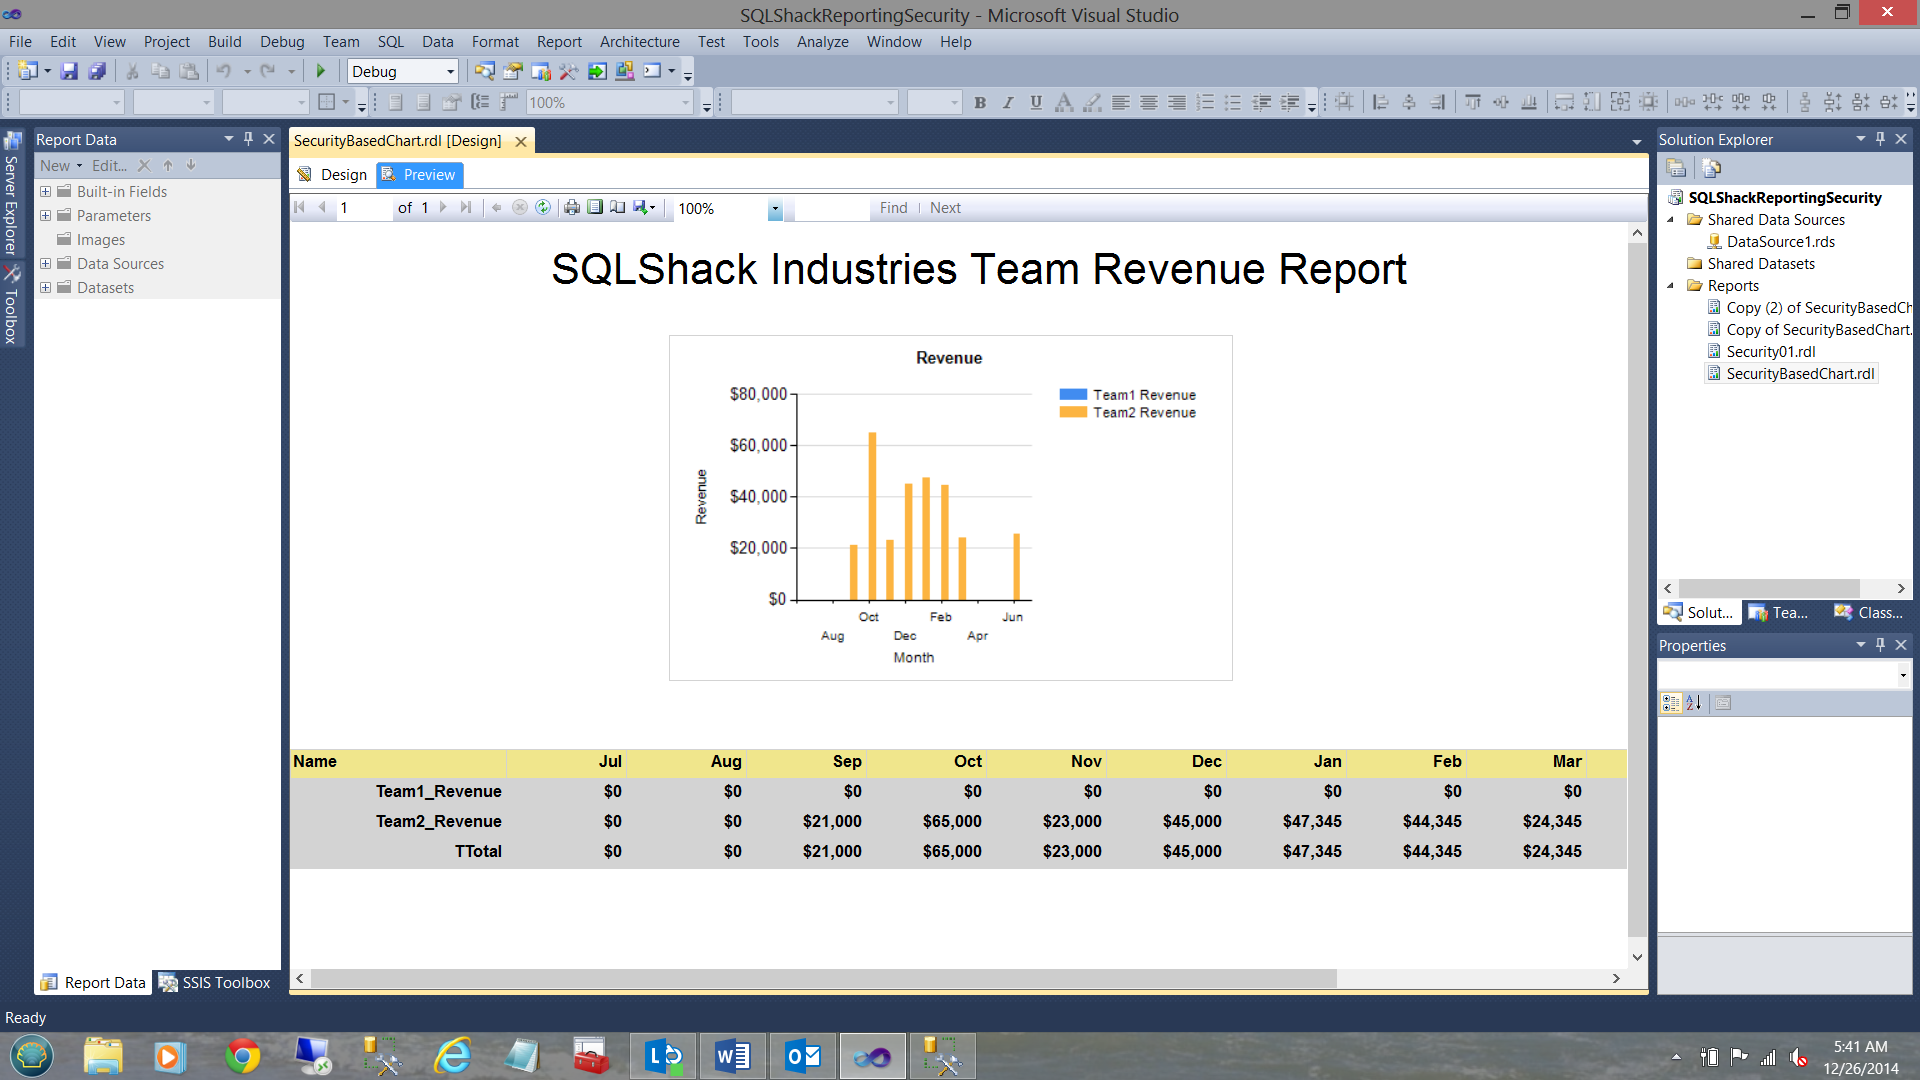
When we run our report for “ATRION\SQLDB”, we find the following (see below).
当我们为“ ATRION \ SQLDB”运行报告时,我们发现以下内容(见下文)。
结论 ( Conclusions )
We have completed the work that SQLShack Industries’ management had requested. The data rendered within the reports reflected the data permissions that each group/team had.
我们已经完成了SQLShack Industries管理层要求的工作。 报告中提供的数据反映了每个组/团队所具有的数据权限。
Whilst this technique is aimed for internal business consumption, it is far from the type of security that one would implement for users coming in through the firewall.
尽管此技术是针对内部业务消费的,但它远非为通过防火墙进入的用户实施的安全性。
As always, should you have any questions or concerns, please feel free to contact me.
与往常一样,如果您有任何疑问或疑虑,请随时与我联系。
In the interim, Happy Programming!!
在此期间,快乐编程!!
阿登达 ( ADDENDA A )
The code sample for the matrix may be seen below:
矩阵的代码示例如下所示:
/****** Script for SelectTopNRows command from SSMS  ******/
use [SQLShackFinancial]
go
--IF OBJECT_ID(N'tempdb..#rawdata1') IS NOT NULL
--BEGIN
--     DROP TABLE #rawdata1
--END
--IF OBJECT_ID(N'tempdb..#rawdata2') IS NOT NULL
--BEGIN
--     DROP TABLE #rawdata2
--END
--IF OBJECT_ID(N'tempdb..#rawdata3') IS NOT NULL
--BEGIN
--     DROP TABLE #rawdata3
--END
--IF OBJECT_ID(N'tempdb..#rawdata55') IS NOT NULL
--BEGIN
--     DROP TABLE #rawdata55
--END
--go
Alter procedure SalesRevenue01Matrix
(
@UserID as Varchar(20)
)
as
declare @Yearr varchar(4)
declare @LowYearr varchar(4)
declare @SQL varchar(2000)
declare @SQL1 nvarchar(2000)
declare @decider int
declare @month01 varchar(6)
declare @month02 varchar(6)
declare @month03 varchar(6)
declare @month04 varchar(6)
declare @month05 varchar(6)
declare @month06 varchar(6)
declare @month07 varchar(6)
declare @month08 varchar(6)
declare @month09 varchar(6)
declare @month10 varchar(6)
declare @month11 varchar(6)
declare @month12 varchar(6)
declare @beginFiscal date
declare @endFiscal date
--declare @YearIncoming as varchar(4)
set @decider = datepart(Month,convert(date,getdate()))
set @Yearr = datepart(YEAR,Convert(date,Getdate()))
set @Lowyearr = @Yearr
set @Lowyearr = case when @decider > 6 then datepart(YEAR,Convert(date,Getdate())) else @LowYearr end
set @Yearr    = case when @decider >= 7 then datepart(YEAR,Convert(date,Getdate())) + 1 else @Yearr +1 end
set @Beginfiscal = convert(varchar(4),@LowYearr) + '0701'
set @Endfiscal   = convert(varchar(4),@Yearr) + '0630'

set @month01  =
  convert(varchar(4),datepart(Year,@beginFiscal)) +
  case
  when len(convert(varchar(2),datepart(Month,@beginFiscal))) = 1 then
   convert(varchar(2),'0' + convert(varchar(2),datepart(Month,@beginFiscal)))  else
   convert(varchar(2),datepart(Month,@beginFiscal))
  end

set @month02  =
  convert(varchar(4),datepart(Year,@beginFiscal)) +
  case
  when len(convert(varchar(2),datepart(Month,dateadd(mm,1,@beginFiscal))))  = 1 then
   convert(varchar(2),'0' + convert(varchar(2),datepart(Month,dateadd(mm,1,@beginFiscal))))  else
   convert(varchar(2),datepart(Month,dateadd(mm,1,@beginFiscal)))
  end

set @month03  =
  convert(varchar(4),datepart(Year,@beginFiscal)) +
  case
  when len(convert(varchar(2),datepart(Month,dateadd(mm,2,@beginFiscal))))  = 1 then
   convert(varchar(2),'0' + convert(varchar(2),datepart(Month,dateadd(mm,2,@beginFiscal))))  else
   convert(varchar(2),datepart(Month,dateadd(mm,2,@beginFiscal)))
  end

set @month04  =
  convert(varchar(4),datepart(Year,@beginFiscal)) +
  case
  when len(convert(varchar(2),datepart(Month,dateadd(mm,3,@beginFiscal))))  = 1 then
   convert(varchar(2),'0' + convert(varchar(2),datepart(Month,dateadd(mm,3,@beginFiscal))))  else
   convert(varchar(2),datepart(Month,dateadd(mm,3,@beginFiscal)))
  end

  set @month05  =
  convert(varchar(4),datepart(Year,@beginFiscal)) +
  case
  when len(convert(varchar(2),datepart(Month,dateadd(mm,4,@beginFiscal))))  = 1 then
   convert(varchar(2),'0' + convert(varchar(2),datepart(Month,dateadd(mm,4,@beginFiscal))))  else
   convert(varchar(2),datepart(Month,dateadd(mm,4,@beginFiscal)))
  end
  set @month06  =
  convert(varchar(4),datepart(Year,@beginFiscal)) +
  case
  when len(convert(varchar(2),datepart(Month,dateadd(mm,5,@beginFiscal))))  = 1 then
   convert(varchar(2),'0' + convert(varchar(2),datepart(Month,dateadd(mm,5,@beginFiscal))))  else
   convert(varchar(2),datepart(Month,dateadd(mm,5,@beginFiscal)))
  end

set @month07  =
  convert(varchar(4),datepart(Year,@endFiscal)) +
  case
  when len(convert(varchar(2),datepart(Month,dateadd(mm,-5,@endFiscal))))  = 1 then
   convert(varchar(2),'0' + convert(varchar(2),datepart(Month,dateadd(mm,-5,@endFiscal))))  else
   convert(varchar(2),datepart(Month,dateadd(mm,-5,@endFiscal)))
  end

set @month08  =
  convert(varchar(4),datepart(Year,@endFiscal)) +
  case
  when len(convert(varchar(2),datepart(Month,dateadd(mm,-4,@endFiscal))))  = 1 then
   convert(varchar(2),'0' + convert(varchar(2),datepart(Month,dateadd(mm,-4,@endFiscal))))  else
   convert(varchar(2),datepart(Month,dateadd(mm,-4,@endFiscal)))
  end
set @month09  =
  convert(varchar(4),datepart(Year,@endFiscal)) +
  case
  when len(convert(varchar(2),datepart(Month,dateadd(mm,-3,@endFiscal))))  = 1 then
   convert(varchar(2),'0' + convert(varchar(2),datepart(Month,dateadd(mm,-3,@endFiscal))))  else
   convert(varchar(2),datepart(Month,dateadd(mm,-3,@endFiscal)))
  end
set @month10  =
  convert(varchar(4),datepart(Year,@endFiscal)) +
  case
  when len(convert(varchar(2),datepart(Month,dateadd(mm,-2,@endFiscal))))  = 1 then
   convert(varchar(2),'0' + convert(varchar(2),datepart(Month,dateadd(mm,-2,@endFiscal))))  else
   convert(varchar(2),datepart(Month,dateadd(mm,-2,@endFiscal)))
  end

set @month11  =
  convert(varchar(4),datepart(Year,@endFiscal)) +
  case
  when len(convert(varchar(2),datepart(Month,dateadd(mm,-1,@endFiscal))))  = 1 then
   convert(varchar(2),'0' + convert(varchar(2),datepart(Month,dateadd(mm,-1,@endFiscal))))  else
   convert(varchar(2),datepart(Month,dateadd(mm,-1,@endFiscal)))
  end
set @month12  =
  convert(varchar(4),datepart(Year,@endFiscal)) +
  case
  when len(convert(varchar(2),datepart(Month,dateadd(mm,0,@endFiscal))))  = 1 then
   convert(varchar(2),'0' + convert(varchar(2),datepart(Month,dateadd(mm, 0,@endFiscal))))  else
   convert(varchar(2),datepart(Month,dateadd(mm,0,@endFiscal)))
  end
  -- select @Month01,@Month02,@Month03,@Month04,@Month05,@Month06
  --select @Month07,@Month08,@Month09,@Month10,@Month11,@Month12
--declare @UserID as Varchar(50)
declare @WhatICanSee  as varchar (50)
--set @UserID = 'ATRION\ssimon'
Set @UserID = rtrim(ltrim(@UserID))
set @WhatICanSee = (Select Min(team)  from [dbo].[SQLShackSecurity] where UserID = rtrim(ltrim(@UserID)))
 --set @WhatICanSee='Team1'
If Not @WhatICanSee is null
BEGIN
select YearMth
,case when @WhatIcanSee <> 'Team1' then 0 else SUM (Team1_Revenue) end as Team1_Revenue
, SUM (Team2_Revenue) as Team2_Revenue,
case when @WhatIcanSee = 'Team1' then (SUM (Team1_Revenue)  + SUM (Team2_Revenue))
  else sum(Team2_Revenue) end as TTotal into #rawdata1
from(
SELECT  YearMth,
case when name = 'Team1' then sales else 0 end as Team1_Revenue
,case when name = 'Team2' then sales else 0 end as Team2_Revenue
from [dbo].[YearlySales1])a
Group by YearMTH


set @sql =
' select  name, [' +  @month01+ '],[' + @month02+ '],[' +@month03+ '],[' +@month04+ '],[' +@month05 +'],['
 + @month06+ '],[' +@month07+ '],[' +@month08+ '],[' +@month09+ '],[' +@month10+ '],[' +
  @month11+ '],[' +@month12 +
']   from ' +
' ( ' +
'  select Yearmth, name, value ' +
'  from #rawdata1 ' +
'  unpivot ' +
'  ( ' +
'    value for name in ([Team1_Revenue],[Team2_Revenue],[TTotal]) ' +
'  ) unpiv '+
' ) src ' +
' pivot ' +
' ( ' +
'  sum(value) ' +
'  for YearMth in (['
 + @month01+ '],[' + @month02+ '],[' +@month03+ '],[' +@month04+ '],[' +@month05 +'],['
 + @month06+ '],[' +@month07+ '],[' +@month08+ '],[' +@month09+ '],[' +@month10+ '],['
 + @month11+ '],[' +@month12  +'] )) piv '
 + '  order by name asc '

 set @sql1 = @sql
 CREATE TABLE #rawdata55(
	[name] [varchar](75) NULL,
	[Month01] [decimal](10, 2) NULL,
	[Month02] [decimal](10, 2) NULL,
	[Month03] [decimal](10, 2) NULL,
	[Month04] [decimal](10, 2) NULL,
	[Month05] [decimal](10, 2) NULL,
	[Month06] [decimal](10, 2) NULL,
	[Month07] [decimal](10, 2) NULL,
	[Month08] [decimal](10, 2) NULL,
	[Month09] [decimal](10, 2) NULL,
	[Month10] [decimal](10, 2) NULL,
	[Month11] [decimal](10, 2) NULL,
	[Month12] [decimal](10, 2) NULL)

insert #rawdata55
exec sp_executesql @SQL1  with recompile

select * from #rawdata55

 END
 go
阿登达B ( ADDENDA B )
User ATRION\ssimon observes the following when a report is pushed to SharePoint
将报表推送到SharePoint时,用户ATRION \ ssimon会观察到以下内容
User ATRION\SQLDB observes the following when a report is pushed to SharePoint
将报表推送到SharePoint时,用户ATRION \ SQLDB会注意以下问题
翻译自: https://www.sqlshack.com/sql-server-security-control-what-data-can-users-see-in-their-reports/


 1313
1313


 被折叠的 条评论
为什么被折叠?
被折叠的 条评论
为什么被折叠?
 到【灌水乐园】发言


