


performance
Windows Performance Monitor is a tool shipped with Windows that can be used to monitor and examine how applications affect computer performance. It can measure real-time server performance and save the measured values into a log file that can be analyzed later. It enables real time system and SQL Server performance monitoring, tracking the performance impact of applications and services, setting threshold for each monitored metric, and generating an alert or performing a specific action when the defined threshold is exceeded Windows Performance Monitor是Windows附带的工具,可用于监视和检查应用程序如何影响计算机性能。 它可以测量实时服务器性能,并将测量值保存到日志文件中,以便以后进行分析。 它启用了实时系统和SQL Server性能监视,跟踪应用程序和服务对性能的影响,为每个监视的指标设置阈值以及在超出定义的阈值时生成警报或执行特定操作Windows Server 2003 had a utility named System Monitor. Later versions – Windows 7, Windows 8, Windows Server 2008 R2, and Windows Server 2012 have Performance Monitor as a part of Performance Monitor, or Reliability and Performance Monitor parent snap-in. Earlier Windows versions had Performance Monitor Wizard – a utility that was not shipped with Windows, so it had to be downloaded and installed additionally
Windows Server 2003具有名为“系统监视器”的实用程序。 更高版本– Windows 7,Windows 8,Windows Server 2008 R2和Windows Server 2012将性能监视器作为性能监视器或可靠性和性能监视器父级管理单元的一部分。 Windows的早期版本具有Performance Monitor Wizard(性能监视器向导)– Windows尚未附带的实用程序,因此必须另外下载并安装它。
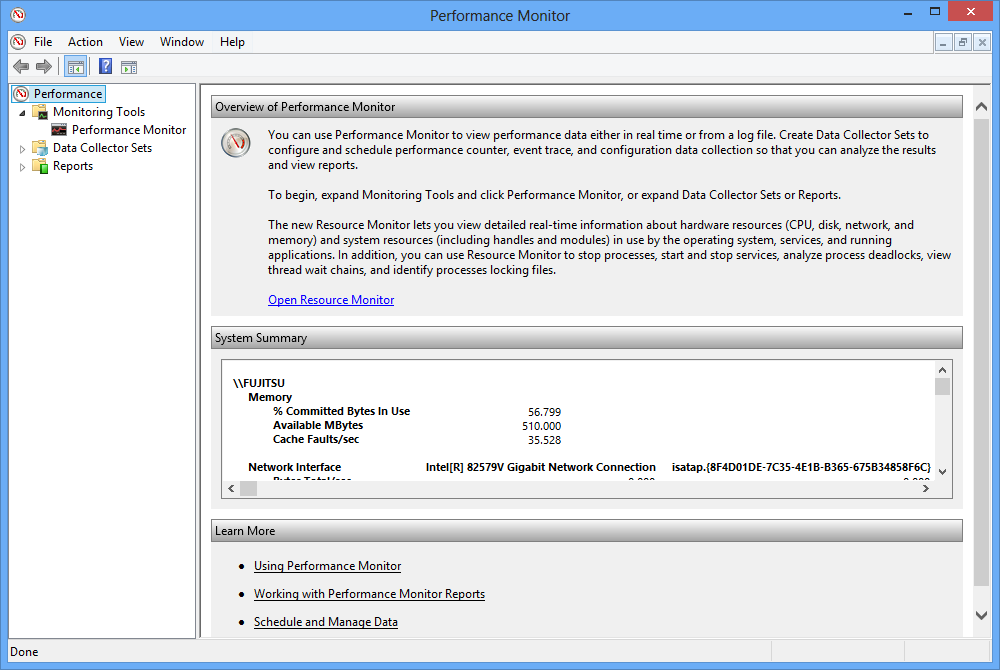
The Windows Performance Monitor parent snap-in consists of three elements – Monitoring Tools (this is where Performance Monitor is), Data Collector Sets, and Reports. The focus of this article is on Monitoring Tools Performance Monitor, also known as Performance Monitor or PerfMon
Windows Performance Monitor父管理单元由三个元素组成-监视工具(这是Performance Monitor所在的位置),数据收集器集和报告。 本文的重点是监视工具性能监视器,也称为性能监视器或PerfMon
Performance Monitor provides a wide range of measures that can be monitored. Monitoring the right set of available counters narrows down the problem origin to a specific component or application and enables efficient and quick problem troubleshooting. Some of the performance counters don’t provide enough information when monitored alone. When their values are above the recommended threshold, they don’t clearly indicate performance problems. To be able to determine whether there is a performance problem, other counters should be monitored and their values compared
性能监视器提供了可以监视的多种措施。 监视正确的可用计数器集可以将问题的根源缩小到特定的组件或应用程序,并实现高效,快速的问题排查。 当单独监视某些性能计数器时,它们不能提供足够的信息。 当它们的值超过建议的阈值时,它们并不能清楚地表明性能问题。 为了能够确定是否存在性能问题,应该监视其他计数器并比较它们的值
For example, the Page faults/sec counter shows both hard and soft page faults. Soft page faults don’t affect SQL Server performance, but hard page faults do. That’s why high Page faults/sec values don’t necessarily indicate performance problems. To determine whether that is the case, monitoring another counter that also indicates hard page faults – the Page reads/sec value is recommended. If it is also high, there is most likely a performance problem. To be sure, monitor disk behavior and paging via memory and disk counters, such as Pages Output/sec, Pages Input/sec, Disk Reads/sec, and Avg. Disk Read Bytes/sec
例如, 页面错误/秒计数器同时显示硬页面错误和软页面错误。 软页面错误不会影响SQL Server性能,但硬页面错误会影响SQL Server性能。 这就是为什么高Page Faults / sec值不一定表示性能问题的原因。 要确定是否是这种情况,请监视另一个也指示硬页面错误的计数器-建议“ 页面读取/秒”值。 如果它也很高,则很可能是性能问题。 可以肯定的是,通过内存和磁盘计数器(例如, Pages Output / sec,Pages Input / sec,Disk Reads / sec和Avg)监视磁盘行为和分页。 磁盘读取字节/秒
Without monitoring all necessary counters, the information obtained can be insufficient or misleading for determining the system state and making correct decisions
如果不监视所有必要的计数器,则所获得的信息可能不足或误导您确定系统状态并做出正确的决定
When it comes to selecting the counters, it’s necessary to understand what they represent, what are acceptable values, is there an exact threshold, or is the value determined based on a trend line
在选择计数器时,有必要了解它们代表什么,可接受的值,是否有确切的阈值或根据趋势线确定的值
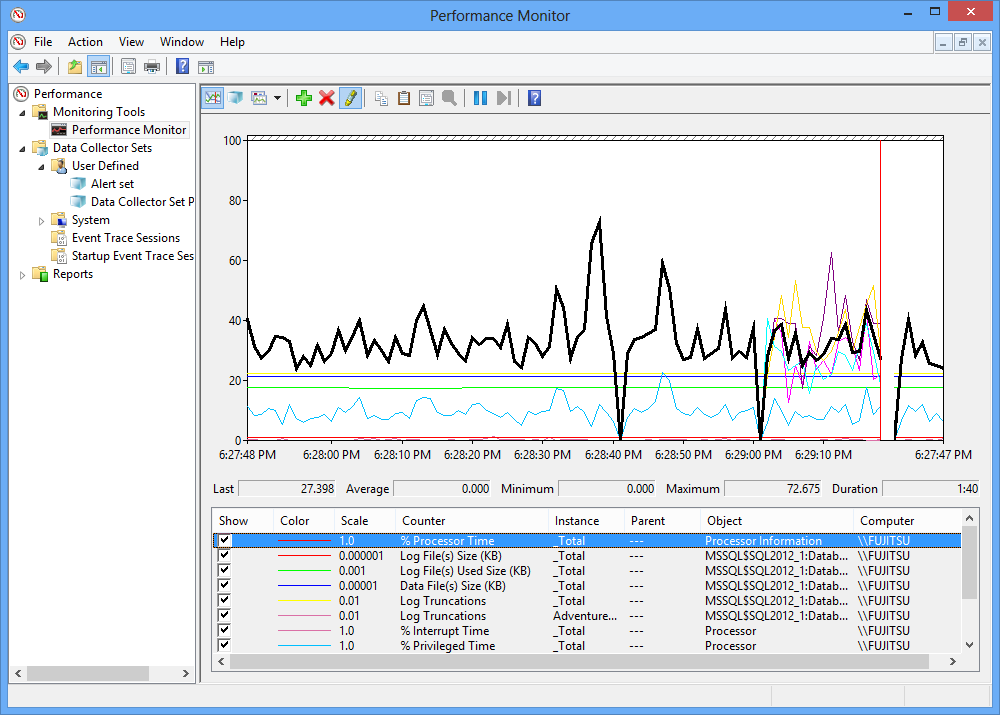
Performance Monitor provides graphical presentation of the metrics collected by Data Collector Sets and Event Trace Sessions, both in real time and as historical data
性能监视器以图形方式展示了实时和作为历史数据的数据收集器集和事件跟踪会话收集的指标
Besides the Windows performance parameters, Performance Monitor provides a range of parameters useful for SQL Server performance monitoring. On a machine where SQL Server is installed, SQL Server related counters are automatically added to Performance Monitor
除了Windows性能参数外, 性能监视器还提供了一系列可用于SQL Server性能监视的参数。 在安装了SQL Server的计算机上,与SQL Server相关的计数器会自动添加到性能监视器中
性能监视器的工作原理 (How Performance Monitor works)
Performance Monitor presents built-in Windows and application performance counters in easy-to read graphs. It can show live, real time data as well as data stored in *.blg, *.csv, or *.tsv log files. The latter feature makes is useful for performance analysis and determining performance trends. All data can be presented as line graphs, histogram bars, or reports
性能监视器以易于阅读的图形显示内置的Windows和应用程序性能计数器。 它可以显示实时,实时数据以及存储在* .blg,*。csv或* .tsv日志文件中的数据。 后一个功能对于性能分析和确定性能趋势很有用。 所有数据都可以表示为折线图,直方图条形图或报告
The performance counters presented in Performance Monitor can be defined via custom Data Collector Sets
可以通过自定义数据收集器集来定义性能监视器中显示的性能计数器
Data Collector Sets contain performance counters, event trace data, and system configuration information. Performance counters measure system state and activity. Performance Monitor periodically requests the current value of performance counters and represents them graphically, or in the reports. Event trace data is gathered from trace files created by the system or application. Configuration information is obtained from the Windows registry
数据收集器集包含性能计数器,事件跟踪数据和系统配置信息。 性能计数器可测量系统状态和活动。 性能监视器定期请求性能计数器的当前值,并以图形方式或在报告中表示它们。 事件跟踪数据是从系统或应用程序创建的跟踪文件中收集的。 配置信息是从Windows注册表获得的
To be able to set monitored metrics and use all Performance Monitor features, a user has to be a member of the local Administrators group. A member of the Users group can only open saved log files in Performance Monitor and set the graph properties. Real time monitoring is not possible for these users
为了能够设置监视的指标并使用所有性能监视器功能,用户必须是本地Administrators组的成员。 Users组的成员只能在Performance Monitor中打开保存的日志文件,并设置图形属性。 这些用户无法进行实时监控
There are two more user groups specific for this utility: Performance Monitor Users and Performance Log Users. The first one allows viewing real time and saved log files in Performance Monitor and setting the graph properties for both. Creating and modifying Data Collector Sets is not allowed. In addition to the features available for the Performance Monitor Users group users, the Performance Log Users group allows creating and modifying Data Collector Sets, except the NT Kernel trace
此实用程序还有另外两个用户组:性能监视器用户和性能日志用户。 第一个允许在Performance Monitor中查看实时和已保存的日志文件,并设置两者的图形属性。 不允许创建和修改数据收集器集。 除了“性能监视器用户”组用户可用的功能外,“性能日志用户”组还允许创建和修改数据收集器集,NT内核跟踪除外。
性能监视器可以收集哪些信息? (What information can Performance Monitor gather?)
The counters that can be monitored in Performance Monitor are grouped for easier referencing. The available groups depend on the operating system and applications installed on the monitored machine. Available groups are: Memory, Network Interface, Physical Disk, Process, Processor, Server, System, and many more
可在Performance Monitor中监视的计数器被分组以便于参考。 可用组取决于被监视计算机上安装的操作系统和应用程序。 可用的组是:内存,网络接口,物理磁盘,进程,处理器,服务器,系统等等。
When it comes to SQL Server, counter groups are named MSSQL$SQL<version>:<counter_name>. For SQL Server 2012, there are more than 30 groups. For example, the MSSQL$SQL2012:Databases counter group contains more than 600 counters that monitor data and log file size, growth, truncation, shrinks, percentage and KB of log file used, various metrics about transactions, log cache, log flush, and many more. The MSSQL$SQL2012:Locks group contains more than 100 counters that monitor lock requests, timeouts, wait time, and more on various resources – database files, index rows, catalog information, table, view, stored procedure or other database object, etc.
对于SQL Server,计数器组名为MSSQL $ SQL <版本>:<计数器名称>。 对于SQL Server 2012,有30多个组。 例如,MSSQL $ SQL2012:Databases计数器组包含600多个计数器,它们监视数据和日志文件的大小,使用的日志文件的大小,增长,截断,收缩,百分比和KB,有关事务,日志高速缓存,日志刷新和还有很多。 MSSQL $ SQL2012:Locks组包含100多个计数器,这些计数器监视锁定请求,超时,等待时间以及各种资源(数据库文件,索引行,目录信息,表,视图,存储过程或其他数据库对象等)上的更多资源。
While the MSSQL$SQL counters enable detailed and in-depth analysis of the SQL Server performance, the most commonly monitored counters for troubleshooting SQL Server performance issues belong to the Memory, Processor, Physical Disk, and Network Interface groups
虽然MSSQL $ SQL计数器可以对SQL Server性能进行详细的深入分析,但用于故障排除SQL Server性能问题的最常用监视计数器属于“内存”,“处理器”,“物理磁盘”和“网络接口”组。
Each of these groups contains multiple counters. For example, the Memory group contains more than 30 counters among which the most important are Available Bytes, Page Faults/sec, Page reads/sec, Page Writes/sec, Pages Input/sec, Pages Output/sec, and Pages/sec
这些组中的每一个都包含多个计数器。 例如,“内存”组包含30多个计数器,其中最重要的计数器是“ 可用字节”,“页面错误/秒”,“页面读取/秒”,“页面写入/秒”,“页面输入/秒”,“页面输出/秒”和“ 页面/秒”。
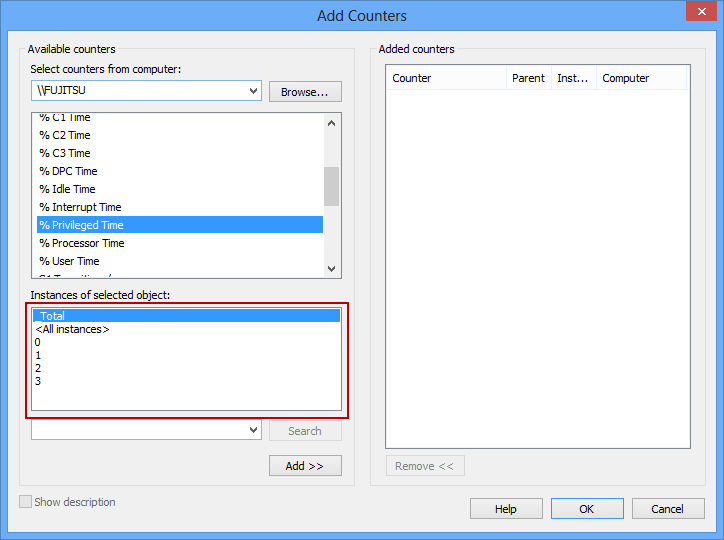
Multiple instances are shown for a counter if there are multiple processors on the machine and if tracking the counter per processor makes sense, such as for Processor and Processor Information counters. You can monitor each processor individually, or all instances
如果计算机上有多个处理器,并且跟踪每个处理器的计数器是否有意义(例如,对于“处理器”和“处理器信息”计数器),则将为该计数器显示多个实例。 您可以单独监视每个处理器或所有实例
Although active monitoring makes little overhead, to avoid monitoring the overhead along with the system and application performance, use Performance Monitor to monitor a remote machine
尽管主动监视的开销很小,但为避免监视开销以及系统和应用程序性能,请使用性能监视器来监视远程计算机。
In SQL Server performance tuning using Performance Monitor, we give detailed steps for using Windows Performance Monitor
在使用Performance Monitor进行SQL Server性能调整中 ,我们提供了使用Windows Performance Monitor的详细步骤。
翻译自: https://www.sqlshack.com/windows-performance-monitor-basics/
performance


 被折叠的 条评论
为什么被折叠?
被折叠的 条评论
为什么被折叠?
 到【灌水乐园】发言


