


 本文深入探讨了SQL Server的缓冲区缓存,它是提高查询速度的关键组件。缓冲区缓存通过存储8k页面来加速数据访问,当缓存满时,会淘汰较旧和使用较少的数据。通过监视缓冲区缓存指标,如页面生命期望(PLE),可以评估数据库性能。高PLE值表示数据在内存中停留时间长,性能更好。了解和优化缓冲区缓存能有效提升SQL Server的性能和响应速度。
sql server 缓存
When we talk about memory usage in SQL Server, we are often referring to the buffer cache. This is an important part of SQL Server’s architecture, and is responsible for the ability to query frequently accessed data extremely fast. Knowing how the buffer cache works will allow us to properly allocate memory in SQL Server, gauge accurately how databases are accessing data, and ensure that there are not inefficiencies in our code that cause excessive data to be cached.
当我们谈论SQL Server中的内存使用时,我们通常是指缓冲区缓存。 这是SQL Server体系结构的重要组成部分,它负责以极快的速度查询频繁访问的数据。 了解缓冲区缓存的工作方式将使我们能够在SQL Server中正确分配内存,准确评估数据库如何访问数据,并确保代码中没有效率低下的问题,不会导致过多的数据被缓存。
缓冲区缓存中有什么? (What is in the buffer cache?)
Hard disks are slow; memory is fast. This is a fact of nature for anyone that works with computers. Even SSDs are slow when compared to high-performance memory. The way in which software deals with this problem is to write data from slow storage into fast memory. Once loaded, your favorite apps can perform very fast and only need to go back to disk when new data is needed. This fact of life in computing is also an important part of SQL Server architecture.
硬盘很慢; 记忆速度很快。 对于任何使用计算机的人来说,这都是自然的事实。 与高性能内存相比,即使SSD也很慢。 软件处理此问题的方法是将数据从慢速存储写入快速内存。 加载后,您喜欢的应用程序可以非常快速地执行,并且仅在需要新数据时才需要返回磁盘。 计算中的这一事实也是SQL Server体系结构的重要组成部分。
Whenever data is written to or read from a SQL Server database, it will be copied into memory by the buffer manager. The buffer cache (also known as the buffer pool) will use as much memory as is allocated to it in order to hold as many pages of data as possible. When the buffer cache fills up, older and less used data will be purged in order to make room for newer data.
每当将数据写入SQL Server数据库或从SQL Server数据库读取数据时,缓冲区管理器就会将其复制到内存中。 缓冲区高速缓存(也称为缓冲池)将使用分配给它的尽可能多的内存,以容纳尽可能多的数据页。 当缓冲区高速缓存填满时,将清除较旧和较少使用的数据,以便为较新的数据腾出空间。
Data is stored in 8k pages within the buffer cache and can be referred to as “clean” or “dirty” pages. A dirty page is one that has been changed since last being written to disk and is the result of a write operation against that index or table data. Clean pages are those that have not changed, and the data within them still matches what is on disk. Checkpoints are automatically issued in the background by SQL Server that will write dirty pages to disk in order to create a known good restore point in the event of a crash or other unfortunate server situation.
数据存储在缓冲区高速缓存中的8k页中,可以称为“干净”或“脏”页。 脏页是自上次写入磁盘以来已更改的页,并且是针对该索引或表数据进行写操作的结果。 干净页是未更改的页,并且其中的数据仍与磁盘上的内容匹配。 SQL Server将在后台自动发出检查点,该检查点会将脏页写入磁盘,以便在发生崩溃或其他不幸的服务器情况时创建已知的良好还原点。
You can see an overview of the current state of memory usage in SQL Server by checking the sys.dm_os_sys_info DMV:
您可以通过检查sys.dm_os_sys_info DMV来查看SQL Server中内存使用的当前状态的概述:
SELECT
	physical_memory_kb,
	virtual_memory_kb,
	committed_kb,
	committed_target_kb
FROM sys.dm_os_sys_info;
The results of this query tell me a bit about memory usage on my server:
该查询的结果告诉我有关服务器上内存使用情况的一些信息:
Here are what the columns mean:
physical_memory_kb: Total physical memory installed on the server.
virtual_memory_kb: Total amount of virtual memory available to SQL Server. Ideally, we do not want to utilize this often as virtual memory (using a page file on disk or somewhere that isn’t memory) is going to be significantly slower than memory.
Committed_kb: The amount of memory currently allocated by the buffer cache for use by database pages.
Committed_target_kb: This is the amount of memory the buffer cache “wants” to use. If the amount currently in use (indicated by committed_kb) is higher than this amount, then the buffer manager will begin to remove older pages from memory. If the amount currently in use is lower, than the buffer manager will allocate more memory for our data.
以下是各列的含义:
physical_memory_kb :服务器上安装的总物理内存。
virtual_memory_kb :SQL Server可用的虚拟内存总量。 理想情况下,我们不希望经常使用此功能,因为虚拟内存(在磁盘上或非内存位置使用页面文件)会比内存慢得多。
Committed_kb :缓冲区高速缓存当前分配的内存量,供数据库页面使用。
Committed_target_kb :这是缓冲区高速缓存“想要”使用的内存量。 如果当前正在使用的数量(由commit_kb表示)高于该数量,则缓冲区管理器将开始从内存中删除较旧的页面。 如果当前使用的数量少于该数量,则缓冲区管理器将为我们的数据分配更多的内存。
Memory use is critical to SQL Server performance—if there isn’t enough memory available to service our common queries, then we’ll spend far more resources reading data from disk, only to have it thrown away and read again later.
内存使用对SQL Server性能至关重要-如果没有足够的内存来服务于我们的常见查询,那么我们将花费更多的资源从磁盘读取数据,只是丢弃并稍后再读取。
我们如何使用缓冲区缓存指标? (How can we use buffer cache metrics?)
We can access information about the buffer cache using the dynamic management view sys.dm_os_buffer_descriptors, which provides everything you’ve ever wanted to know about the data stored in memory by SQL Server, but were afraid to ask. Within this view, you’ll find a single row per buffer descriptor, which uniquely identifies, and provides some information about each page in memory. Note that on a server with large databases, it may take a bit of time to query this view.
我们可以使用动态管理视图sys.dm_os_buffer_descriptors来访问有关缓冲区缓存的信息,该视图提供了您曾经想知道的有关SQL Server存储在内存中的数据的所有信息,但又不敢问。 在此视图中,每个缓冲区描述符将找到一行,它唯一地标识并提供有关内存中每个页面的一些信息。 请注意,在具有大型数据库的服务器上,查询该视图可能会花费一些时间。
A useful metric that is easy to get is a measure of buffer cache usage by database on the server:
易于获取的有用指标是服务器上数据库对缓冲区高速缓存使用情况的度量:
SELECT
    databases.name AS database_name,
    COUNT(*) * 8 / 1024 AS mb_used
FROM sys.dm_os_buffer_descriptors
INNER JOIN sys.databases
ON databases.database_id = dm_os_buffer_descriptors.database_id
GROUP BY databases.name
ORDER BY COUNT(*) DESC;
This query returns, in order from most pages in memory to fewest, the amount of memory consumed by each database in the buffer cache:
该查询按从内存中的大多数页面到最少页面的顺序返回缓冲区高速缓存中每个数据库消耗的内存量:
My local server isn’t terribly exciting right now…but if I were to jump in and run an assortment of queries against AdventureWorks2014, we could run our query from above again to verify the impact it had on the buffer cache:
我的本地服务器现在并不十分令人兴奋……但是,如果我要跳入并针对AdventureWorks2014运行各种查询,我们可以再次从上方运行查询以验证其对缓冲区高速缓存的影响:
While I didn’t go too crazy here, my random querying did increase the amount of data in the buffer cache for AdventureWorks2014 by 27MB. This query can be a useful way to quickly determine which database accounts for the most memory usage in the buffer cache. On a multi-tenant architecture, or a server in which there are many key databases sharing resources, this can be a quick method to find a database that is performing poorly or hogging memory at any given time.
虽然我在这里并没有太疯狂,但我的随机查询确实使AdventureWorks2014的缓冲区高速缓存中的数据量增加了27MB。 该查询是一种快速确定缓冲区高速缓存中哪个数据库占用最多内存的有用方法。 在多租户架构或服务器上,其中有许多共享资源的关键数据库,这可能是查找在任何给定时间性能不佳或占用内存的数据库的快速方法。
Similarly, we can view overall totals as a page or byte count:
同样,我们可以将总总数查看为页数或字节数:
SELECT
	COUNT(*) AS buffer_cache_pages,
	COUNT(*) * 8 / 1024 AS buffer_cache_used_MB
FROM sys.dm_os_buffer_descriptors;
This returns a single row containing the number of pages in the buffer cache, as well as the memory consumed by them:
这将返回一行,其中包含缓冲区高速缓存中的页面数以及它们消耗的内存:
Since a page is 8KB, we can convert the number of pages into megabytes by multiplying by 8 to get KB, and then divide by 1024 to arrive at MB.
由于页面大小为8KB,因此我们可以通过乘以8以获得KB,然后除以1024得出MB,从而将页面数转换为兆字节。
We can subdivide this further and look at how the buffer cache is used by specific objects. This can provide much more insight into memory usage as we can determine what tables are memory hogs. In addition, we can verify some interesting metrics, such as what percentage of a table is in memory currently, or what tables are infrequently (or not) used. The following query will return buffer pages and size by table:
我们可以进一步细分,并查看特定对象如何使用缓冲区缓存。 当我们可以确定哪些表是内存猪时,这可以提供有关内存使用情况的更多信息。 此外,我们可以验证一些有趣的指标,例如,当前表在内存中所占的百分比,或者不经常(或不经常)使用哪些表。 以下查询将按表返回缓冲区页面和大小:
SELECT
	objects.name AS object_name,
	objects.type_desc AS object_type_description,
	COUNT(*) AS buffer_cache_pages,
	COUNT(*) * 8 / 1024  AS buffer_cache_used_MB
FROM sys.dm_os_buffer_descriptors
INNER JOIN sys.allocation_units
ON allocation_units.allocation_unit_id = dm_os_buffer_descriptors.allocation_unit_id
INNER JOIN sys.partitions
ON ((allocation_units.container_id = partitions.hobt_id AND type IN (1,3))
OR (allocation_units.container_id = partitions.partition_id AND type IN (2)))
INNER JOIN sys.objects
ON partitions.object_id = objects.object_id
WHERE allocation_units.type IN (1,2,3)
AND objects.is_ms_shipped = 0
AND dm_os_buffer_descriptors.database_id = DB_ID()
GROUP BY objects.name,
		 objects.type_desc
ORDER BY COUNT(*) DESC;
System tables are excluded, and this will only pull data for the current database. Indexed views will be included as their indexes are distinct entities from the tables they are derived from. The join on sys.partitions contains two parts in order to account for indexes, as well as heaps. The data shown here includes all indexes on a table, as well as the heap, if there are none defined.
系统表不包括在内,这只会提取当前数据库的数据。 将包括索引视图,因为它们的索引是与其派生表不同的实体。 sys.partitions上的联接包含两部分,以便说明索引以及堆。 此处显示的数据包括表上的所有索引以及堆(如果未定义的话)。
A segment of the results of this are as follows (for AdventureWorks2014):
结果的一部分如下(对于AdventureWorks2014):
Similarly, we can split out this data by index, instead of by table, providing even further granularity on buffer cache usage:
同样,我们可以按索引而不是按表拆分此数据,从而进一步提供缓冲区高速缓存使用情况的详细信息:
SELECT
	indexes.name AS index_name,
	objects.name AS object_name,
	objects.type_desc AS object_type_description,
	COUNT(*) AS buffer_cache_pages,
	COUNT(*) * 8 / 1024  AS buffer_cache_used_MB
FROM sys.dm_os_buffer_descriptors
INNER JOIN sys.allocation_units
ON allocation_units.allocation_unit_id = dm_os_buffer_descriptors.allocation_unit_id
INNER JOIN sys.partitions
ON ((allocation_units.container_id = partitions.hobt_id AND type IN (1,3))
OR (allocation_units.container_id = partitions.partition_id AND type IN (2)))
INNER JOIN sys.objects
ON partitions.object_id = objects.object_id
INNER JOIN sys.indexes
ON objects.object_id = indexes.object_id
AND partitions.index_id = indexes.index_id
WHERE allocation_units.type IN (1,2,3)
AND objects.is_ms_shipped = 0
AND dm_os_buffer_descriptors.database_id = DB_ID()
GROUP BY indexes.name,
		 objects.name,
		 objects.type_desc
ORDER BY COUNT(*) DESC;
This query is almost the same as our last, except that we make one additional join to sys.indexes, and group on the index name, in addition to the table/view name. The results provide even more detail on how the buffer cache is being used, and can be valuable on tables with many indexes of varied use:
该查询与上一个查询几乎相同,除了我们对sys.indexes进行了另外一个连接,并在表/视图名称之外对索引名称进行了分组。 结果提供了有关如何使用缓冲区高速缓存的更多详细信息,并且在具有许多用途不同的索引的表上可能很有价值:
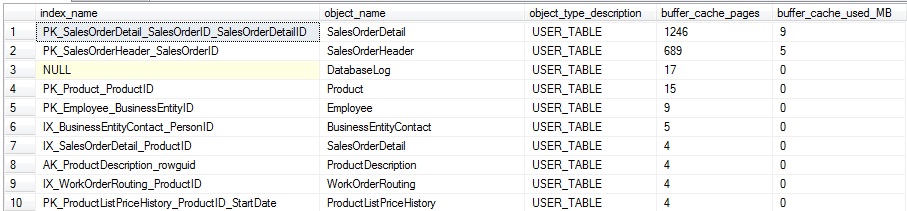
The results can be useful when trying to determine the overall level of usage for a specific index at any given time. In addition, it allows us to gauge how much of an index is being read, compared to its overall size.
当试图在任何给定时间确定特定索引的总体使用水平时,该结果将非常有用。 另外,它使我们能够评估与整体大小相比,正在读取的索引量。
To collect the percentage of each table that is in memory, we can put that query into a CTE and compare the pages in memory vs the total for each table:
要收集内存中每个表的百分比,我们可以将该查询放入CTE中,并比较内存中的页面与每个表的总数:
WITH CTE_BUFFER_CACHE AS (
	SELECT
		objects.name AS object_name,
		objects.type_desc AS object_type_description,
		objects.object_id,
		COUNT(*) AS buffer_cache_pages,
		COUNT(*) * 8 / 1024  AS buffer_cache_used_MB
	FROM sys.dm_os_buffer_descriptors
	INNER JOIN sys.allocation_units
	ON allocation_units.allocation_unit_id = dm_os_buffer_descriptors.allocation_unit_id
	INNER JOIN sys.partitions
	ON ((allocation_units.container_id = partitions.hobt_id AND type IN (1,3))
	OR (allocation_units.container_id = partitions.partition_id AND type IN (2)))
	INNER JOIN sys.objects
	ON partitions.object_id = objects.object_id
	WHERE allocation_units.type IN (1,2,3)
	AND objects.is_ms_shipped = 0
	AND dm_os_buffer_descriptors.database_id = DB_ID()
	GROUP BY objects.name,
			 objects.type_desc,
			 objects.object_id)
SELECT
	PARTITION_STATS.name,
	CTE_BUFFER_CACHE.object_type_description,
	CTE_BUFFER_CACHE.buffer_cache_pages,
	CTE_BUFFER_CACHE.buffer_cache_used_MB,
	PARTITION_STATS.total_number_of_used_pages,
	PARTITION_STATS.total_number_of_used_pages * 8 / 1024 AS total_mb_used_by_object,
	CAST((CAST(CTE_BUFFER_CACHE.buffer_cache_pages AS DECIMAL) / CAST(PARTITION_STATS.total_number_of_used_pages AS DECIMAL) * 100) AS DECIMAL(5,2)) AS percent_of_pages_in_memory
FROM CTE_BUFFER_CACHE
INNER JOIN (
	SELECT
		objects.name,
		objects.object_id,
		SUM(used_page_count) AS total_number_of_used_pages
	FROM sys.dm_db_partition_stats
	INNER JOIN sys.objects
	ON objects.object_id = dm_db_partition_stats.object_id
	WHERE objects.is_ms_shipped = 0
	GROUP BY objects.name, objects.object_id) PARTITION_STATS
ON PARTITION_STATS.object_id = CTE_BUFFER_CACHE.object_id
ORDER BY CAST(CTE_BUFFER_CACHE.buffer_cache_pages AS DECIMAL) / CAST(PARTITION_STATS.total_number_of_used_pages AS DECIMAL) DESC;
This query joins our previous data set with a query on sys.dm_db_partition_stats in order to compare what’s currently in the buffer cache vs. the total space used by any given table. The various CAST operations at the end help to avoid truncation and make the final result in a form that is easy to read. The results on my local server are as follows:
此查询将我们先前的数据集与sys.dm_db_partition_stats上的查询结合在一起,以便比较缓冲区高速缓存中当前的内容与任何给定表使用的总空间。 最后的各种CAST操作有助于避免截断,并以易于阅读的形式生成最终结果。 我的本地服务器上的结果如下:
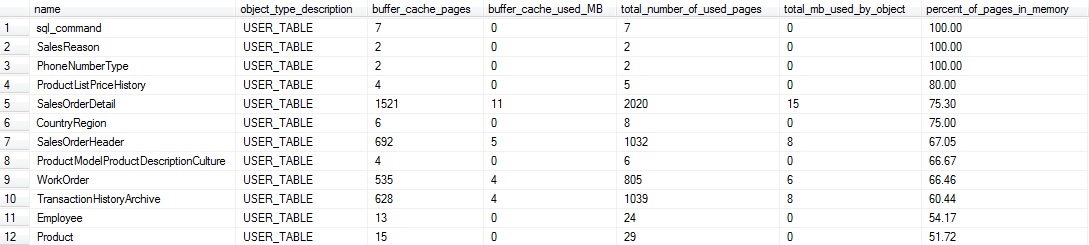
This data can tell us which tables are hot spots in our database, and with some knowledge of their application usage, we can determine which ones simply have too much data residing in memory. Small tables are probably not very important to us here. For example, the top four in the output above are under a megabyte and if we wanted to omit them, we could filter the results to only return tables larger than a specific size of interest.
这些数据可以告诉我们哪些表是数据库中的热点,并且在了解了它们的应用程序使用情况后,我们可以确定哪些表只是在内存中驻留了太多数据。 小桌子在这里对我们来说可能不是很重要。 例如,上面输出中的前四位小于1兆字节,如果我们想忽略它们,我们可以过滤结果以仅返回大于特定大小的表。
On the other hand, this data tells us that 3/4 of SalesOrderDetail is in the buffer cache. If this seemed unusual, I’d consult the query plan cache and determine if there are any inefficient queries on the table that are selecting *, or an overly large amount of data. By combining our metrics from the buffer cache and plan cache, we can devise new ways of pinpointing bad queries or applications that are pulling far more data than they require.
另一方面,此数据告诉我们, SalesOrderDetail的 3/4位于缓冲区高速缓存中。 如果这看起来很不正常,那么我将查询查询计划缓存,并确定表上是否存在任何选择*的低效率查询,或者数据量过多。 通过结合来自缓冲区高速缓存和计划高速缓存的指标,我们可以设计出新的方法来查明错误查询或正在提取远远超出所需数据的应用程序。
This query can be modified to provide the percentage of an index that is being used as well, similar to how we collected the percentage of a table used:
可以修改此查询以提供所使用索引的百分比,类似于我们如何收集所用表的百分比:
SELECT
	indexes.name AS index_name,
	objects.name AS object_name,
	objects.type_desc AS object_type_description,
	COUNT(*) AS buffer_cache_pages,
	COUNT(*) * 8 / 1024  AS buffer_cache_used_MB,
	SUM(allocation_units.used_pages) AS pages_in_index,
	SUM(allocation_units.used_pages) * 8 /1024 AS total_index_size_MB,
	CAST((CAST(COUNT(*) AS DECIMAL) / CAST(SUM(allocation_units.used_pages) AS DECIMAL) * 100) AS DECIMAL(5,2)) AS percent_of_pages_in_memory
FROM sys.dm_os_buffer_descriptors
INNER JOIN sys.allocation_units
ON allocation_units.allocation_unit_id = dm_os_buffer_descriptors.allocation_unit_id
INNER JOIN sys.partitions
ON ((allocation_units.container_id = partitions.hobt_id AND type IN (1,3))
OR (allocation_units.container_id = partitions.partition_id AND type IN (2)))
INNER JOIN sys.objects
ON partitions.object_id = objects.object_id
INNER JOIN sys.indexes
ON objects.object_id = indexes.object_id
AND partitions.index_id = indexes.index_id
WHERE allocation_units.type IN (1,2,3)
AND objects.is_ms_shipped = 0
AND dm_os_buffer_descriptors.database_id = DB_ID()
GROUP BY indexes.name,
		 objects.name,
		 objects.type_desc
ORDER BY CAST((CAST(COUNT(*) AS DECIMAL) / CAST(SUM(allocation_units.used_pages) AS DECIMAL) * 100) AS DECIMAL(5,2)) DESC;
Since sys.allocation_units provides some size info on our indexes, we avoid the need for the additional CTE and data set from dm_db_partition_stats. Here is a slice of the results, showing index size (MB and pages) and buffer cache space used (MB and pages):
由于sys.allocation_units提供了一些有关索引的大小信息,因此我们避免了从dm_db_partition_stats获得额外的CTE和数据集的需求 。 以下是结果的一部分,显示了索引大小(MB和页面)和使用的缓冲区高速缓存空间(MB和页面):
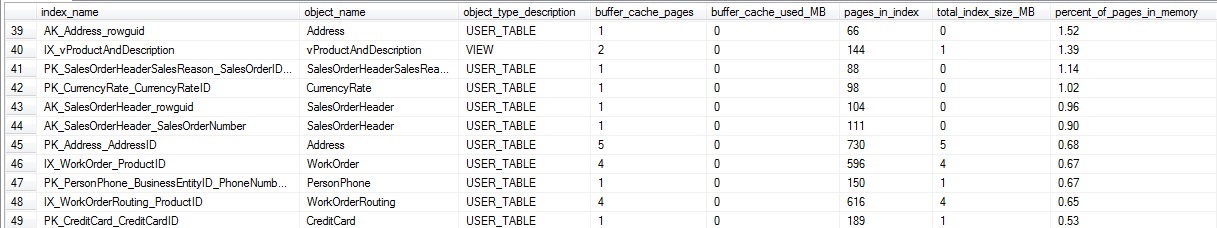
If we were uninterested in small tables/indexes, we could add a HAVING clause to the query in order to filtered by an index that is smaller than a specific size, in MB or in pages. This data provides a nice view into the efficiency of queries on specific indexes and could assist in index cleanup, index tuning, or some more granular tuning of memory usage on your SQL Server.
如果我们对小型表/索引不感兴趣,则可以在查询中添加HAVING子句,以按小于特定大小(以MB或页为单位)的索引进行过滤。 此数据可以很好地了解特定索引的查询效率,并且可以帮助您进行索引清理,索引调整,或者对SQL Server上的内存使用情况进行更精细的调整。
An interesting column in dm_os_buffer_descriptors is the free_space_in_bytes column. This tells us how full each page in the buffer cache is, and therefore provides an indicator of potential wasted space or inefficiency. We can determine the percentage of pages that are taken up by free space, rather than data, for each database on our server:
dm_os_buffer_descriptors中一个有趣的列是free_space_in_bytes列。 这告诉我们缓冲区高速缓存中的每个页面有多满,因此可以指示潜在的空间浪费或效率低下。 我们可以确定服务器上每个数据库的可用空间而不是数据所占用的页面百分比:
WITH CTE_BUFFER_CACHE AS
( SELECT
  databases.name AS database_name,
  COUNT(*) AS total_number_of_used_pages,
  CAST(COUNT(*) * 8 AS DECIMAL) / 1024 AS buffer_cache_total_MB,
  CAST(CAST(SUM(CAST(dm_os_buffer_descriptors.free_space_in_bytes AS BIGINT)) AS DECIMAL) / (1024 * 1024) AS DECIMAL(20,2))  AS buffer_cache_free_space_in_MB
 FROM sys.dm_os_buffer_descriptors
 INNER JOIN sys.databases
 ON databases.database_id = dm_os_buffer_descriptors.database_id
 GROUP BY databases.name)
SELECT
 *,
 CAST((buffer_cache_free_space_in_MB / NULLIF(buffer_cache_total_MB, 0)) * 100 AS DECIMAL(5,2)) AS buffer_cache_percent_free_space
FROM CTE_BUFFER_CACHE
ORDER BY buffer_cache_free_space_in_MB / NULLIF(buffer_cache_total_MB, 0) DESC
This returns a row per database showing the aggregate of free space per database, summed across all pages in the buffer cache for that particular database:
这将为每个数据库返回一行,显示每个数据库的可用空间总量,该缓冲是该特定数据库在缓冲区高速缓存中所有页面上的总和:
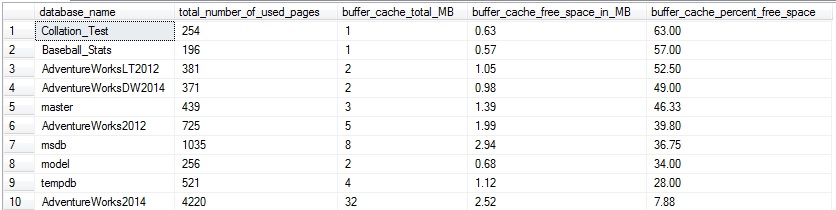
This is interesting, but not too useful yet as these results are not very targeted. They tell us a database may have some wasted space, but not much about what tables are the culprit. Let’s take the same approach we previously did and return free space per table in a given database:
这很有趣,但还不太有用,因为这些结果不是很针对性。 他们告诉我们数据库可能有一些浪费的空间,但是罪魁祸首不是什么表。 让我们采用与以前相同的方法,并返回给定数据库中每个表的可用空间:
SELECT
	objects.name AS object_name,
	objects.type_desc AS object_type_description,
	COUNT(*) AS buffer_cache_pages,
	CAST(COUNT(*) * 8 AS DECIMAL) / 1024  AS buffer_cache_total_MB,
	CAST(SUM(CAST(dm_os_buffer_descriptors.free_space_in_bytes AS BIGINT)) AS DECIMAL) / 1024 / 1024 AS buffer_cache_free_space_in_MB,
	CAST((CAST(SUM(CAST(dm_os_buffer_descriptors.free_space_in_bytes AS BIGINT)) AS DECIMAL) / 1024 / 1024) / (CAST(COUNT(*) * 8 AS DECIMAL) / 1024) * 100 AS DECIMAL(5,2)) AS buffer_cache_percent_free_space
FROM sys.dm_os_buffer_descriptors
INNER JOIN sys.allocation_units
ON allocation_units.allocation_unit_id = dm_os_buffer_descriptors.allocation_unit_id
INNER JOIN sys.partitions
ON ((allocation_units.container_id = partitions.hobt_id AND type IN (1,3))
OR (allocation_units.container_id = partitions.partition_id AND type IN (2)))
INNER JOIN sys.objects
ON partitions.object_id = objects.object_id
WHERE allocation_units.type IN (1,2,3)
AND objects.is_ms_shipped = 0
AND dm_os_buffer_descriptors.database_id = DB_ID()
GROUP BY objects.name,
			objects.type_desc,
			objects.object_id
HAVING COUNT(*) > 0
ORDER BY COUNT(*) DESC;
This returns a row per table or indexed view that has at least one page in the buffer cache, ordered by those with the most pages in memory first.
这将返回每个表或索引视图的行,该行在缓冲区高速缓存中至少具有一页,然后按内存中具有最多页面的那些顺序排序。
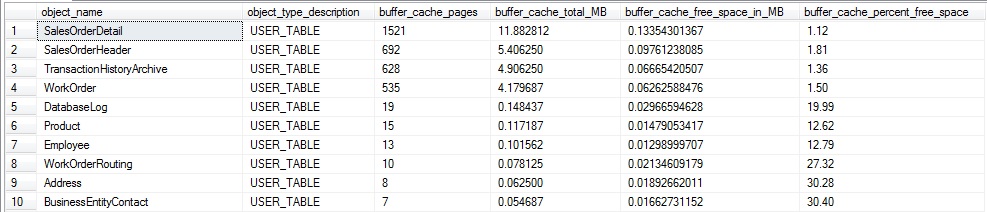
As with our previous example, small tables can be ignored as their impact on buffer cache memory consumption will be negligible. Our top four tables have very small amounts of free space (under 2% each).
与前面的示例一样,小表可以忽略,因为它们对缓冲区高速缓存内存消耗的影响可以忽略不计。 我们的前四个表的可用空间非常小(每个表的不足2%)。
What does this mean exactly? The more free space per page on average, the more pages need to be read in order to return the data that we’re looking for. In addition, more pages are required to store data, meaning more space in memory and on disk is required to maintain our data. Wasted space also means more IOs to get the data we need and queries running longer than needed as this data is retrieved.
这到底是什么意思? 平均每页可用空间越多,需要读取的页面就越多,以返回我们要查找的数据。 此外,需要更多页面来存储数据,这意味着需要更多的内存和磁盘空间来维护我们的数据。 浪费的空间还意味着有更多的IO可以获取我们需要的数据,并且查询运行的时间超过了获取数据所需的时间。
The most common cause of a glut on free space are tables with very wide rows. Since a page is 8k, if a row happened to be 5k, we would never be able to fit a single row onto a page, and there would always be that extra ~3k of free space that cannot be used. Tables with lots of random insert operations can be problematic as well. For example, a non-increasing key may result in page splits as data is written out-of-order. A GUID would be the worst case scenario, but any keys that are not increasing in nature can result in this problem to some extent.
导致可用空间过剩的最常见原因是行非常宽的表。 由于页面是8k,所以如果一行恰好是5k,我们将永远无法在页面上容纳一行,并且总是会有〜3k的额外可用空间无法使用。 具有大量随机插入操作的表也可能会出现问题。 例如,非递增键可能会导致数据无序写入时页面拆分。 GUID将是最坏的情况,但是本质上没有增加的任何键都会在某种程度上导致此问题。
As indexes become fragmented over time, the fragmentation would be seen partly as excess free space when we look at the contents of the buffer cache. Most of these problems are solved with smart database design and sensible database maintenance. This isn’t the place to go into detail on those topics, but there are many articles and presentations on these topics out there for your enjoyment.
随着索引随着时间的推移而变得碎片化,当我们查看缓冲区高速缓存的内容时,碎片化将被部分视为多余的可用空间。 这些问题多数通过智能数据库设计和合理的数据库维护得以解决。 这里不是要详细讨论这些主题的地方,但是有很多关于这些主题的文章和演示供您欣赏。
Early on in this article, we briefly discussed what dirty and clean pages are and their correlation to write operations within a database. Within dm_os_buffer_descriptors we can verify whether a page is clean or not using the is_modified column. This tells us if a page has been modified by a write operation, but has yet to be written back to disk. We can use this information to count the clean vs. dirty pages in the buffer cache for a given database:
在本文的开头,我们简要讨论了什么是脏页和干净页以及它们与数据库内写入操作的相关性。 在dm_os_buffer_descriptors中,我们可以使用is_modified列来验证页面是否干净。 这告诉我们页面是否已被写入操作修改,但尚未写回到磁盘。 我们可以使用此信息来计算给定数据库的缓冲区高速缓存中的干净页和脏页:
SELECT
    databases.name AS database_name,
	COUNT(*) AS buffer_cache_total_pages,
    SUM(CASE WHEN dm_os_buffer_descriptors.is_modified = 1
				THEN 1
				ELSE 0
		END) AS buffer_cache_dirty_pages,
    SUM(CASE WHEN dm_os_buffer_descriptors.is_modified = 1
				THEN 0
				ELSE 1
		END) AS buffer_cache_clean_pages,
    SUM(CASE WHEN dm_os_buffer_descriptors.is_modified = 1
				THEN 1
				ELSE 0
		END) * 8 / 1024 AS buffer_cache_dirty_page_MB,
    SUM(CASE WHEN dm_os_buffer_descriptors.is_modified = 1
				THEN 0
				ELSE 1
		END) * 8 / 1024 AS buffer_cache_clean_page_MB
FROM sys.dm_os_buffer_descriptors
INNER JOIN sys.databases
ON dm_os_buffer_descriptors.database_id = databases.database_id
GROUP BY databases.name;
This query returns page counts and the data size in MB:
该查询返回页数和以MB为单位的数据大小:
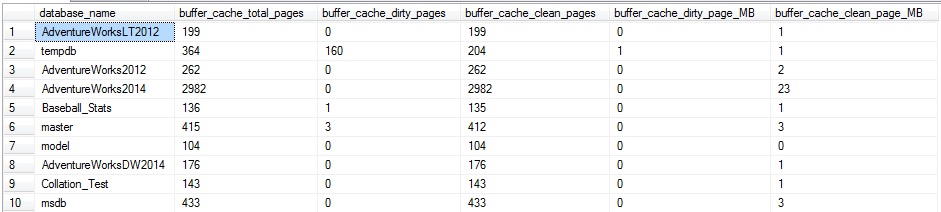
My server doesn’t have too much going on at the moment. If I were to run a big update statement, we could illustrate what we would see when more write operations are going on. Let’s run the following query:
我的服务器目前没有太多操作。 如果我要运行一条大的update语句,我们可以说明在进行更多写操作时会看到什么。 让我们运行以下查询:
UPDATE Sales.SalesOrderDetail
	SET OrderQty = OrderQty
This is essentially a no-op, and will not result in any actual change to the SalesOrderDetail table—but SQL Server will still go through the trouble of updating every row in the table for this particular column. If we run the dirty/clean page count from above, we’ll get some more interesting results:
这本质上是无操作的操作,不会对SalesOrderDetail表进行任何实际更改,但是SQL Server仍会为该特定列更新表中的每一行。 如果我们从上面运行脏页/干净页数,我们将得到一些更有趣的结果:
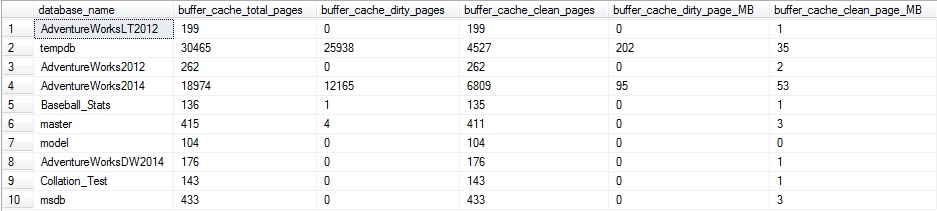
About 2/3 of the pages for AdventureWorks2014 in the buffer cache are dirty. In addition, TempDB also has quite a bit of activity, which is indicative of the update/insert/delete trigger on the table, which caused a large amount of additional TSQL to be executed. The trigger caused there to be quite a few additional reads against AdventureWorks2014, as well as the need for worktable space in TempDB to process those additional operations.
缓冲区缓存中AdventureWorks2014的页面约有2/3脏了。 此外, TempDB还具有很多活动,这表明表上的更新/插入/删除触发器,这导致要执行大量附加的TSQL。 触发器导致对AdventureWorks2014进行了许多其他读取,并且需要TempDB中的工作表空间来处理这些其他操作。
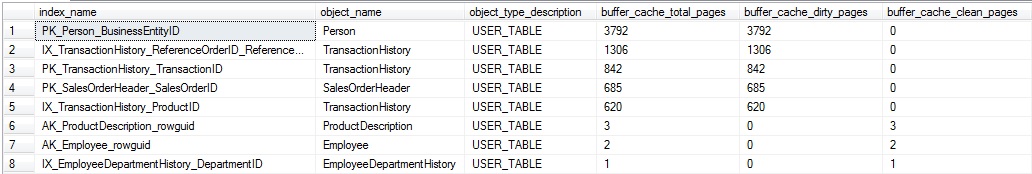
As with before, we can break this out by table or index in order to collect more granular data on buffer cache usage:
与以前一样,我们可以按表或索引进行分类,以便收集有关缓冲区高速缓存使用情况的更多粒度数据:
SELECT
	indexes.name AS index_name,
	objects.name AS object_name,
	objects.type_desc AS object_type_description,
	COUNT(*) AS buffer_cache_total_pages,
    SUM(CASE WHEN dm_os_buffer_descriptors.is_modified = 1
				THEN 1
				ELSE 0
		END) AS buffer_cache_dirty_pages,
    SUM(CASE WHEN dm_os_buffer_descriptors.is_modified = 1
				THEN 0
				ELSE 1
		END) AS buffer_cache_clean_pages,
    SUM(CASE WHEN dm_os_buffer_descriptors.is_modified = 1
				THEN 1
				ELSE 0
		END) * 8 / 1024 AS buffer_cache_dirty_page_MB,
    SUM(CASE WHEN dm_os_buffer_descriptors.is_modified = 1
				THEN 0
				ELSE 1
		END) * 8 / 1024 AS buffer_cache_clean_page_MB
FROM sys.dm_os_buffer_descriptors
INNER JOIN sys.allocation_units
ON allocation_units.allocation_unit_id = dm_os_buffer_descriptors.allocation_unit_id
INNER JOIN sys.partitions
ON ((allocation_units.container_id = partitions.hobt_id AND type IN (1,3))
OR (allocation_units.container_id = partitions.partition_id AND type IN (2)))
INNER JOIN sys.objects
ON partitions.object_id = objects.object_id
INNER JOIN sys.indexes
ON objects.object_id = indexes.object_id
AND partitions.index_id = indexes.index_id
WHERE allocation_units.type IN (1,2,3)
AND objects.is_ms_shipped = 0
AND dm_os_buffer_descriptors.database_id = DB_ID()
GROUP BY indexes.name,
		 objects.name,
		 objects.type_desc
ORDER BY COUNT(*) DESC;
The results show buffer cache usage by index, showing how many of the pages in memory are clean or dirty:
结果按索引显示缓冲区高速缓存的使用情况,显示内存中有多少页面是干净的或脏的:
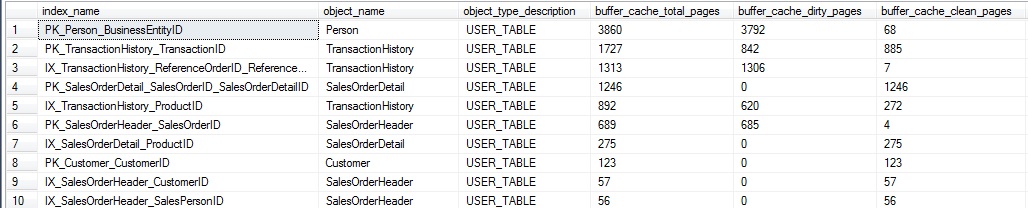
This data provides an idea of the write activity on a given index at this point in time. If it were tracked over a period of days or weeks, we could begin to gauge the overall write activity of the index and trend it. This research could be useful if you were looking to understand the best possible isolation level to use on a database, or if those reports that are always run READ UNCOMMITTED could be more susceptible to dirty reads than originally thought. In this specific case, the dirty pages all relate to the update query that we previously ran above, and therefore comprise a somewhat limited set.
该数据提供了此时对给定索引的写活动的想法。 如果在几天或几周内对其进行了跟踪,我们就可以开始评估该索引的总体写入活动并对其进行趋势化。 如果您想了解要在数据库上使用的最佳隔离级别,或者如果那些始终运行READ UNCOMMITTED的报告可能比原先认为的更容易受到脏读影响,则此研究可能会很有用。 在这种特定情况下,脏页都与我们之前在上面运行的更新查询有关,因此包含一些有限的集合。
DBCC DROPCLEANBUFFERS (DBCC DROPCLEANBUFFERS)
A DBCC command that is often thrown around as a way to test a query and accurately gauge execution speed is DBCC DROPCLEANBUFFERS. When run, this will remove all clean pages from memory for an entire database server, leaving behind only the dirty pages, which will typically be a small minority of data.
DBCC DROPCLEANBUFFERS是经常被用来测试查询和准确评估执行速度的一种DBCC 命令 。 运行时,这将从整个数据库服务器的内存中删除所有干净页,仅留下脏页,这些脏页通常是一小部分数据。
DBCC DROPCLEANBUFFERS is a command that should typically only be run in a non-production environment, and even then, only when there is no performance or load testing being conducted. The result of this command is that the buffer cache will end up mostly empty. Any queries run after this point will need to use physical reads to bring data back into the cache from your storage system, which as we established earlier, is likely much slower than memory.
DBCC DROPCLEANBUFFERS是通常只应在非生产环境中运行的命令,即使在没有进行性能或负载测试的情况下,也应这样运行。 该命令的结果是缓冲区缓存将最终几乎为空。 在此之后运行的任何查询都将需要使用物理读取将数据从存储系统带回到缓存中,正如我们之前所建立的那样,它可能比内存慢得多。
After running this command on my local server, the dirty/clean page query from earlier returns the following:
在本地服务器上运行此命令后,先前的脏页/干净页查询将返回以下内容:
That’s all that’s left! Repeating my previous warning: Treat this command similarly to DBCC FREEPROCCACHE in that it should not be run on any production server unless you absolutely know what you are doing
剩下的就是所有这些! 重复我之前的警告:将此命令与DBCC FREEPROCCACHE相似,因为除非您完全知道自己在做什么,否则不应在任何生产服务器上运行该命令
This can be a useful development tool in that you can run a query in a performance testing environment over and over without any changes in speed/efficiency due to caching of data in memory. Drop the clean buffer data between executions and you’re in business. This can provide misleading results, though, in that production environments will always use the buffer cache, and will not read from your storage system unless necessary. Dropping clean buffers will lead to slower execution times than would otherwise be seen, but can provide a way to test queries in a consistent environment with each execution.
这是一个有用的开发工具,因为您可以在性能测试环境中反复运行查询,而不会因内存中的数据缓存而导致速度/效率发生任何变化。 在执行之间删除干净的缓冲数据,您就可以做生意。 但是,这可能会产生误导性的结果,因为生产环境将始终使用缓冲区高速缓存,除非有必要,否则不会从存储系统读取数据。 删除干净缓冲区将导致执行时间比其他情况下要慢,但是可以提供一种在每次执行时在一致的环境中测试查询的方法。
Understanding all of those caveats, feel free to use this as needed to test and gain insight into query performance, pages read into memory as a result of a query, dirty pages created by a write statement, and so on.
了解所有这些注意事项后,可以根据需要随意使用它来测试和了解查询性能,查询结果将页读入内存,由write语句创建的脏页等等。
网页预期寿命 (Page Life Expectancy)
When discussing memory performance in SQL Server, it is unlikely that we would go a few minutes before someone asks about page life expectancy (PLE for short). PLE is a measure of, on average, how long (in seconds) will a page remain in memory without being accessed, after which point it is removed. This is a metric that we want to be higher as we want our important data to remain in the buffer cache for as long as possible. When PLE gets too low, data is being constantly read from disk (aka: slow) into the buffer cache, removed from the cache, and likely read from disk again in the near future. This is the recipe for a slow (and frustrating) SQL Server!
在讨论SQL Server中的内存性能时,我们不太可能花几分钟的时间询问某人的页面预期寿命(简称PLE)。 PLE是衡量平均一页将在不被访问的情况下保留在内存中的时间(以秒为单位),然后将其删除。 我们希望此指标更高,因为我们希望重要数据尽可能长时间地保留在缓冲区高速缓存中。 当PLE太低时,数据将不断从磁盘(又名:慢速)读取到缓冲区高速缓存中,然后从高速缓存中删除,并可能在不久的将来再次从磁盘读取。 这是缓慢(令人沮丧)SQL Server的诀窍!
To view the current PLE on a server, you can run the following query, which will pull the current value from the performance counter dynamic management view:
要查看服务器上的当前PLE,可以运行以下查询,该查询将从性能计数器动态管理视图中提取当前值:
SELECT
	*
FROM sys.dm_os_performance_counters
WHERE dm_os_performance_counters.object_name LIKE '%Buffer Manager%'
AND dm_os_performance_counters.counter_name = 'Page life expectancy';
The results will look like this:
结果将如下所示:
cntr_value is the value of the performance counter, and on my quiet local server is 210,275 seconds. Since very little data is read or written on my SQL Server, the need to remove data from the buffer cache is low, and therefore PLE is absurdly high. On a more heavily used production server, PLE would almost certainly be lower.
cntr_value是性能计数器的值,在我的安静本地服务器上为210,275秒。 由于在我SQL Server上读取或写入的数据很少,因此从缓冲区高速缓存中删除数据的需求很少,因此PLE非常高。 在使用更频繁的生产服务器上,PLE肯定会更低。
If your server has a NUMA (non-uniform memory access) architecture, then you’ll want to consider PLE for each node separately, which can be done with the following query:
如果您的服务器具有NUMA(非统一内存访问)体系结构,那么您将需要为每个节点分别考虑PLE,这可以通过以下查询完成:
SELECT
	*
FROM sys.dm_os_performance_counters
WHERE dm_os_performance_counters.object_name LIKE '%Buffer Node%'
AND dm_os_performance_counters.counter_name = 'Page life expectancy';
On a server without NUMA, these values will be identical. On a server with a NUMA architecture, there will be multiple PLE rows returned, all of which will add up to the total given for the buffer manager as a whole. If you are working with NUMA, be sure to consider PLE on each node, in addition to the total, as it is possible that one node is a bottleneck, while the overall total looks acceptable
在没有NUMA的服务器上,这些值将相同。 在具有NUMA体系结构的服务器上,将返回多个PLE行,所有这些行将加起来为整个缓冲区管理器提供的总数。 如果您使用的是NUMA,请确保除了总数之外,还要在每个节点上考虑PLE,因为一个节点可能是瓶颈,而总体总数看起来可以接受
The most obvious question now is, “What is a good value for PLE?” To answer this question, we need to dig further into a server to see how much memory it has, and what the expected volume of data being written and read should be. 300 seconds is often thrown around as a good value for PLE, but like many quick & easy answers, it is likely wrong.
现在最明显的问题是:“ PLE有什么好的价值?” 要回答这个问题,我们需要深入研究服务器以查看其拥有多少内存,以及预期的读写数据量是多少。 300秒钟通常被认为是PLE的一个不错的选择,但是像许多快速简便的答案一样,这很可能是错误的。
Before considering what PLE should look like, let’s consider a bit more about what it means. Let’s consider a server that has 256GB of RAM, of which 192GB is allocated to SQL Server in its configuration. I check the dm_os_sys_info view and find out that there is currently about 163GB committed to the buffer cache. Lastly, I check the performance counter above and find out that the PLE on this server is 2000 seconds.
在考虑PLE的外观之前,让我们考虑一下它的含义。 让我们考虑一个具有256GB RAM的服务器,其中192GB在其配置中分配给了SQL Server。 我检查了dm_os_sys_info视图,发现当前大约有163GB提交给缓冲区高速缓存。 最后,我检查了上面的性能计数器,发现该服务器上的PLE为2000秒。
Based on these metrics, we know that we have 163GB of memory available to the buffer cache, and data will exist there for about 2000 seconds. This means that we are reading, on average, 163GB per 2000 seconds, which comes out to be about 83MB/second. This number is very useful as it gives us a clear indicator of how heavily our SQL Server is being access by applications or processes. Before considering what a good PLE is, we need to ask ourselves some questions:
根据这些指标,我们知道缓冲区缓存可使用163GB的内存,并且数据将在那里存在约2000秒。 这意味着我们平均每2000秒读取163GB,大约每秒83MB。 这个数字非常有用,因为它可以清楚地指示应用程序或进程对SQL Server的访问量。 在考虑什么是好的PLE之前,我们需要问自己一些问题:
- How much data traffic to we expect on average by our applications/services? 我们的应用程序/服务平均期望多少数据流量?
- Are there “special” times when backups, index maintenance, archiving, DBCC CheckDB, or other processes may cause PLE to become very low? 备份,索引维护,归档,DBCC CheckDB或其他进程是否会导致PLE变得很低的“特殊”时间?
- Is latency an issue? Are there measurable waits that are causing applications to perform poorly? 延迟是一个问题吗? 是否有可衡量的等待导致应用程序性能下降?
- Are there significant IO waits on the server? 服务器上是否有大量的IO等待?
- Which queries do we expect to read the most data? 我们希望读取哪些查询的数据最多?
In other words, know thine data! The only true answer to the PLE question is that a good value of PLE is one that represents optimal server performance with enough headroom to account for growth and spikes in usage. For example, let’s take the server from earlier, which has 163GB of memory devoted to the buffer cache, an average PLE of 2000 seconds, and the extrapolated throughput of 83MB/second. After some additional research, I discover that performance begins to suffer when PLE dips below 1500 seconds. From this point, I do some further due diligence and find out that the application grows 1% per month (in terms of data size and throughput). As a result, I can extrapolate that in 6 months, I would need 172GB of RAM dedicated to SQL Server in order to maintain a similar level of PLE that we have now. As time marches on, PLE will dip below 1500 seconds more often, and if left alone indefinitely, average PLE would eventually dip below 1500 seconds and performance would be consistently unacceptable.
换句话说,知道您的数据! PLE问题的唯一真实答案是,PLE的高价值代表了服务器的最佳性能,并具有足够的扩展空间以应对增长和使用高峰。 例如,让我们以较早的服务器为例,该服务器具有163GB的内存专用于缓冲区高速缓存,平均PLE为2000秒,并且推断的吞吐量为83MB /秒。 经过一些额外的研究,我发现当PLE降至1500秒以下时,性能就会开始下降。 从这一点出发,我进行了进一步的尽职调查,发现该应用程序每月增长1%(就数据大小和吞吐量而言)。 因此,我可以推断出,在6个月内,我将需要172GB的专用于SQL Server的RAM,以维持与现在相似的PLE水平。 随着时间的流逝,PLE会更频繁地跌落到1500秒以下,如果无限期地搁置,平均PLE最终会跌落到1500秒以下,性能始终无法接受。
These calculations are an important part of capacity planning and ensuring that any organization is ready for the future. This allows us to stay proactive and not simply add RAM to a server when things become intolerably slow. Applications rarely grow 1% per month forever. Rather, they grow based on a mix of data growth, new features, architecture changes, and infrastructure changes. This means that an application may grow 1% per month, but after a major software release, we see growth jump by 10% as a one-time occurrence.
这些计算是容量规划的重要组成部分,并确保任何组织为将来做好准备。 这使我们能够保持主动,而不是在事情变得令人无法忍受的缓慢时,不只是向服务器添加RAM。 应用程序很少永远每月增长1%。 相反,它们是基于数据增长,新功能,体系结构更改和基础结构更改的组合而增长的。 这意味着一个应用程序每月可能增长1%,但是在发布主要软件后,我们认为增长是一次性增长10%。
结论 (Conclusion)
Peeking into the buffer cache is a great way to learn more about how your applications and processes are performing. With this information, you can track down poorly performing queries, identify objects that use more memory than they should, and improve server planning for the future. This knowledge spans development, administration, architecture, and design in terms of who impacts it and who can be influenced by it. As a result, effectively staying on top of your server’s memory management will make your life easier, while improving the experience for anyone that uses your SQL Servers.
深入了解缓冲区高速缓存是一种了解有关您的应用程序和流程如何执行的更多信息的好方法。 有了这些信息,您就可以跟踪性能不佳的查询,确定使用了比其应有的内存更多的对象,并改善服务器的未来规划。 这些知识涉及哪些方面以及哪些方面可能受其影响,涵盖了开发,管理,体系结构和设计。 因此,有效地掌握服务器的内存管理将使您的生活更轻松,同时为使用SQL Server的任何人改善体验。
We jumped into quite a few scripts that can return useful information about the buffer cache, but didn’t necessarily go into great detail about the views and TSQL involved. In a future article, I’ll revisit some of the system views that we used in more detail, as well as delve into page data and some additional ways to use this information towards the benefit of the great good. I expect this will be both exciting and terrifying all at once, and therefore wouldn’t have it any other way
我们跳入了很多脚本,这些脚本可以返回有关缓冲区高速缓存的有用信息,但是不一定要涉及有关视图和TSQL的详细信息。 在以后的文章中,我将重新介绍一些我们更详细使用的系统视图,并深入研究页面数据以及使用这些信息以获取好处的其他方法。 我希望这既会令人兴奋又会令人恐惧,因此不会有其他方式
翻译自: https://www.sqlshack.com/insight-into-the-sql-server-buffer-cache/
sql server 缓存


 被折叠的 条评论
为什么被折叠?
被折叠的 条评论
为什么被折叠?
 到【灌水乐园】发言


