


 支持向量机(SVM)是一种流行的监督学习算法,用于分类和回归任务。它利用内核技巧进行数据转换,找到最佳分类边界。非线性SVM可以捕捉复杂关系,但训练时间较长。文章通过实例展示了SVM如何优于其他模型,特别是处理非线性数据时。
svm.svm
Support Vector Machine has become an extremely popular algorithm. In this post I try to give a simple explanation for how it works and give a few examples using the the Python Scikits libraries. All code is available on Github. I’ll have another post on the details of using Scikits and Sklearn.
支持向量机已经成为一种非常流行的算法。 在这篇文章中,我尝试给出一个简单的解释,以及使用Python Scikits库的一些示例。 所有代码都可以在Github上找到。 我将再发表一篇有关使用Scikits和Sklearn的详细信息。
什么是SVM? (What is SVM?)
SVM is a supervised machine learning algorithm which can be used for classification or regression problems. It uses a technique called the kernel trick to transform your data and then based on these transformations it finds an optimal boundary between the possible outputs. Simply put, it does some extremely complex data transformations, then figures out how to seperate your data based on the labels or outputs you’ve defined.
SVM是一种可监督的机器学习算法,可用于分类或回归问题。 它使用一种称为内核技巧的技术来转换数据,然后根据这些转换在可能的输出之间找到最佳边界。 简而言之,它会执行一些极其复杂的数据转换,然后找出如何根据您定义的标签或输出来分离数据。
那么,什么使它如此出色? (So what makes it so great?)
Well SVM it capable of doing both classification and regression. In this post I’ll focus on using SVM for classification. In particular I’ll be focusing on non-linear SVM, or SVM using a non-linear kernel. Non-linear SVM means that the boundary that the algorithm calculates doesn’t have to be a straight line. The benefit is that you can capture much more complex relationships between your datapoints without having to perform difficult transformations on your own. The downside is that the training time is much longer as it’s much more computationally intensive.
SVM很好,它能够进行分类和回归。 在本文中,我将重点介绍如何使用SVM进行分类。 特别是,我将专注于非线性SVM或使用非线性内核的SVM。 非线性SVM意味着算法计算的边界不必是直线。 好处是您可以捕获数据点之间更复杂的关系,而不必自己执行困难的转换。 缺点是训练时间长得多,因为它的计算量更大。
牛和狼 (Cows and Wolves)
So what is the kernel trick?
那么什么是内核技巧?
The kernel trick takes the data you give it and transforms it. In goes some great features which you think are going to make a great classifier, and out comes some data that you don’t recognize anymore. It is sort of like unraveling a strand of DNA. You start with this harmelss looking vector of data and after putting it through the kernel trick, it’s unraveled and compounded itself until it’s now a much larger set of data that can’t be understood by looking at a spreadsheet. But here lies the magic, in expanding the dataset there are now more obvious boundaries between your classes and the SVM algorithm is able to compute a much more optimal hyperplane.
内核技巧将获取您提供的数据并进行转换。 引入一些您认为会成为一个很好的分类器的出色功能,然后得出一些您不再识别的数据。 这有点像解开一条DNA链。 您首先要看似看起来很杂乱的数据向量,并经过内核技巧之后,才对其进行分解和混合,直到现在它变成了更大的数据集,而通过查看电子表格无法理解。 但这就是魔术,在扩展数据集时,您的类之间现在有了更明显的界限,并且SVM算法能够计算出更加理想的超平面。
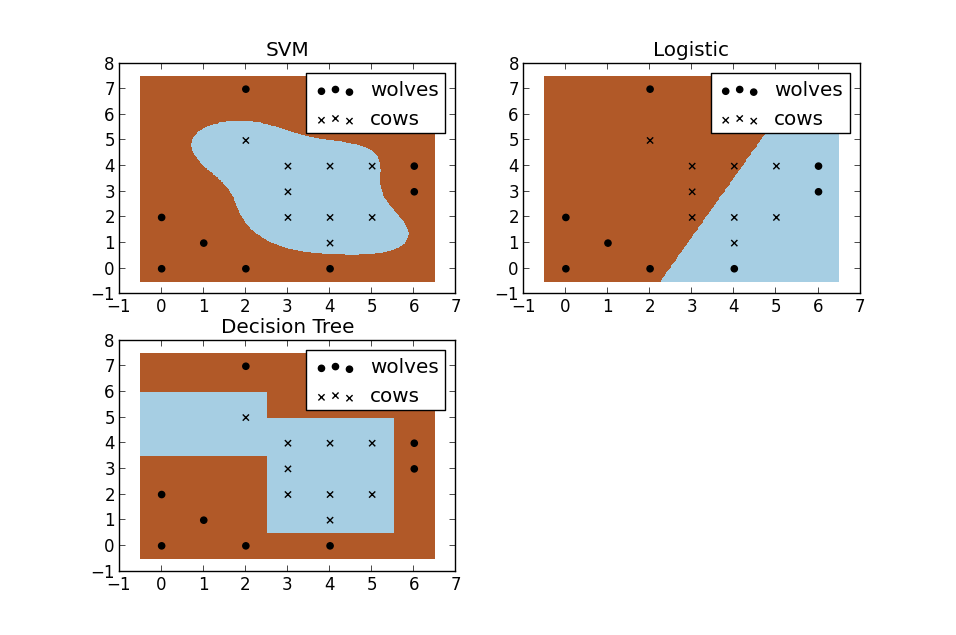
For a second, pretend you’re a farmer and you have a problem–you need to setup a fence to protect your cows from packs of wovles. But where do you build your fence? Well if you’re a really data driven farmer one way you could do it would be to build a classifier based on the position of the cows and wolves in your pasture. Racehorsing a few different types of classifiers, we see that SVM does a great job at seperating your cows from the packs of wolves. I thought these plots also do a nice job of illustrating the benefits of using a non-linear classifiers. You can see the the logistic and decision tree models both only make use of straight lines.
第二,假装你是一个农民,并且遇到了问题–您需要设置围栏,以保护母牛免受成群的母牛的感染。 但是,您在哪里建造篱笆? 好吧,如果您是一个真正的数据驱动型农民,则可以采用的一种方法是,根据牧场中牛和狼的位置建立一个分类器。 通过使用几种不同类型的分类器,我们发现SVM在将您的母牛与狼群分开方面做得很好。 我认为这些图也很好地说明了使用非线性分类器的好处。 您可以看到逻辑模型和决策树模型都仅使用直线。
是否要重新创建分析? (Want to recreate the analysis?)
Want to create these plots for yourself? You can run the code in your terminal or in an IDE of your choice, but, big surprise, I’d recommend Rodeo. It has a great pop-out plot feature that comes in handy for this type of analysis. It also ships with Python already included for Windows machines. Besides that, it’s now lightning fast thanks to the hard work of TakenPilot.
是否想为自己创建这些图? 您可以在终端中或您选择的IDE中运行代码,但是,令我惊讶的是,我推荐Rodeo 。 它具有出色的弹出图功能,可用于此类分析。 它还随Windows计算机附带的Python一起提供。 除此之外,由于TakenPilot的辛勤工作,现在速度很快。
Once you’ve downloaded Rodeo, you’ll need to save the raw cows_and_wolves.txt file from my github. Make sure you’ve set your working directory to where you saved the file.
下载Rodeo后 ,您需要从我的github中保存原始的cows_and_wolves.txt文件。 确保已将工作目录设置为保存文件的位置。
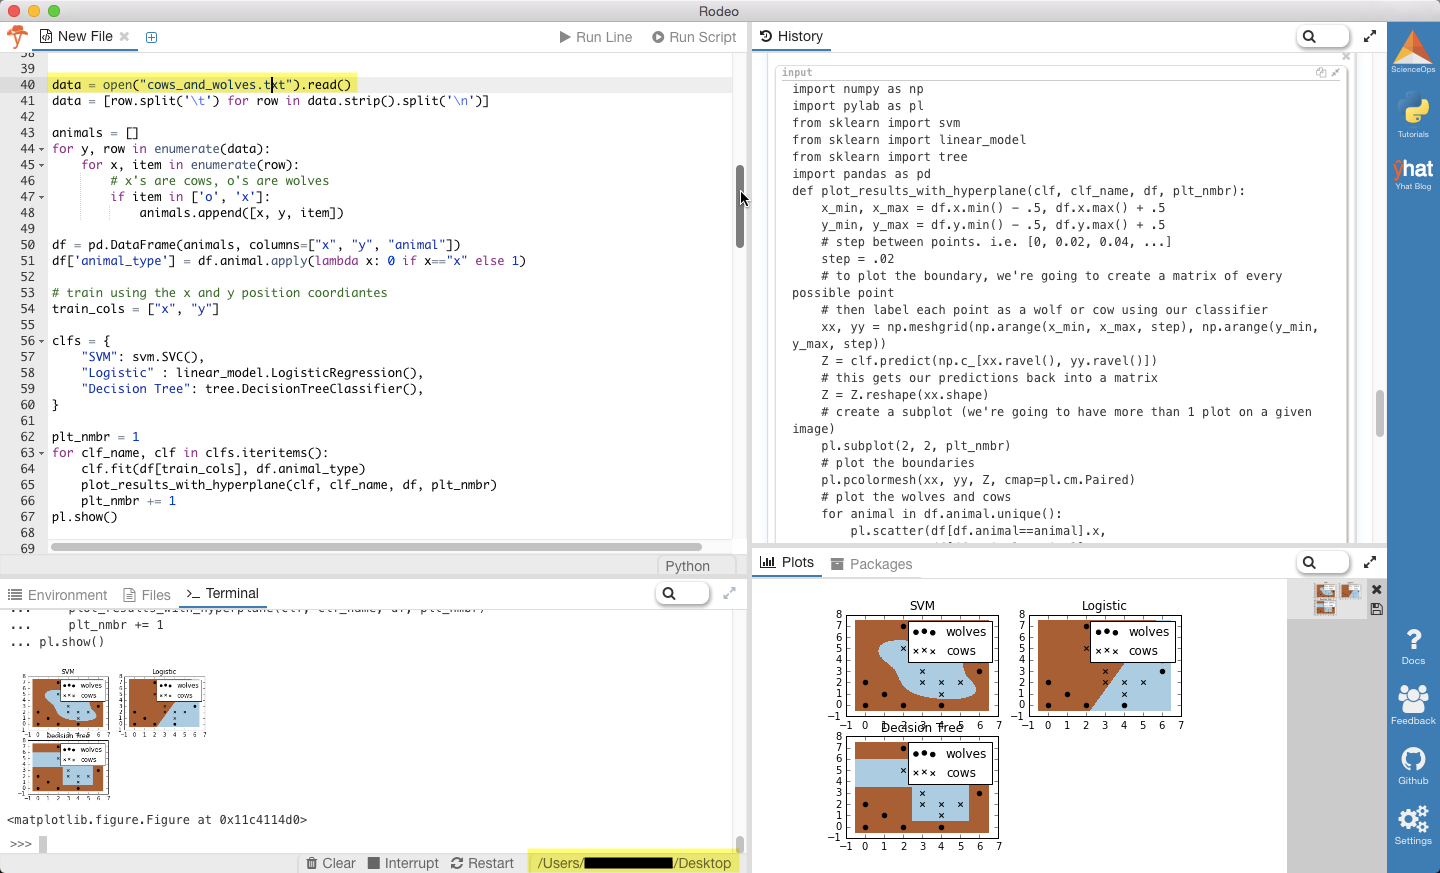
Alrght, now just copy and paste the code below into Rodeo, and run it, either by line or the entire script. Don’t forget, you can pop out your plots tab, move around your windows, or resize them.
Alrght,现在只需将下面的代码复制并粘贴到Rodeo中,然后按行或整个脚本运行它。 别忘了,您可以弹出“图”选项卡,在窗口中移动或调整它们的大小。
# Data driven farmer goes to the Rodeo import numpy as np import pylab as pl from sklearn import svm from sklearn import linear_model from sklearn import tree import pandas as pd def plot_results_with_hyperplane(clf, clf_name, df, plt_nmbr): x_min, x_max = df.x.min() - .5, df.x.max() + .5 y_min, y_max = df.y.min() - .5, df.y.max() + .5 # step between points. i.e. [0, 0.02, 0.04, ...] step = .02 # to plot the boundary, we're going to create a matrix of every possible point # then label each point as a wolf or cow using our classifier xx, yy = np.meshgrid(np.arange(x_min, x_max, step), np.arange(y_min, y_max, step)) Z = clf.predict(np.c_[xx.ravel(), yy.ravel()]) # this gets our predictions back into a matrix Z = Z.reshape(xx.shape) # create a subplot (we're going to have more than 1 plot on a given image) pl.subplot(2, 2, plt_nmbr) # plot the boundaries pl.pcolormesh(xx, yy, Z, cmap=pl.cm.Paired) # plot the wolves and cows for animal in df.animal.unique(): pl.scatter(df[df.animal==animal].x, df[df.animal==animal].y, marker=animal, label="cows" if animal=="x" else "wolves", color='black') pl.title(clf_name) pl.legend(loc="best") data = open("cows_and_wolves.txt").read() data = [row.split('t') for row in data.strip().split('n')] animals = [] for y, row in enumerate(data): for x, item in enumerate(row): # x's are cows, o's are wolves if item in ['o', 'x']: animals.append([x, y, item]) df = pd.DataFrame(animals, columns=["x", "y", "animal"]) df['animal_type'] = df.animal.apply(lambda x: 0 if x=="x" else 1) # train using the x and y position coordiantes train_cols = ["x", "y"] clfs = { "SVM": svm.SVC(), "Logistic" : linear_model.LogisticRegression(), "Decision Tree": tree.DecisionTreeClassifier(), } plt_nmbr = 1 for clf_name, clf in clfs.iteritems(): clf.fit(df[train_cols], df.animal_type) plot_results_with_hyperplane(clf, clf_name, df, plt_nmbr) plt_nmbr += 1 pl.show()# Data driven farmer goes to the Rodeo import numpy as np import pylab as pl from sklearn import svm from sklearn import linear_model from sklearn import tree import pandas as pd def plot_results_with_hyperplane(clf, clf_name, df, plt_nmbr): x_min, x_max = df.x.min() - .5, df.x.max() + .5 y_min, y_max = df.y.min() - .5, df.y.max() + .5 # step between points. i.e. [0, 0.02, 0.04, ...] step = .02 # to plot the boundary, we're going to create a matrix of every possible point # then label each point as a wolf or cow using our classifier xx, yy = np.meshgrid(np.arange(x_min, x_max, step), np.arange(y_min, y_max, step)) Z = clf.predict(np.c_[xx.ravel(), yy.ravel()]) # this gets our predictions back into a matrix Z = Z.reshape(xx.shape) # create a subplot (we're going to have more than 1 plot on a given image) pl.subplot(2, 2, plt_nmbr) # plot the boundaries pl.pcolormesh(xx, yy, Z, cmap=pl.cm.Paired) # plot the wolves and cows for animal in df.animal.unique(): pl.scatter(df[df.animal==animal].x, df[df.animal==animal].y, marker=animal, label="cows" if animal=="x" else "wolves", color='black') pl.title(clf_name) pl.legend(loc="best") data = open("cows_and_wolves.txt").read() data = [row.split('t') for row in data.strip().split('n')] animals = [] for y, row in enumerate(data): for x, item in enumerate(row): # x's are cows, o's are wolves if item in ['o', 'x']: animals.append([x, y, item]) df = pd.DataFrame(animals, columns=["x", "y", "animal"]) df['animal_type'] = df.animal.apply(lambda x: 0 if x=="x" else 1) # train using the x and y position coordiantes train_cols = ["x", "y"] clfs = { "SVM": svm.SVC(), "Logistic" : linear_model.LogisticRegression(), "Decision Tree": tree.DecisionTreeClassifier(), } plt_nmbr = 1 for clf_name, clf in clfs.iteritems(): clf.fit(df[train_cols], df.animal_type) plot_results_with_hyperplane(clf, clf_name, df, plt_nmbr) plt_nmbr += 1 pl.show()
让SVM努力工作 (Let SVM do the hard work)
In the event that the relationship between a dependent variable and independent variable is non-linear, it’s not going to be nearly as accurate as SVM. Taking transformations between variables (log(x), (x^2)) becomes much less important since it’s going to be accounted for in the algorithm. If you’re still having troubles picturing this, see if you can follow along with this example.
如果因变量和自变量之间的关系是非线性的,那么它的准确性将不如SVM。 在变量(log(x),(x ^ 2))之间进行转换变得不那么重要了,因为它将在算法中予以考虑。 如果您仍然难以想象这个,请查看您是否可以继续阅读本示例。
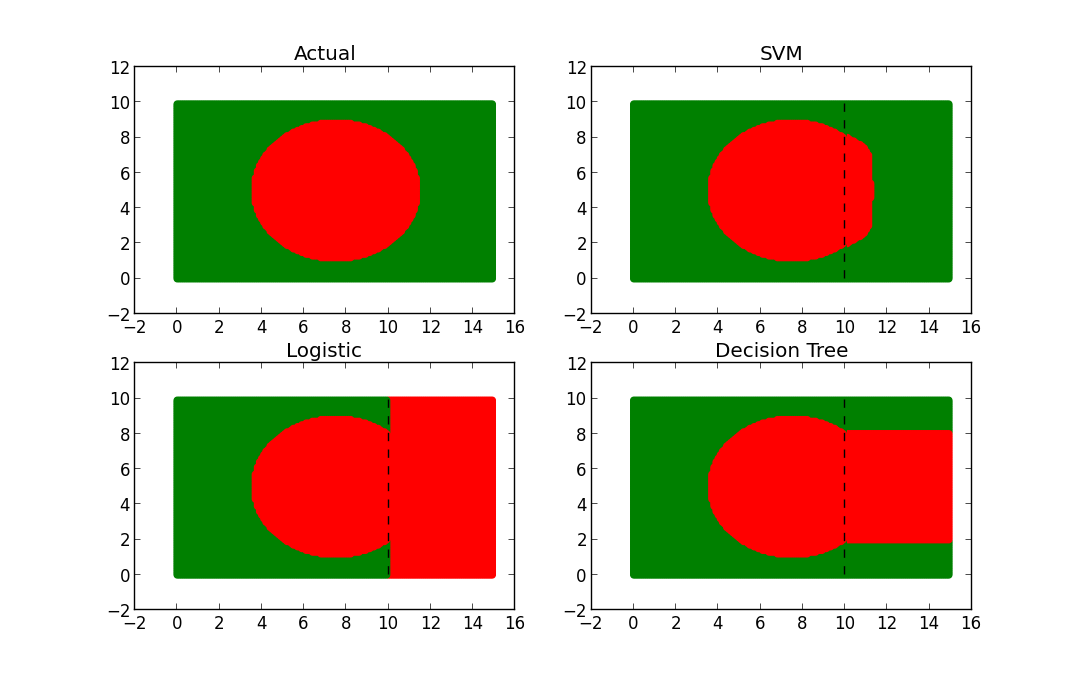
Let’s say we have a dataset that consists of green and red points. When plotted with their coordinates, the points make the shape of a red circle with a green outline (and look an awful lot like Bangladesh’s flag).
假设我们有一个包含绿色和红色点的数据集。 当用坐标绘制时,这些点将形成带有绿色轮廓的红色圆圈(看起来很像孟加拉国的国旗)。
What would happen if somehow we lost 1/3 of our data. What if we couldn’t recover it and we wanted to find a way to approximate what that missing 1/3 looked like.
如果以某种方式丢失了1/3的数据,将会发生什么。 如果我们无法恢复它,我们想找到一种方法来估计丢失的1/3的样子。
So how do we figure out what the missing 1/3 looks like? One approach might be to build a model using the 80% of the data we do have as a training set. But what type of model do we use? Let’s try out the following:– Logistic model– Decision Tree– SVM
那么我们如何找出缺失的1/3的样子呢? 一种方法可能是使用我们拥有的80%数据作为训练集来构建模型。 但是,我们使用哪种类型的模型? 让我们尝试以下方法:–物流模型–决策树–支持向量机
I trained each model and then used each to make predictions on the missing 1/3 of our data. Let’s take a look at what our predicted shapes look like…
我训练了每个模型,然后使用每个模型对缺失的1/3数据进行了预测。 让我们看一下我们预测的形状是什么样的...
跟着 (Follow along)
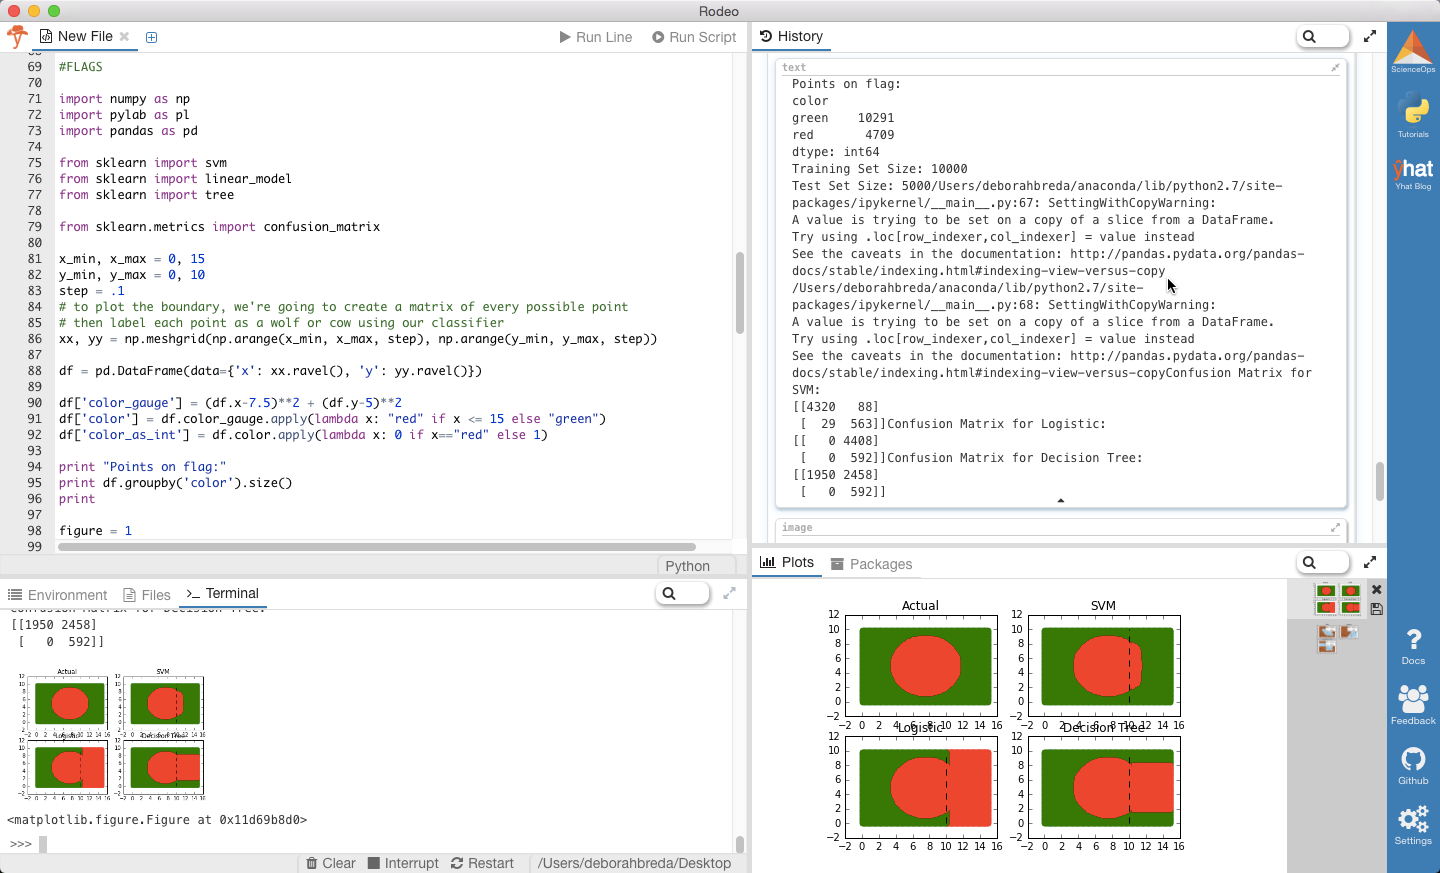
Here’s the code to compare your logistic model, decision tree and SVM.
这是比较您的物流模型,决策树和SVM的代码。
结果 (Results)
From the plots, it’s pretty clear that SVM is the winner. But why? Well if you look at the predicted shapes of the decision tree and GLM models, what do you notice? Straight boundaries. Our input model did not include any transformations to account for the non-linear relationship between x, y, and the color. Given a specific set of transformations we definitely could have made GLM and the DT perform better, but why waste time? With no complex transformations or scaling, SVM only misclassified 117/5000 points (98% accuracy as opposed to DT-51% and GLM-12%! Of those all misclassified points were red–hence the slight bulge.
从图中可以明显看出,SVM是赢家。 但为什么? 好吧,如果您查看决策树和GLM模型的预测形状,您会注意到什么? 直线界限。 我们的输入模型不包含任何转换来说明x,y和颜色之间的非线性关系。 给定一组特定的转换,我们当然可以使GLM和DT性能更好,但是为什么要浪费时间呢? 由于没有复杂的转换或缩放,SVM仅对117/5000点进行了错误分类(98%的准确度,而DT-51%和GLM-12%!)在所有错误分类的点中都是红色的-因此略微凸起。
什么时候不使用 (When not to use it)
So why not use SVM for everything? Well unfortunately the magic of SVM is also the biggest drawback. The complex data transformations and resulting boundary plane are very difficult to interpret. This is why it’s often called a black box. GLM and decision trees on the contrary are exactly the opposite. It’s very easy to understand exactly what and why DT and GLM are doing at the expense of performance.
那么,为什么不对所有内容都使用SVM? 不幸的是,SVM的魔力也是最大的缺点。 复杂的数据转换和由此产生的边界平面很难解释。 这就是为什么它通常被称为黑匣子的原因。 相反,GLM和决策树恰恰相反。 准确了解DT和GLM在做什么以及为什么这样做是以牺牲性能为代价的,这非常容易。
更多资源 (More Resources)
svm.svm


 1084
1084

 被折叠的 条评论
为什么被折叠?
被折叠的 条评论
为什么被折叠?
 到【灌水乐园】发言


