


 Amazon CloudWatch是一款AWS服务,用于集中监控和管理云资源的指标。它提供仪表板、警报和操作,以基于监视数据采取行动,减少手动监控需求。CloudWatch通过收集和显示资源的多种数据点,如CPU使用率,帮助简化跨服务的监控。用户可以创建自定义指标,设置警报,并根据阈值触发自动扩展或通知等操作。
Amazon CloudWatch monitors your resources on Amazon Web Service (AWS) cloud. As we know that AWS offers over 140 services in its cloud that powers hundreds and thousands of businesses worldwide. And each of the services has a number of resources in it. So, there is a need to centralize the monitoring system with extended capability. AWS CloudWatch solves this problem and can virtually monitor almost every resource on AWS cloud.
Amazon CloudWatch监视您在Amazon Web Service(AWS)云上的资源。 众所周知,AWS在其云中提供了140多种服务 ,为全球成千上万的企业提供支持。 每个服务中都有许多资源。 因此,需要集中具有扩展功能的监视系统。 AWS CloudWatch解决了此问题,并且可以虚拟监控AWS云上的几乎所有资源。
Only monitoring isn’t sufficient in Cloud-based application. Amazon CloudWatch not just offers resource monitoring, it also comes with alarms, notifications, and actions. You can take certain actions based on your monitoring metrics. This reduces human and manual monitoring & actions which are very crucial for big deployments.
在基于云的应用程序中,仅监视是不够的。 Amazon CloudWatch不仅提供资源监控,还附带警报,通知和操作。 您可以根据监视指标采取某些措施。 这减少了人工和手动监控以及对大型部署至关重要的动作。
什么是Amazon CloudWatch? (What is Amazon CloudWatch?)
You might have started understanding the Amazon CloudWatch. It’s a service on AWS which monitors all your resources and application that you use or run. You can virtually monitor every resource, service, and application with Amazon CloudWatch.
您可能已经开始了解Amazon CloudWatch。 它是AWS上的一项服务,可监视您使用或运行的所有资源和应用程序。 您可以使用Amazon CloudWatch虚拟监控每个资源,服务和应用程序。
Amazon CloudWatch allows you to create Dashboards which will display metrics as per your monitoring needs. You can also create Alarms and take actions based on the thresholds. Notifications for the same can be triggered which can send emails to your mailbox.
Amazon CloudWatch允许您创建仪表板,该仪表板将根据您的监控需求显示指标。 您还可以创建警报并根据阈值采取措施。 可以触发相同的通知,该通知可以将电子邮件发送到您的邮箱。
为什么选择Amazon CloudWatch? (Why Amazon CloudWatch?)
There are so many tools and software available for monitoring different platforms and applications. Almost, each platform and software offers monitoring tools with it. But the root problem is that when you are using a handful of services, applications, and software then it becomes nearly impossible to install and manage different monitoring tools.
有太多工具和软件可用于监视不同的平台和应用程序。 几乎每个平台和软件都提供了监视工具。 但是根本的问题是,当您使用少量服务,应用程序和软件时,几乎不可能安装和管理不同的监视工具。
Here Amazon CloudWatch comes in picture. You don’t need to install and manage different monitoring tools for the service that you use. You have almost all metrics available starting from HTTP error codes to CPU usage.
这里是Amazon CloudWatch的图片。 您无需为所使用的服务安装和管理其他监视工具。 从HTTP错误代码到CPU使用率,几乎所有指标都可用。
Amazon CloudWatch如何工作? ( How Amazon CloudWatch Works?)
Amazon Cloud watch is a service just like any other service on AWS. It stores all the monitoring related data and displays that data. In simple words, it’s a metrics repository. All of the services on AWS puts the monitoring data to this repository.
就像AWS上的任何其他服务一样,Amazon Cloud watch是一项服务。 它存储所有与监视相关的数据并显示该数据。 简而言之,它是一个指标存储库。 AWS上的所有服务都将监视数据放入此存储库。

How Cloudwatch Works (Source: Amazon Web Services)
Cloudwatch的工作方式(来源:Amazon Web Services)
The statistics data can be presented in forms of various graphs which you can use in creating metrics and display on the Dashboards.
可以以各种图形的形式显示统计数据,可用于创建度量并显示在仪表板上。
You can also link the EC2 scalability decision to the Amazon CloudWatch. Based on the threshold it can scale up and down the EC2 instances.
您还可以将EC2可扩展性决策链接到Amazon CloudWatch。 根据阈值,它可以按比例放大和缩小EC2实例。
Amazon CloudWatch also allows you to create custom metrics which can be stored to metrics repository and retrieve the statistics data.
Amazon CloudWatch还允许您创建自定义指标,该指标可以存储到指标存储库中并检索统计数据。
Let’s understand the terminology and concepts of Amazon CloudWatch:
让我们了解Amazon CloudWatch的术语和概念:
指标 (Metrics)
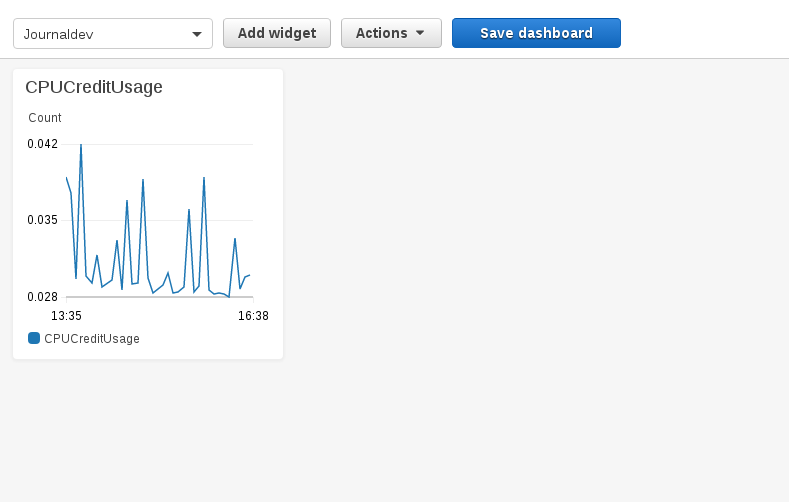
Metrics are the core of Amazon CloudWatch fundamentals. Metrics contains the data points stored by the various services of the AWS cloud. For Example: Below is the metrics of CPU credit usage of an EC2 machine running on t2 series (Learn more about Amazon EC2). See the example metrics below from AWS CloudWatch:
指标是Amazon CloudWatch基础知识的核心。 指标包含由AWS云的各种服务存储的数据点。 例如:以下是在t2系列上运行的EC2计算机的CPU信用使用率指标(了解有关Amazon EC2的更多信息)。 请参阅以下来自AWS CloudWatch的示例指标:
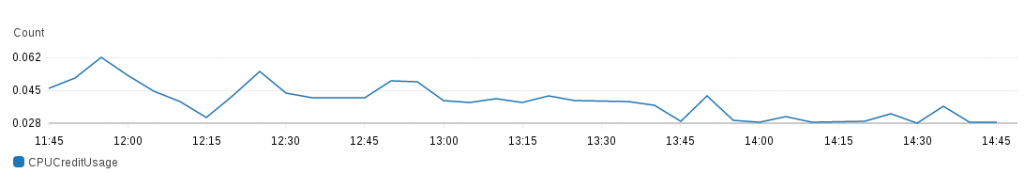
Cpu Credit Usage Metrics
Cpu信用使用率指标
约会时间 (DateTime)
Each data point in metrics stores a timestamp when it was recorded. Timestamps are DateTime objects, with the date, hours, minutes, and seconds (for example, 2019-09-12T11:55:24Z).
指标中的每个数据点都会存储一个记录时的时间戳记。 时间戳是DateTime对象,具有日期,小时,分钟和秒(例如,2019-09-12T11:55:24Z)。
保留 (Retention)
Metrics data points are associated with the retention policy as well. Retention means that when this data would not be retained.
指标数据点也与保留策略相关联。 保留是指将不保留此数据的时间。
Data points with a period of:
数据点的周期为:
- fewer than 60 seconds are available for 3 hours. 少于60秒的可用时间为3个小时。
- 60 seconds (1 minute) are available for 15 days 60秒(1分钟)可用15天
- 300 seconds (5 minutes) are available for 63 days 300秒(5分钟)可用63天
- 3600 seconds (1 hour) are available for 455 days (15 months) 3600秒(1小时)可用455天(15个月)
命名空间 (Namespaces)
If you are a programmer then you might know the concept of namespaces. In Amazon CloudWatch, namespaces are used to isolate the different metrics. These are basically the containers of metrics.
如果您是一名程序员,那么您可能知道名称空间的概念。 在Amazon CloudWatch中,名称空间用于隔离不同的指标。 这些基本上是度量标准的容器。
统计 (Statistics)
Statistics are the aggregations of data points for a certain time period. We already know that the metrics store the data point with the timestamp. AWS CloudWatch provides some predefined statistics for your metrics.
统计信息是特定时间段内数据点的汇总。 我们已经知道度量标准存储带有时间戳的数据点。 AWS CloudWatch为您的指标提供了一些预定义的统计信息。
The available statistics are:
可用的统计信息是:
- Minimum – Minimum value observed during the specified time period. 最小值 –在指定时间段内观察到的最小值。
- Maximum – Maximum value observed during the specified time period. 最大值 –在指定时间段内观察到的最大值。
- Sum – Sum of the valuea during the specified time period. 总计 –指定时间段内的valuea的总和。
- Average – Sum/Count during the specified time period. 平均值 –指定时间段内的总和/计数。
- SampleCount – The count of statistical data pointss SampleCount –统计数据点的计数
警报器 (Alarms)
Alarms in Amazon CloudWatch are used to initiate automated actions when a threshold has been breached. Alarms keep watching the metrics over a specified time period. If the threshold defined by you have been breached then it can take action like scale the EC2 instance or send an SNS topic etc.
违反阈值时,Amazon CloudWatch中的警报用于启动自动操作。 警报会在指定时间段内持续监视指标。 如果违反了您定义的阈值,则可以采取措施扩展EC2实例或发送SNS主题等。
外型尺寸 (Dimensions)
Dimensions help you to decide the structure of statistics plan. A dimension is a name/value pair that is part of the identity of a metric. You can assign up to 10 dimensions to a metric.
维度可帮助您确定统计计划的结构。 维度是作为度量标识的一部分的名称/值对。 您最多可以为一个指标分配10个维度。
For example, Server=Prod, Domain-Rio.
例如,Server = Prod,Domain-Rio。
Amazon CloudWatch入门 (Get Started with Amazon CloudWatch)
Let’s get started with Amazon CloudWatch:
让我们开始使用Amazon CloudWatch:
- Go to the Amazon EC2 console at https://console.aws.amazon.com/. 转到位于https://console.aws.amazon.com/的Amazon EC2控制台。
- Go to Service tab and search for “CloudWatch”. 转到服务选项卡,然后搜索“ CloudWatch” 。
- You will see the default dashboard of CloudWatch. See the below screenshot:
您将看到CloudWatch的默认仪表板。 请参见以下屏幕截图:
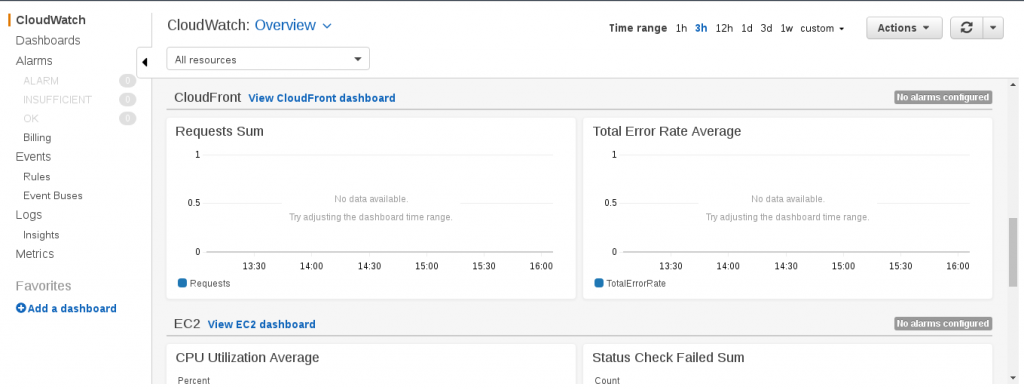
Cloudwatch Default Dashboard
Cloudwatch默认仪表板
使用CloudWatch (Using CloudWatch)
Amazon CloudWatch allows you to create your own dashboards. Dashboards are customizable which you can use to monitor your resources on AWS Cloud.
Amazon CloudWatch允许您创建自己的仪表板。 仪表板是可自定义的,可用于监视AWS Cloud上的资源。
创建仪表板 ( Create Dashboard)
Click on the menu “Dashboards” in the left section of CloudWatch home page and you will see the below screen.
单击CloudWatch主页左侧部分中的菜单“仪表板” ,您将看到以下屏幕。

Create Dashboard Home
创建仪表板主页
Click on “Create dashboard” and enter the name of the dashboard.
单击“创建仪表盘”,然后输入仪表盘的名称。
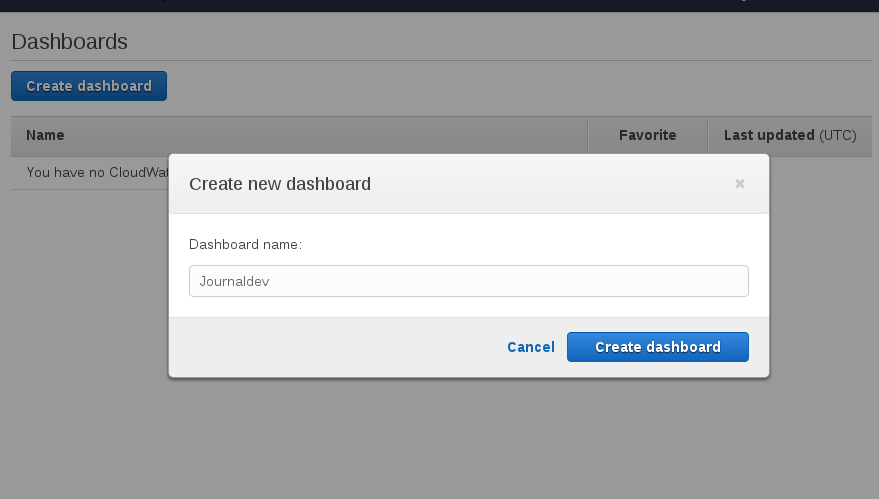
Create New Dashboard
创建新的仪表板
添加到此仪表板 (Add to this dashboard )
You can choose to add to the dashboard.
您可以选择添加到仪表板。
Add To Dashboard
添加到仪表板
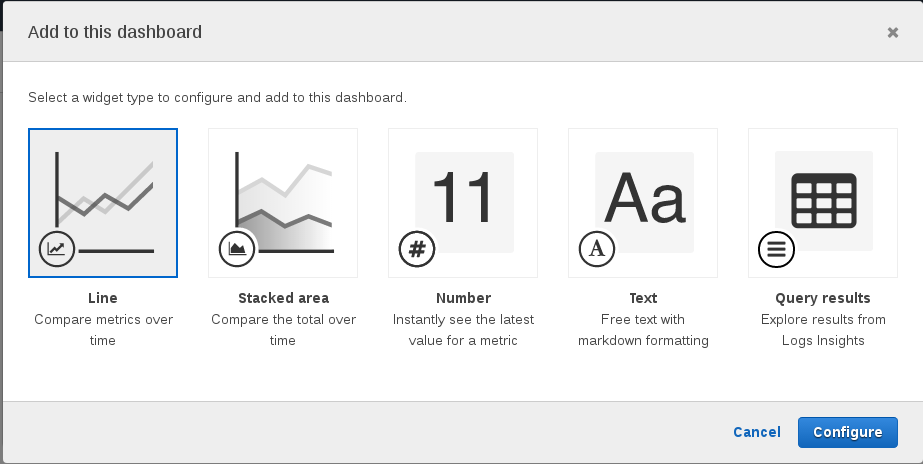
添加指标图 (Add Metric Graph)
Initially, your CloudWatch graph would be empty and you have to add some metrics in it.
最初,您的CloudWatch图将为空,您必须在其中添加一些指标。

Add Metrics
添加指标
There is a number of metrics available by default, you can choose from them. Click on the EC2 Metrics and you will see the “Per Instance Metrics”.
默认情况下,有许多指标可用,您可以从中选择。 单击EC2指标,您将看到“每实例指标”。
Choose “CPUCreditUsage” metrics and click on Configure. AWS will take a few seconds to create the Dashboard from here.
选择“ CPUCreditUsage”指标,然后单击“ 配置” 。 AWS将需要几秒钟从此处创建仪表板。
Metrics Added To Dashboard
指标已添加到仪表板
Note: You can add as many widgets as you want from “Add Widget” option.
注意:您可以从“添加小部件”选项中添加任意数量的小部件。
Now, click on “Save Dashboard”
现在,单击“保存仪表板”
查看仪表板 (View Dashboard)
Your dashboard has been added and you can see your dashboard “Journaldev” on the dashboard list.
您的仪表板已添加,您可以在仪表板列表中看到仪表板“ Journaldev”。

Cloudwatch Dashboard List
Cloudwatch仪表板列表
添加闹钟 (Add Alarm)
You have used metrics and created your own dashboard. Now, let’s create an alarm on metrics.
您已使用指标并创建了自己的仪表板。 现在,让我们创建有关指标的警报。
To create an alarm, click on “Alarms” and you will see an empty page below.
要创建警报,请单击“警报” ,您将在下面看到一个空白页面。
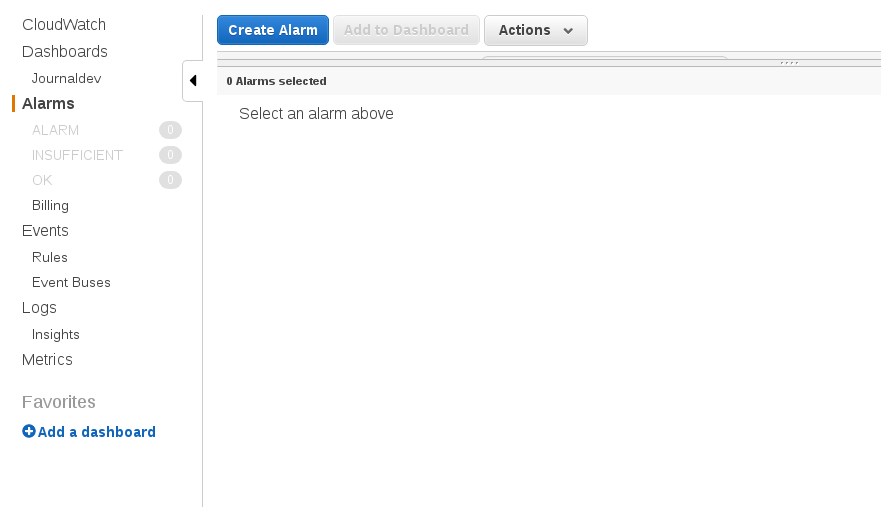
Create Alarm
创建警报
Click on “Create Alarm” and you will be asked to fill the below details.
单击“创建警报”,然后将要求您填写以下详细信息。

Create New Alarm
创建新警报
Choose a metric from the list of available metrics. Enter the name of the alarm and add a condition in whenever section. See the samples below:
从可用指标列表中选择一个指标。 输入警报的名称,并在任何时候部分中添加条件。 请参阅以下示例:

Add Alarm Details
添加警报详细信息
添加动作 ( Add Actions)
You can take actions if the alarm triggered and breached the threshold as explained above. There are a number of actions that you take:
如果警报触发并超出阈值,则可以采取措施,如上所述。 您可以采取多种措施:
- Notfications: You can send notification to the email list whenever the alarm state is insifficient.
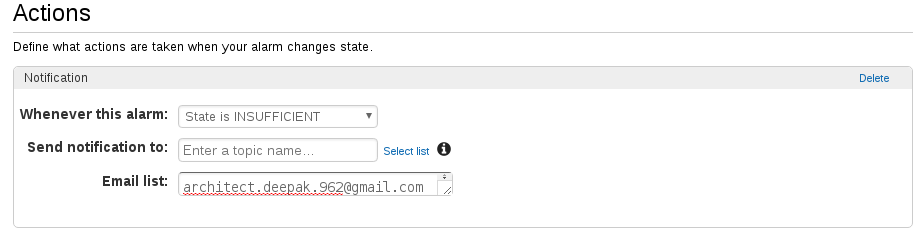
Alarm Notifications
Note: You can add more than one notifications as well.
通知:警报状态不充分时,您可以将通知发送到电子邮件列表。警报通知
注意:您也可以添加多个通知。
- AutoScaling Action: You can autoscale the service that you want as an action of the alarm. See below:
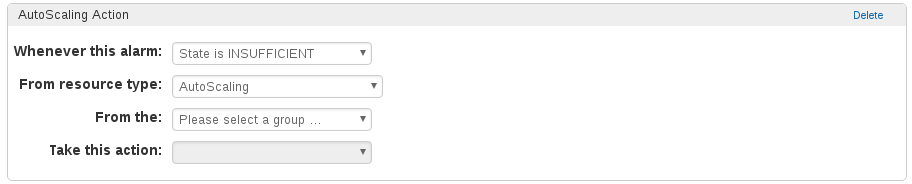
Autoscaling Action
Note: This is just for information, to do the autoscaling, you need to know scaling and how to scale a software or service. We will post about it soon.
AutoScaling Action:您可以将警报服务自动缩放为所需的服务。 见下文:自动缩放动作
注意:这仅是供参考,要进行自动缩放,您需要了解缩放以及如何缩放软件或服务。 我们将很快发布。
- EC2 Action: You can take a number of EC2 actions on based of alarm state. Such as terminate, recover, stop, and reboot the instance. See the below screenshot:
EC2操作:您可以根据警报状态采取多种EC2操作。 例如终止,恢复,停止和重新启动实例。 请参见以下屏幕截图:
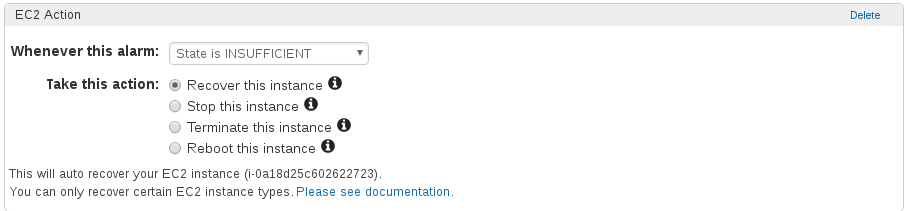
Ec2 Action
Ec2动作
Note: You can take any number or combination of action as per your need. There is as such restrictions in Amazon CloudWatch.
注意:您可以根据需要采取任何数量的动作或组合动作。 Amazon CloudWatch中存在此类限制。


 429
429

 被折叠的 条评论
为什么被折叠?
被折叠的 条评论
为什么被折叠?
 到【灌水乐园】发言


