


visio2003_sp3
One of the most challenging things I've run into as a SharePoint consultant is creating a
作为SharePoint顾问,我遇到的最具挑战性的事情之一就是创建一个
visual sitemap of a SharePoint environment. Visual maps are so much more effective when showing clients what their environment looks like and how it can be optimized when performing a migration, security review, or consolidation effort. My inspiration for publishing this article is hoping it will provide others in the same position an easy way to get a visual overview of their SharePoint environment.
SharePoint环境的可视站点地图。 在向客户显示其环境外观以及在执行迁移,安全性检查或整合工作时如何对其进行优化时,可视化地图的效率要高得多。 我发布本文的灵感是希望它将为处于相同位置的其他人提供一种简便的方法,以直观地了解其SharePoint环境。

*NOTE: The yellow colored objects were manually set. I try to get only 1 row of pages in Visio. If any go beyond 1 row, I put them in a different Visio sheet and uniquely identify that node by changing the color.
* 注意 :黄色对象是手动设置的。 我尝试在Visio中仅获得1行页面。 如果有任何超出1行的地方,我将它们放在不同的Visio工作表中,并通过更改颜色来唯一标识该节点。
Run this PowerShell script.
运行此PowerShell脚本。
- By default it uses the local SharePoint environment so it should be run on the SP server itself. 默认情况下,它使用本地SharePoint环境,因此应在SP服务器本身上运行。
- If you want to specify a specific WebApplication, you can modify the script. 如果要指定特定的WebApplication,则可以修改脚本。
- This was written for WSS 3.0 and MOSS 2007 to run using PowerShell 1.0 because that's what many companies are migrating from. For 2010 and 2013 I'm aware there are optimizations that could be made to the script 这是为WSS 3.0和MOSS 2007编写的,以使其能够使用PowerShell 1.0运行,因为这是许多公司从中进行迁移的原因 。 对于2010年和2013年,我知道可以对脚本进行一些优化
#clear the PowerShell window
cls

#Set or reset default properties
$ReportPath = "SPSiteReport.csv"
$Result=""
$Count=0

#Load the PowerShell commandlets for SharePoint using PowerShell 1.0 and MOSS 2007 compatibility
[System.Reflection.Assembly]::LoadWithPartialName("Microsoft.SharePoint")
$farm = [Microsoft.SharePoint.Administration.SPFarm]::Local

#Print the header in the resulting file
$Header = " `tCount`tTitle`tURL`tType`tID`tParent"
Out-File -inputobject $Header -filepath $ReportPath -Force


    foreach ($spService in $farm.Services) {
        if (!($spService -is [Microsoft.SharePoint.Administration.SPWebService])) {
            continue;
        }

        foreach ($webApp in $spService.WebApplications) {
            if ($webApp -is [Microsoft.SharePoint.Administration.SPAdministrationWebApplication]) { continue }

            foreach ($site in $webApp.Sites) {

                foreach ($web in $site.AllWebs) {

					foreach ( $List in $Web.Lists )
                    {
						#Get the count of items in the current list
                        $Count = $Count + ($List.Folders.Count + $List.Items.Count)
						Write-Progress -activity "Inventorying items. . ." -status "Processing items in Site> $web - List> $list"
                    }
					#Output the result of the current list

					$Result = " " + "`t" + $Count + "`t" + $Web.Title + "`t" + $Web.URL + "`t" + $List.BaseType + "`t" + $web.ID + "`t" + $web.ParentWebID

					Out-File -inputobject $Result -filepath $ReportPath -append

					#Reset the item counter
                    $Count=0
                }
            }
        }
    }
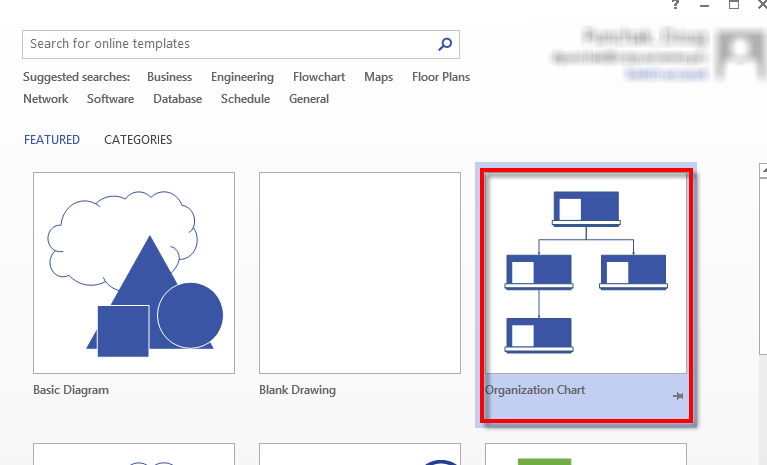
After running the script, you will have a csv file that will contain the information exported from the script. Now, open MS Visio and create a new Organizational Chart. I'm using Visio 2013.
运行脚本后,您将拥有一个csv文件,其中将包含从脚本导出的信息。 现在,打开MS Visio并创建一个新的组织结构图。 我正在使用Visio 2013。
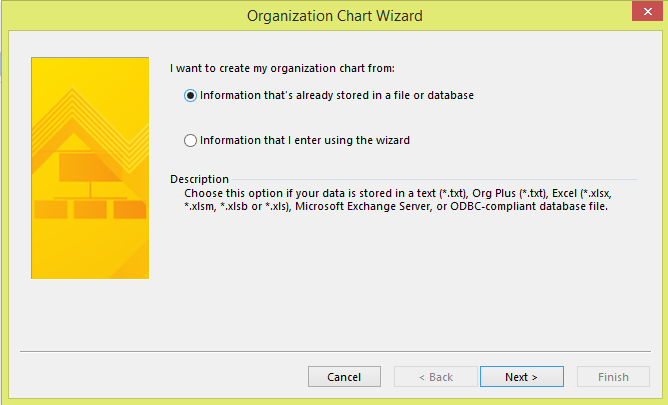
Since we have the CSV file already, use the option for "Information that's already stored in a file or database"
由于我们已经有了CSV文件,因此请使用选项“已存储在文件或数据库中的信息”
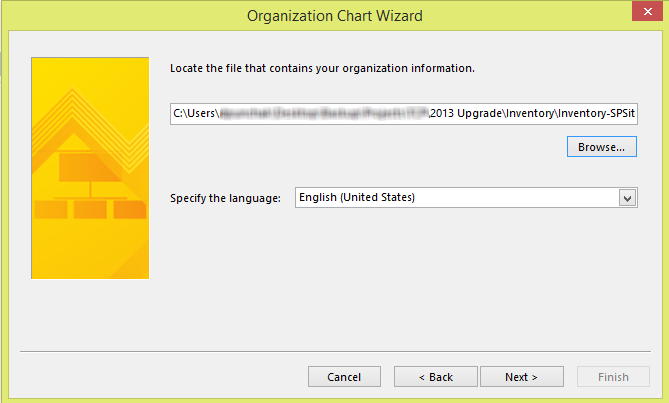
Browse to the file that the script created
浏览到脚本创建的文件
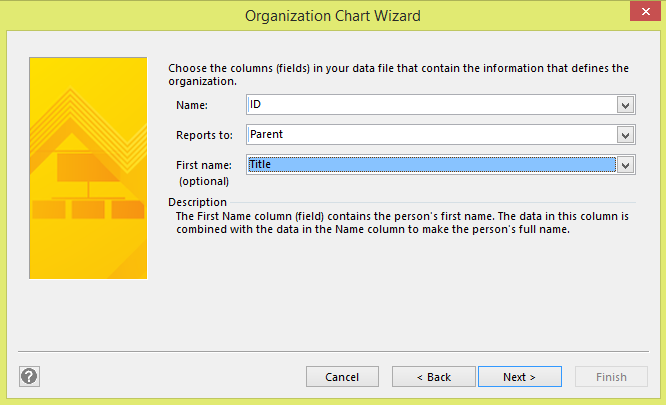
Here, you want to have the fields setup as follows:
在这里,您需要如下设置字段:
Name: ID
名称:ID
Reports To: Parent
报告给:父母
First Name: Title
名:头衔
This takes the columns it found in the csv file and is asking you how it is organized hierarchically. The ID and Parent are the GUIDs of the sites showing the lineage. The First Name is the name of the respective site
这将获取在csv文件中找到的列,并询问您如何对其进行分层组织。 ID和父级是显示血统的站点的GUID。 名字是相应站点的名称
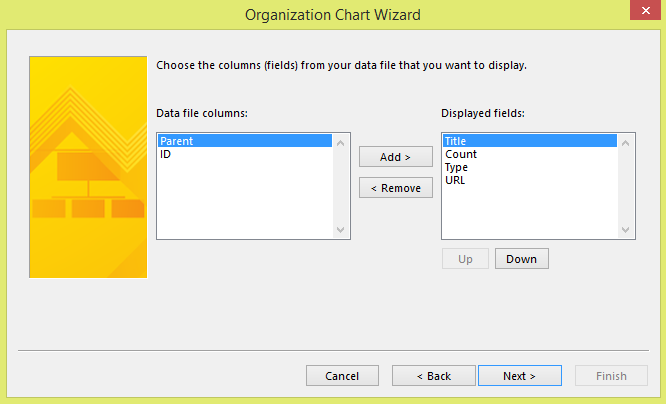
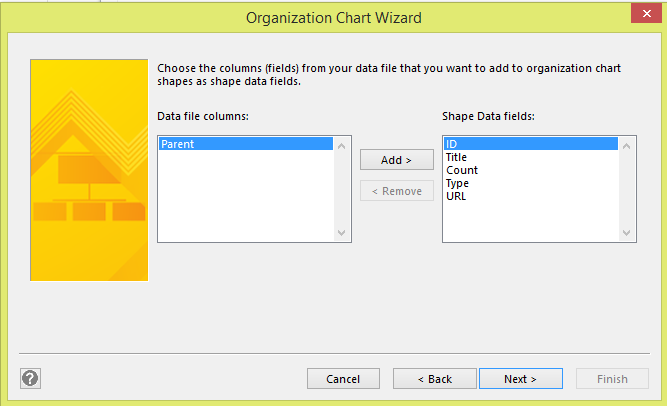
These display fields are good to get setup the first time. I don't use the Parent or ID fields in my display because they are just GUIDs. I order the displayed fields to show Title, Count, Type, and finally URL:
这些显示字段非常适合首次设置。 我不在显示中使用“父代”或“ ID”字段,因为它们只是GUID。 我对显示的字段进行排序,以显示标题,计数,类型,最后显示URL:
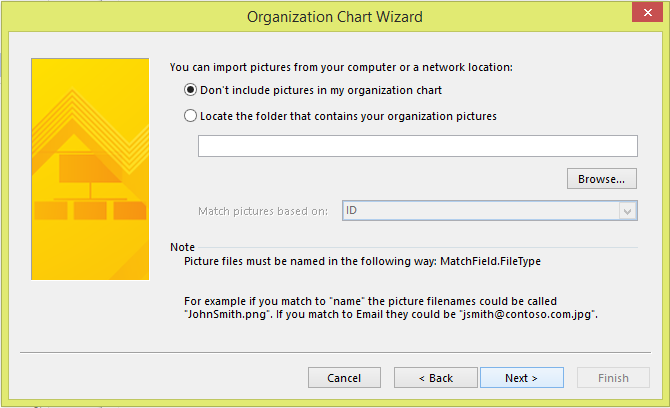
You probably don't have nor want to include pictures of each site in the chart and actually, we'll be hiding the picture field once this is done.
您可能既没有也不想在图表中包含每个站点的图片,实际上,一旦完成,我们将隐藏“图片”字段。
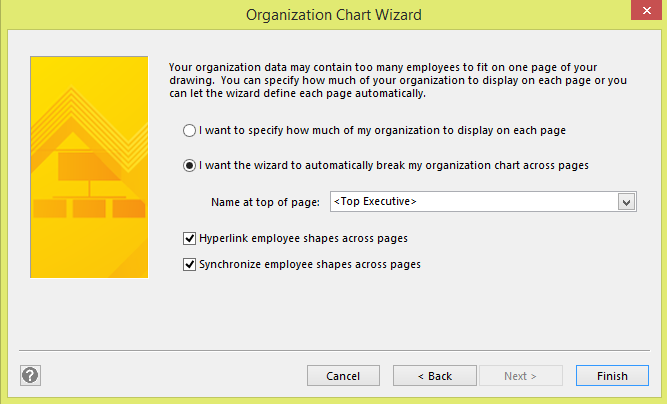
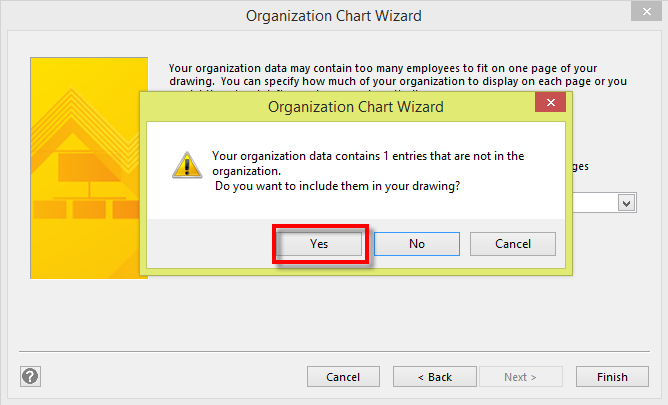
I generally choose the second option because Visio will build separate sitemaps for different subsites. However, if you want to have the entire sitemap built on one sheet for you to split if necessary, select the first option.
我通常选择第二个选项,因为Visio将为不同的子站点构建单独的站点地图。 但是,如果您希望将整个站点地图构建在一张纸上,以便在必要时进行拆分,请选择第一个选项。
Visio will now build the sitemap.
Visio现在将构建站点地图。
To remove the empty picture object and gain more real estate for the text, select all the shapes (ctrl+a), right click on one of the shapes and select, "Picture" --> "Hide Picture" or "Delete Picture"
要删除空白图片对象并为文本获取更多空间,请选择所有形状(ctrl + a),右键单击其中一个形状,然后选择“图片”->“隐藏图片”或“删除图片”
There you go! A beautiful site map of your SharePoint environment.
你去! 您的SharePoint环境的精美站点地图。
visio2003_sp3


 4287
4287

 被折叠的 条评论
为什么被折叠?
被折叠的 条评论
为什么被折叠?
 到【灌水乐园】发言


