


 本文详述了如何利用Microsoft Reporting Services创建报告,包括设置数据源、使用表达式编辑器、添加图表、处理参数、嵌入图像以及自定义ReportViewer控件。通过示例展示了如何创建子报表和应用格式,帮助开发者实现专业级别的报表设计。
Microsoft Reports are based on a report definition, which is an XML file that describes data and layout for the report, with a different extension. You can create a client-side report definition language (*.rdlc) file with Visual Studio, and build great reports for your applications. Reports may contain tabular, aggregated, and multidimensional data, plus they can include charts, and can be used in WinForm or ASP.NET.
Microsoft报表基于报表定义,该定义是一个XML文件,用于描述报表的数据和布局,并具有不同的扩展名。 您可以使用Visual Studio创建客户端报告定义语言(* .rdlc)文件,并为您的应用程序构建出色的报告。 报表可能包含表格数据,聚合数据和多维数据,此外还可以包含图表,并且可以在WinForm或ASP.NET中使用。
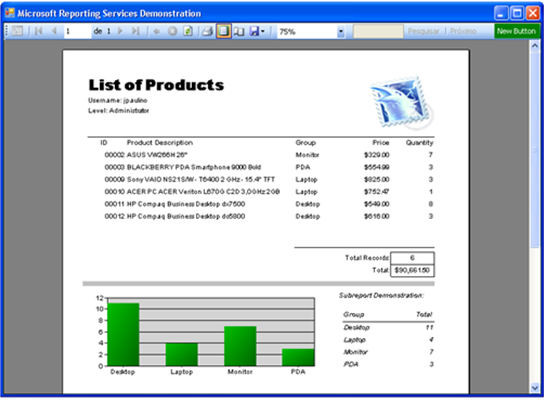
The purpose of this “How To” article is to show the basic steps of creating a report, define the data source at runtime, work with parameters, include images, use the expression editor, and how to feed data to a sub report and chart. Finally it will also demonstrate some easy ways for you to customize the ReportViewer control.
本文的目的是展示创建报表,在运行时定义数据源,使用参数,包含图像,使用表达式编辑器以及如何将数据馈送到子报表和图表的基本步骤。 。 最后,它还将演示一些简单的方法来帮助您自定义ReportViewer控件。
介绍 (Introduction)
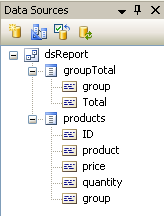
首先,我为该示例创建了一个简单SQL表,其中包含一些数据。 它是PDA,台式机等电子设备的列表。从该表中,您需要使用两个不同的DataTable创建一个DataSet。 只需将其命名为“ dsReport.xsd”即可。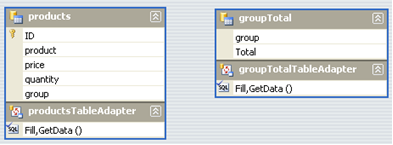
The first DataTable, “products”, contains a list of all of the products in the table. Then the second one, “groupTotal”, is an aggregated (Group By) query with the groups and the sum of quantities that will be used in a sub report, and in a chart.
第一个数据表“产品”包含表中所有产品的列表。 然后,第二个“ groupTotal”是一个聚合(分组依据)查询,其中包含将在子报表和图表中使用的组和数量的总和。
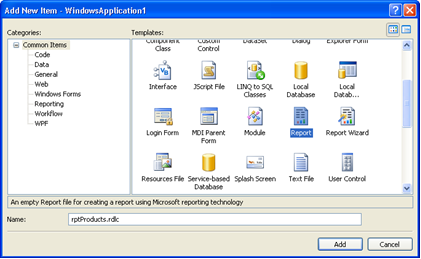
After this, you need to add a report to your application. Just select it and give it an appropriate name. For this example, I have chosen "rptProducts".
之后,您需要向应用程序中添加报告。 只需选择它并给它一个适当的名称即可。 对于此示例,我选择了“ rptProducts”。
With the report created and opened, you have a new menu in the menu bar called “Report”. Select the Page Header and Page Footer to show these sections in the report. After this, just drag a Table from the toolbox into the body section of the report.
创建并打开报告后,菜单栏中将出现一个名为“报告”的新菜单。 选择页面页眉和页面页脚以在报告中显示这些部分。 之后,只需将表格从工具箱中拖到报表的正文部分即可。
数据源 (DataSource)
现在是时候定义数据源了。 从“报告”菜单中,选择“数据源”。 它将打开一个窗口,您可以在其中选择应用程序中可用的数据源。 选择创建的数据集。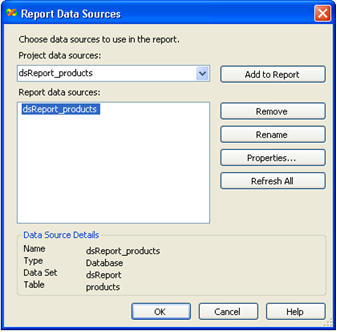
After you define the data source for your report, you will see the available DataTables in the Data Sources explorer (normally available in the Solution Explorer window). Now, from the "Products" table, drag the columns to the Table object that has already been added to the body section.
为报表定义数据源后,您将在“数据源”资源管理器中看到可用的数据表(通常在“解决方案资源管理器”窗口中可用)。 现在,从“产品”表中,将列拖动到已经添加到主体部分的Table对象中。
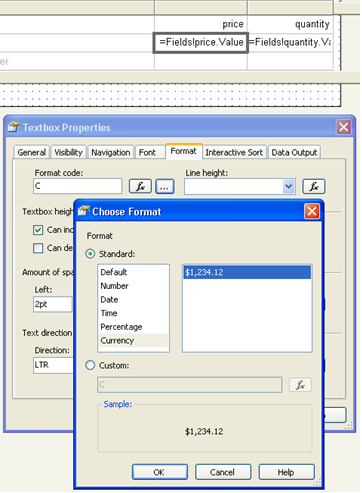
The Table object works like an Excel Spreadsheet. You can merge cells, format cells, change the backgroundcolor, etc. This example uses a currency field. To show you how easy it is to format the cells, right-click in the field cell and select Properties. In the Properties window, go to the Format tab and define the Currency format for that cell.
Table对象的工作方式类似于Excel电子表格。 您可以合并单元格,设置单元格格式,更改背景色等。本示例使用货币字段。 要显示格式化单元格的简便性,请右键单击字段单元格,然后选择“属性”。 在“属性”窗口中,转到“格式”选项卡,然后为该单元格定义“货币”格式。
You can change the format for the other fields as well, like bold, colours, titles, etc., to obtain a professional look.
您也可以更改其他字段的格式,例如粗体,颜色,标题等,以获得专业的外观。
图片 (Images)
要将图像包含在您的应用程序中,您可以将它们嵌入,然后将它们用作徽标(例如)。 如果它们以二进制数据存储,您也可以从数据库中获取。To embed the images in your report, you just need to go to menu Report and select Embedded Images. In the new window, select the New Image button and browse to your image.
要将图像嵌入到报告中,您只需要转到菜单Report并选择Embedded Images。 在新窗口中,选择“新建图像”按钮并浏览到您的图像。
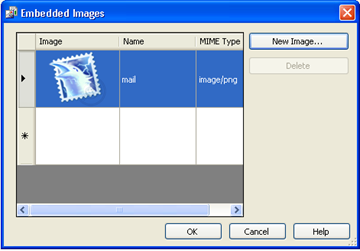
Close the window. Then, from the toolbox, add an Image control to the report. In the Image properties, select the image name from the combo box, available in the Value property.
关闭视窗。 然后,从工具箱中,将Image控件添加到报表中。 在“图像”属性中,从“值”属性中可用的组合框中选择图像名称。
表达式编辑器 (Expression Editor)
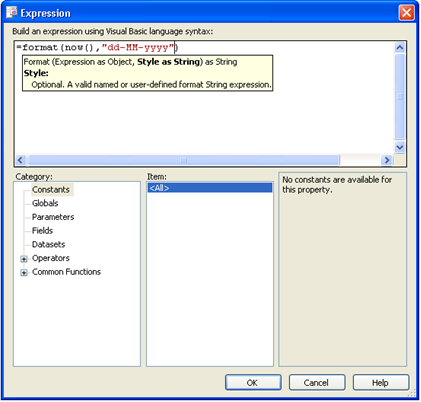
当您需要创建一些公式时,可用的intellisense是Visual Studio 2008 Microsoft Reporting Services表达式编辑器的一项不错的功能。In the Footer section, you can add two Textboxes. In one of them, you can include the page number and the total pages. For that, you already have some built-in formulas in the Global category.
在页脚部分,您可以添加两个文本框。 在其中之一中,您可以包括页码和总页数。 为此,“全局”类别中已经有一些内置公式。
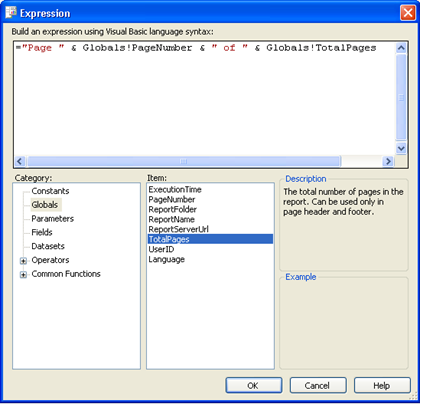
As you can see in the following image, you can use VB formulas (most of them) in the Expression Editor. Intellisense helps a lot to prevent errors and remember formula syntax.
如下图所示,可以在表达式编辑器中使用VB公式(大多数)。 Intellisense有助于防止错误并记住公式语法。
参量 (Parameters)
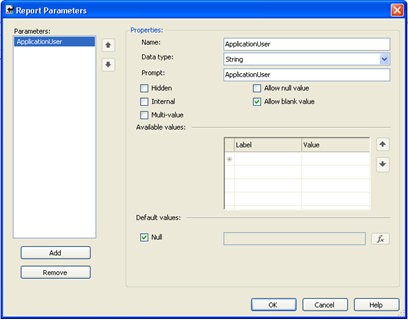
您可以将参数用于许多不同的事物。 对于此示例,我将仅用于将信息从应用程序传递到报表。In the Report menu, select Report Parameters. Define two parameters: “ApplicationUser” and “ApplicationLevel” of type String.
在“报告”菜单中,选择“报告参数”。 定义两个参数:String类型的“ ApplicationUser”和“ ApplicationLevel”。
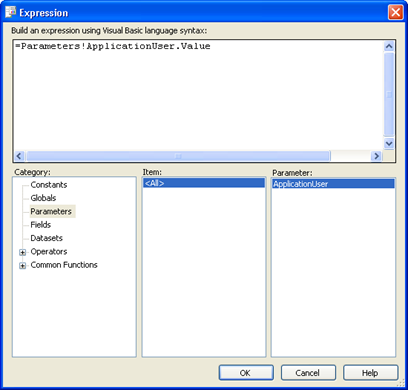
Then, in the report, you can use the Expression Editor to define the parameters (they will be defined in the code) for the Textboxes. They will be available in the parameters category.
然后,在报告中,可以使用“表达式编辑器”为文本框定义参数(它们将在代码中定义)。 它们将在参数类别中可用。
图表 (Chart)
您可以在报告中使用很多图表,这些图表非常易于定制和提供数据。 从工具箱中的图表控件添加到报表的正文部分。 双击它,它将显示“数据字段”和“类别字段”区域。 从数据源浏览器中拖动“组”和“总计”字段。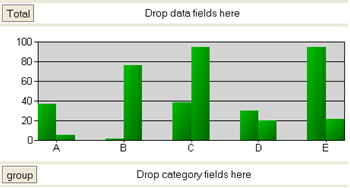
You can also do this in the Chart Properties window in the Data Tab. In this window, you can customize the series colours, legend, 3D effects, filter, axis, etc.
您也可以在“数据”选项卡的“图表属性”窗口中执行此操作。 在此窗口中,您可以自定义系列颜色,图例,3D效果,滤镜,轴等。
使用代码 (Using the Code)
在前面的步骤中,您已经在报告中使用了多个数据源。 现在,您将添加新的数据源,无论是否经过过滤,这就是您将看到的数据。Imports System.Data.SqlClient
Imports Microsoft.Reporting.WinForms
Public Class Form1
' Connection string definition
Private connString As String = _
"Data Source=.\SQLEXPRESS;AttachDbFilename='|DataDirectory|\myDatabase.mdf';_
Integrated Security=True;User Instance=True"
''' <summary>
''' Form load event
''' </summary>
Private Sub Form1_Load(ByVal sender As Object, _
ByVal e As System.EventArgs) Handles Me.Load
Try
' Call the customization method
Call customizeReportViewer(Me.ReportViewer1)
' Add a button to the ReportViewer
Call AddReportViewerButton()
With Me.ReportViewer1.LocalReport
' Report path
.ReportPath = Application.StartupPath & "\..\..\rptProducts.rdlc"
.DataSources.Clear()
' Set the parameters
Dim parameters(1) As ReportParameter
parameters(0) = New ReportParameter("ApplicationUser", "jpaulino")
parameters(1) = New ReportParameter("ApplicationLevel", "Administrator")
.SetParameters(parameters)
End With
' ----------------------------------------------------
' Datasource for the main report (where price > 200)
' ----------------------------------------------------
Dim SQL As String = "SELECT * FROM products WHERE price > @price"
Using da As New SqlDataAdapter(SQL, connString)
da.SelectCommand.Parameters.Add("@price", SqlDbType.Int).Value = 200
Using ds As New DataSet
da.Fill(ds, "products")
' You must use the same name as defined in the report
' Data Source Definition
Dim rptDataSource As New ReportDataSource_
("dsReport_products", ds.Tables("products"))
Me.ReportViewer1.LocalReport.DataSources.Add(rptDataSource)
End Using
End Using
' ----------------------------------------------------
' Datasource for the Chart
' ----------------------------------------------------
Dim SQL_Chart As String = "SELECT [group], SUM(quantity) AS _
Total FROM products GROUP BY [group]"
Using da As New SqlDataAdapter(SQL_Chart, connString)
Using ds As New DataSet
da.Fill(ds, "groupTotal")
Dim rptDataSource As New ReportDataSource("dsReport_groupTotal", _
ds.Tables("groupTotal"))
Me.ReportViewer1.LocalReport.DataSources.Add(rptDataSource)
End Using
End Using
' Refresh the report
ReportViewer1.RefreshReport()
Catch ex As Exception
MessageBox.Show(ex.Message, My.Application.Info.Title, _
MessageBoxButtons.OK, MessageBoxIcon.Error)
End Try
End Sub
子报表 (SubReports)
您可以在报表中使用一个或多个子报表。 为此,您需要为每个数据库填充数据源。 由于无法直接访问子报表的数据源,因此必须为SubreportProcessing定义一个处理程序,然后在加载子报表时,可以从数据库中检索数据并设置其数据源。It may look hard, but it’s easy to accomplish!
它可能看起来很难,但是很容易实现!
Define the data source for the subreport and use a Table object, like in the main report. Add the fields to the Table object. In the main report, add a subreport object from the toolbox, and choose the Report Name property, to name the subreport name.
定义子报表的数据源,并使用Table对象,就像在主报表中一样。 将字段添加到Table对象。 在主报表中,从工具箱中添加一个子报表对象,然后选择“报表名称”属性,以命名该子报表名称。
Then in the form load event of the main report, add a handler for the SubreportProcessing.
然后,在主报表的表单加载事件中,为SubreportProcessing添加一个处理程序。
AddHandler ReportViewer1.LocalReport.SubreportProcessing, _
				AddressOf SubreportProcessingEvent
Finally, in the SubreportProcessingEvent, you just define the new datasource the same way.
最后,在SubreportProcessingEvent中,只需以相同的方式定义新的数据源。
    '''  <summary>
    ''' When the subreport is being processed/loaded, fills the datasource
    '''  </summary>
    Sub SubreportProcessingEvent(ByVal sender As Object, _
			ByVal e As SubreportProcessingEventArgs)

        Try

            Dim SQL As String = "SELECT [group], SUM(quantity) AS _
				Total FROM products GROUP BY [group]"
            Using da As New SqlDataAdapter(SQL, connString)
                Using ds As New DataSet
                    da.Fill(ds, "groupTotal")
                    Dim rptDataSource As New ReportDataSource_
			("dsReport_groupTotal", ds.Tables("groupTotal"))
                    e.DataSources.Add(rptDataSource)
                End Using
            End Using

        Catch ex As Exception
            MessageBox.Show(ex.Message, My.Application.Info.Title, _
			MessageBoxButtons.OK, MessageBoxIcon.Error)
        End Try

    End Sub
ReportViewer自定义 (ReportViewer Customization)
ReportViewer是一个控件,用于在您的表单或网页中显示Microsoft报告。 您可以自定义大多数控件,以根据需要进行改进和自定义。In this article, I will show two easy ways to customize it.
在本文中,我将展示两种简单的自定义方法。
First, you can change the captions in the controls. You can also do other things like disable items, rename tooltips, etc. This is especially nice if you need to change the language of the control, since you only have English available.
首先,您可以在控件中更改标题。 您还可以执行其他操作,例如禁用项目,重命名工具提示等。如果您需要更改控件的语言,这特别好,因为您只能使用英语。
For this, I have created this recursive sub that will loop through all of the controls in the ReportViewer and make some changes.
为此,我创建了此递归子控件,该子控件将遍历ReportViewer中的所有控件并进行一些更改。
    '''  <summary>
    ''' Loops through all of ReportViewer controls and customize them
    '''  </summary>
    '''  <remarks></remarks>
    Sub customizeReportViewer(ByVal ctrl As Control)

        For Each c As Control In ctrl.Controls

            ' ----------------------------------------------------
            ' Check the text of the available labels
            ' ----------------------------------------------------
            If TypeOf c Is Label Then
                Dim lbl As Label = DirectCast(c, Label)
                Select Case lbl.Name
                    Case "LblGeneratingReport"
                        lbl.Text = "My report is loading now ... "
                    Case Else
                        ' You can add more customizations
                End Select
            End If

            ' ----------------------------------------------------
            ' Change the text in the ToolStrip to Portuguese
            ' ----------------------------------------------------
            If TypeOf c Is ToolStrip Then
                Dim ts As ToolStrip = DirectCast(c, ToolStrip)
                For Each item As ToolStripItem In ts.Items

                    Select Case item.Text
                        Case "Find"
                            item.Text = "Pesquisar"
                        Case "Next"
                            item.Text = "Próximo"
                        Case "of"
                            item.Text = "de"
                        Case Else
                            ' You can add more customizations
                    End Select
                Next
            End If

            ' If the control has child controls
            If c.HasChildren Then
                customizeReportViewer(c)
            End If

        Next

    End Sub
Finally, you just have to call it from the form load event, where you have the ReportViewer.
最后,您只需要从具有ReportViewer的表单加载事件中调用它即可。
        ' Call the customization method
        Call customizeReportViewer(Me.ReportViewer1)
The second customization shows how to include a new button in the ToolStrip. It will find the main toolstrip and add a new button on the right side.
第二项自定义显示了如何在ToolStrip中包含新按钮。 它将找到主要工具条,并在右侧添加一个新按钮。
    '''  <summary>
    ''' Find the main ToolStrip and add a new button on the right side
    '''  </summary>
    Sub AddReportViewerButton()

        Dim ts() As Control = Me.ReportViewer1.Controls.Find("toolStrip1", True)
        If ts IsNot Nothing Then
            Dim tsItem As ToolStrip = DirectCast(ts(0), ToolStrip)
            Dim item As New ToolStripButton
            item.Name = "newButton"
            item.Text = "New Button"
            item.BackColor = Color.Green
            item.ForeColor = Color.White
            item.Alignment = ToolStripItemAlignment.Right

            tsItem.Items.Add(item)

            AddHandler item.Click, AddressOf newButtonClick
        End If

    End Sub
When the button is pressed:
当按下按钮时:
    '''  <summary>
    ''' Shows a messagebox when the new button of
    ''' the Reportviewer is pressed
    '''  </summary>
    Sub newButtonClick()
        MessageBox.Show("This is my new button!")
    End Sub
结论 (Conclusion)
本文介绍了使用Microsoft Reports的第一步和最重要的步骤,以及如何处理一些代码。 我希望这可以帮助您开始使用它,并帮助您了解与他们合作的难易程度。I hope it's helpful to you!
希望对您有帮助!


 4994
4994

 被折叠的 条评论
为什么被折叠?
被折叠的 条评论
为什么被折叠?
 到【灌水乐园】发言


