


chrome 开发工具
An introduction to Chrome Dev (and QA) Tools
Chrome开发(和质量检查)工具简介
Have you ever been asked to investigate memory or cpu usage of your company’s web app? Have you ever been asked to investigate where your company’s web app is spending time during its loading? Google’s chrome browser comes with a rich set of tools that can be used to investigate memory usage, CPU usage, object load times, network traffic and more. This article gives a quick rundown of some of what’s available through Google’s DevTools.
您是否曾经被要求调查公司网络应用程序的内存或CPU使用率? 您是否曾经被要求调查贵公司的Web应用程序在加载过程中花费的时间? Google的chrome浏览器随附了丰富的工具集,可用于调查内存使用情况,CPU使用情况,对象加载时间,网络流量等。 本文简要介绍了Google的DevTools提供的一些功能 。
The suite of tools are referred to a ‘DevTools’ but, of course, anyone can make use of them, including QA folks. Chrome version 38.0 is used for this article. Since there are different versions of the tools your tools may look different.
这套工具被称为“ DevTools”,但是,当然,任何人都可以使用它们,包括质量检查人员。 本文使用Chrome版本38.0。 由于工具的版本不同,因此您的工具可能看起来有所不同。
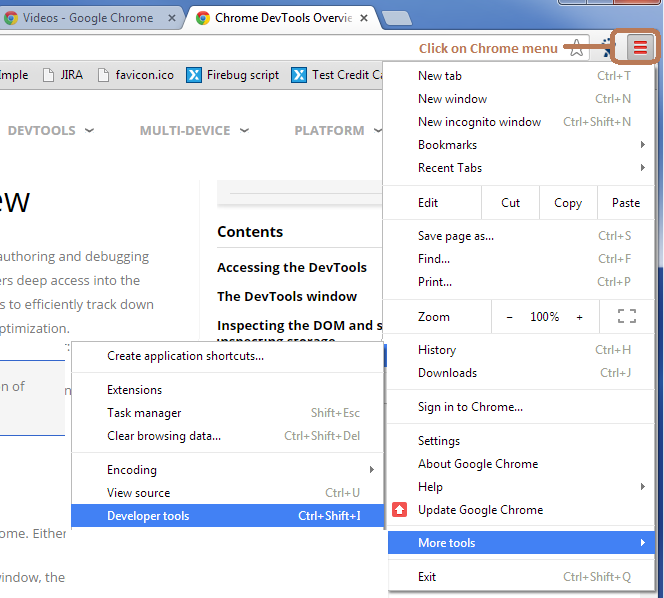
To get started, click on the Chrome menu. In the drop down, look for ‘More Tools’ or something with a similar name. From that drop down, click on ‘Developer Tools’. You can also use a three keystroke group of shift-control-I (capital i) (Cmd-Opt-I for Mac) to launch the tools.
首先,请点击Chrome菜单。 在下拉菜单中,查找“更多工具”或名称相似的名称。 在下拉菜单中,点击“开发者工具”。 您还可以使用shift-control-i(大写i)(Mac的Cmd-Opt-I)的三个按键组来启动工具。
When the tools launch, you’ll see the different options across the tools banner. The Chrome DevTools Overview does a good job of introducing the set of tools.
工具启动后,您会在工具横幅上看到不同的选项。 Chrome DevTools概述很好地介绍了这套工具。
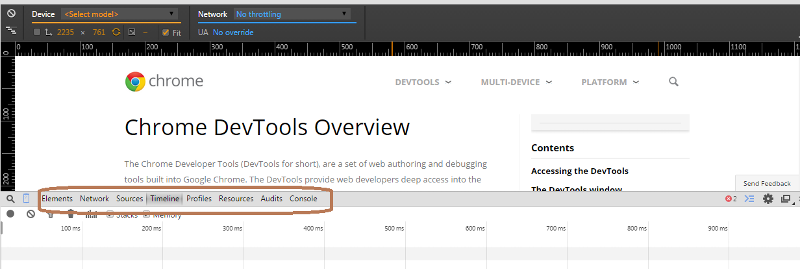
- Elements: As the name implies, with this tab selected you can see the DOM tree elements. Additonally, you can drill down into the structure of the tree and you can edit elements. The Editing Styles and The Dom page gives more details. 元素 :顾名思义,选择此选项卡后,您可以看到DOM树元素。 此外,您可以深入研究树的结构,还可以编辑元素。 “ 编辑样式”和“ Dom”页面提供了更多详细信息。
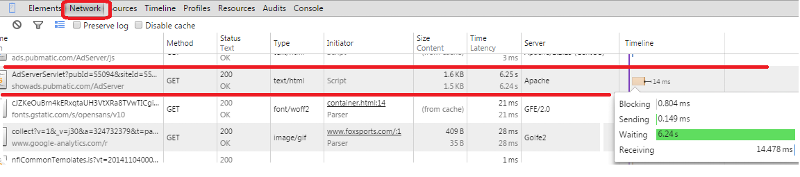
- Network: Using the Network option, you can see network traffic, including how long it took to load page objects. 网络 :使用“网络”选项,您可以查看网络流量,包括加载页面对象所花费的时间。
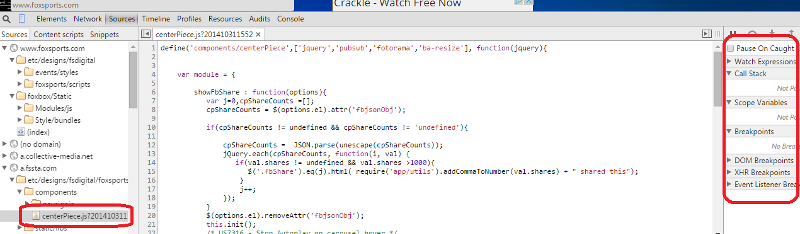
- Sources: This not only shows you source, but it lets you set break points, pause on caught exceptions, view the stack and more. 源 :这不仅显示源,还允许您设置断点,暂停捕获的异常,查看堆栈等。
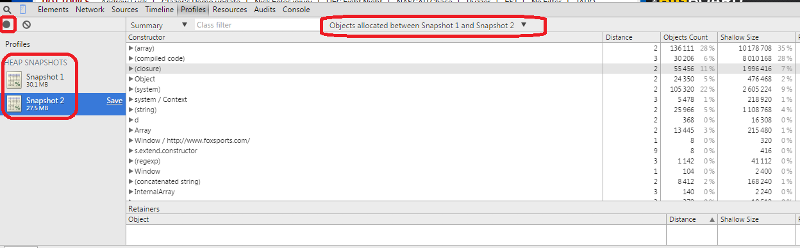
- Profiles: This is where you can go to get information on memory usage. You can take snapshots of heap memory usage and then compare differences between them. This is a very handy way to see if your page is leaking memory. You can also collect CPU usage stats for javascript code and you profile heap memory allocation over time. 配置文件 :您可以在这里获取有关内存使用情况的信息。 您可以拍摄堆内存使用情况的快照,然后比较它们之间的差异。 这是查看页面是否正在泄漏内存的一种非常方便的方法。 您还可以收集JavaScript代码的CPU使用情况统计信息,并分析随时间推移的堆内存分配。
References:
参考文献:
- Chrome DevTools Overview should be your starting point for diving in deeper into any of the tools that you are curious about. Chrome DevTools概述应该是您深入了解您所好奇的任何工具的起点。
- Videos – Google Chrome are a set of short videos that give quick intros. At the bottom of the page are a couple recordings of chrome meetings. 视频– Google Chrome浏览器是一组简短的视频,可以快速介绍自己。 页面底部是chrome会议的一些录音。
- Taming the Unicorn is a nice look at javascript profiling with chrome devtools 驯服Unicorn可以很好地利用chrome devtools对javascript进行分析
翻译自: https://www.experts-exchange.com/articles/17307/An-introduction-to-Chrome-Dev-and-QA-Tools.html
chrome 开发工具


 被折叠的 条评论
为什么被折叠?
被折叠的 条评论
为什么被折叠?
 到【灌水乐园】发言


