


 本文介绍了如何在Linux环境中使用gdb调试器进行C程序的调试。首先,讲解了如何安装gdb,包括在Ubuntu、Debian、Mint和Kali以及CentOS、RHEL、Fedora上的安装方法。接着,通过一个简单的阶乘计算代码示例,演示了如何编译带有调试信息的应用,并使用gdb启动和设置断点。此外,还提到了如何检查崩溃、查看寄存器值和使用步进命令进行调试。

linux中gdb调试命令
gdb is the short form of GNU Debugger. A debugger is a tool used to search and find and get detailed information about bugs in application binaries. gdb is popular in the Linux community which is used by most of the IDE, Programming tools event in Android IDE’s. In this tutorial, we will look at how to start and use the basic features of gdb .
gdb是GNU调试器的缩写。 调试器是一种工具,用于搜索和查找并获取有关应用程序二进制文件中的错误的详细信息。 gdb在Linux社区中很流行,大多数IDE在Android IDE的“编程工具”事件中使用。 在本教程中,我们将研究如何启动和使用gdb的基本功能。
范例程式码 (Example Code)
During this tutorial, we will use the following simple application code which is written in C Programming language. This code just calculates factorial.
在本教程中,我们将使用以下用C编程语言编写的简单应用程序代码。 此代码仅计算阶乘。
#include <stdio.h>

int main(void) {
 int fact = 1;
 int number=5;

 for (int j = 1; j <= number; j++) {
   fact = fact * j;
   printf("%d\n",fact);
 }

}
为Ubuntu,Debian,Mint,Kali安装gdb (Install gdb For Ubuntu, Debian, Mint, Kali)
We can install gdb for Ubuntu, Debian, Mint and Kali with the following lines.
我们可以使用以下几行为Ubuntu,Debian,Mint和Kali安装gdb 。
$ sudo apt install gdb为CentOS,RHEL,Fedora安装gdb (Install gdb For CentOS, RHEL, Fedora)
Installation for gdb in RPM based distros like CentOS, RHEL and Fedora
在基于RPM的发行版(如CentOS,RHEL和Fedora)中安装gdb
$ sudo yum install gdb编译应用 (Compile Application)
We will start by compiling our example application. We will use GCC or GNU Compiler Collection which is a defacto compiler for the Linux environment. gcc can be installed with the following line if not installed.
我们将从编译示例应用程序开始。 我们将使用GCC或GNU编译器集合,它是Linux环境的事实上的编译器。 如果未安装,则gcc可以通过以下行安装。
$ sudo apt install gccNow we will compile our application just providing the source code file name which is poftut.c in this case.
现在,我们将仅提供源代码文件名(在这种情况下为poftut.c来编译我们的应用程序。
$ gcc poftut.c -o poftut使用调试信息编译应用程序 (Compile Application with Debug Info)
We can debug all ready compiled applications but there is some useful option that can be used to provide more information about the application while debugging. We can enable debugging information which can be used to match debugging code with source code and provides more detailed information. We can use -g option while compiling with gcc like below.
我们可以调试所有准备好的已编译应用程序,但是有一些有用的选项可用于在调试时提供有关该应用程序的更多信息。 我们可以启用调试信息,该信息可用于将调试代码与源代码进行匹配,并提供更详细的信息。 我们可以在使用gcc编译时使用-g选项,如下所示。
$ gcc -g poftut.c -o poftut
通过运行可执行文件进行安装调试(Setup Debugging By Running Executable)
We can start applications for debugging with different methods but the most basic and practical way is starting with the application name. We will start poftut app like below.
我们可以使用不同的方法启动用于调试的应用程序,但是最基本和最实用的方法是从应用程序名称开始。 我们将如下所示启动poftut应用程序。
$ gdb poftut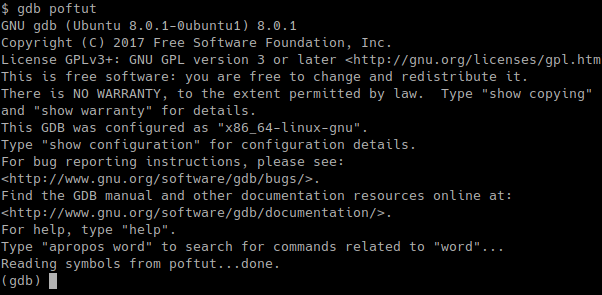
We can see gdb interactive shell is started after loading app and related debugging information.
我们可以看到gdb交互式外壳程序在加载应用程序和相关调试信息后启动。
开始调试 (Start Debugging)
We can start debugging the given application by using run command. But keep in mind that this will start process run which will end in this case without a problem. While running the standard output will be put to the screen. and the last thing is exit status which is normal in this case.
我们可以使用run命令开始调试给定的应用程序。 但是请记住,这将启动过程运行,在这种情况下将毫无问题地结束。 运行时,标准输出将显示在屏幕上。 最后一件事是exit status ,在这种情况下是正常的。
run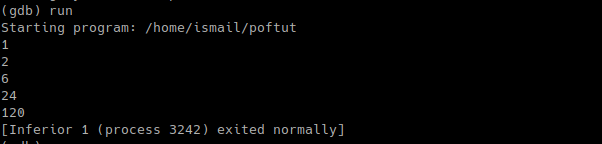
检查崩溃(Inspect Crashes)
One of the use case for gbd is inspecting crashes to find the cause. The application can be exited by crashing and in this case crash information is get by gdb . We can list crash information with backtrace command like below.
gbd的用例之一是检查崩溃以查找原因。 崩溃可以退出该应用程序,在这种情况下,崩溃信息可以通过gdb获取。 我们可以使用如下所示的backtrace命令列出崩溃信息。
backtrace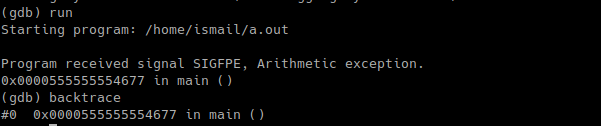
断点(Breakpoints)
In big applications, we generally need to inspect the flow of the application. While inspecting we need to look specific situation which is important for us. We can set breakpoints that will stop the execution of the application. We can check the current register and memory values easily. In this example, we set a break for the line printf.
在大型应用程序中,我们通常需要检查应用程序的流程。 在检查时,我们需要查看对我们很重要的特定情况。 我们可以设置断点来停止应用程序的执行。 我们可以轻松地检查当前的寄存器和内存值。 在此示例中,我们为行printf设置了一个中断。
break printfand we run
然后我们跑
run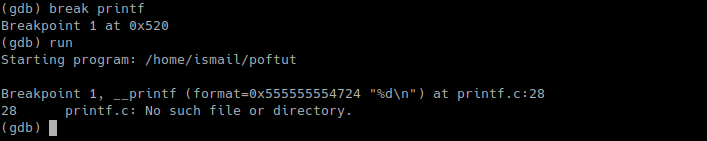
列出断点(List Breakpoints)
We can list existing breakpoints and their hit count with the info break command like below.
我们可以使用info break命令列出现有的断点及其命中数,如下所示。
info break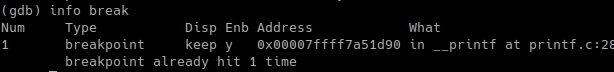
列出寄存器值(List Register Values)
We can list current register values with info registers command like below. Keep in mind that register values are very volatile and changes in each step in general.
我们可以使用如下info registers命令列出当前寄存器的值。 请记住,寄存器值非常不稳定,通常每个步骤都会变化。
info registers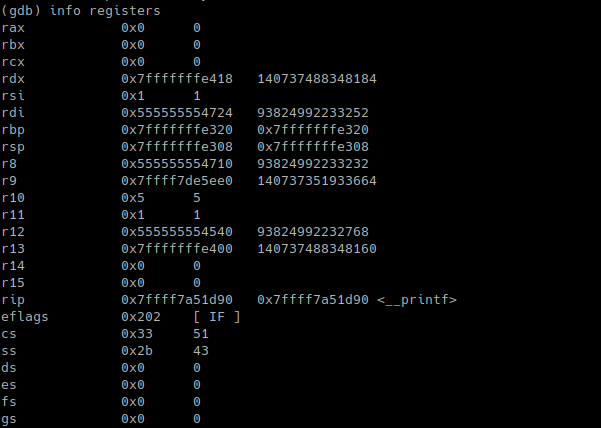
踏步(Stepping)
During debugging we generally want to go one step further which will change current memory and register values. We can use step command for this.
在调试期间,我们通常希望更进一步,这将更改当前的存储器和寄存器值。 我们可以为此使用step命令。
step
We can also spefiy the step count which is 3 in this case.
在这种情况下,我们还可以指定为3的步数。
step 3
翻译自: https://www.poftut.com/debug-applications-with-gdb-in-linux/
linux中gdb调试命令


 1785
1785

 被折叠的 条评论
为什么被折叠?
被折叠的 条评论
为什么被折叠?
 到【灌水乐园】发言


