


0x (推荐)
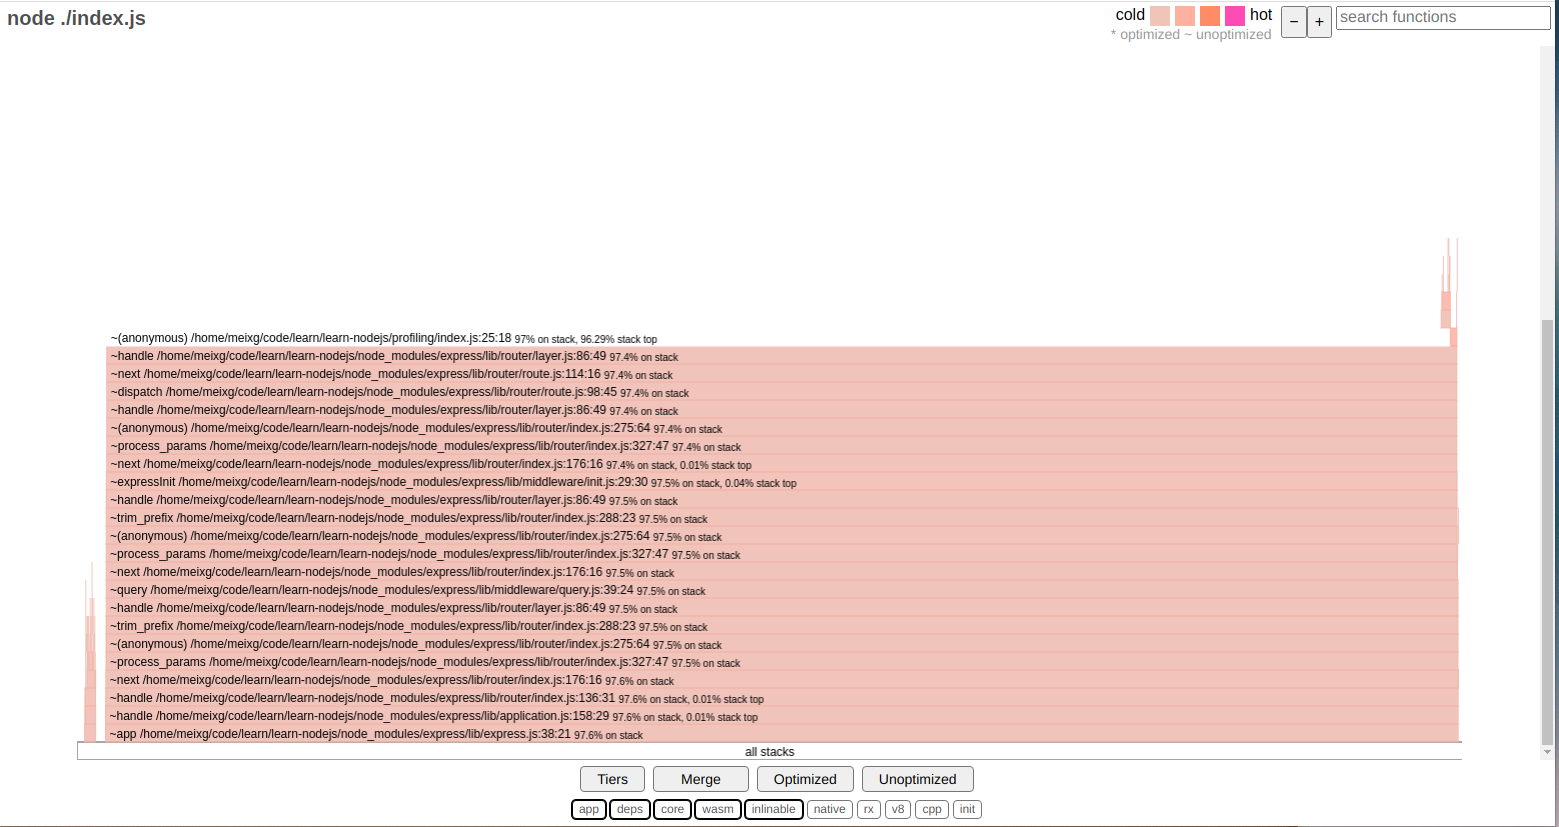
    通过封装了 --prof 对 v8 的产出做了处理,生成直接可用的火焰图。
    也可以直接生成cpuprofile
如下图:
node自带的命令
node --cpu-prof app.js
    该命令会直接生成一个.cpuprofile  可以在浏览器查看
    还有其他命令可以参考: [NODE_OPTIONS=options... | Node.js API 文档](http://nodejs.cn/api/cli/node_options_options.html)
查看应用的内存情况
const { writeHeapSnapshot } = require('node:v8');
const {
  Worker,
  isMainThread,
  parentPort
} = require('node:worker_threads');

if (isMainThread) {
  const worker = new Worker(__filename);

  worker.once('message', (filename) => {
    console.log(`worker heapdump: ${filename}`);
    // Now get a heapdump for the main thread.
    console.log(`main thread heapdump: ${writeHeapSnapshot()}`);
  });

  // Tell the worker to create a heapdump.
  worker.postMessage('heapdump');
} else {
  parentPort.once('message', (message) => {
    if (message === 'heapdump') {
      // Generate a heapdump for the worker
      // and return the filename to the parent.
      parentPort.postMessage(writeHeapSnapshot());
    }
  });
}
生成一个.heapsnapshot文件,可以在浏览器中直接打开
如何在浏览器中打开xxx.cpuprofile文件
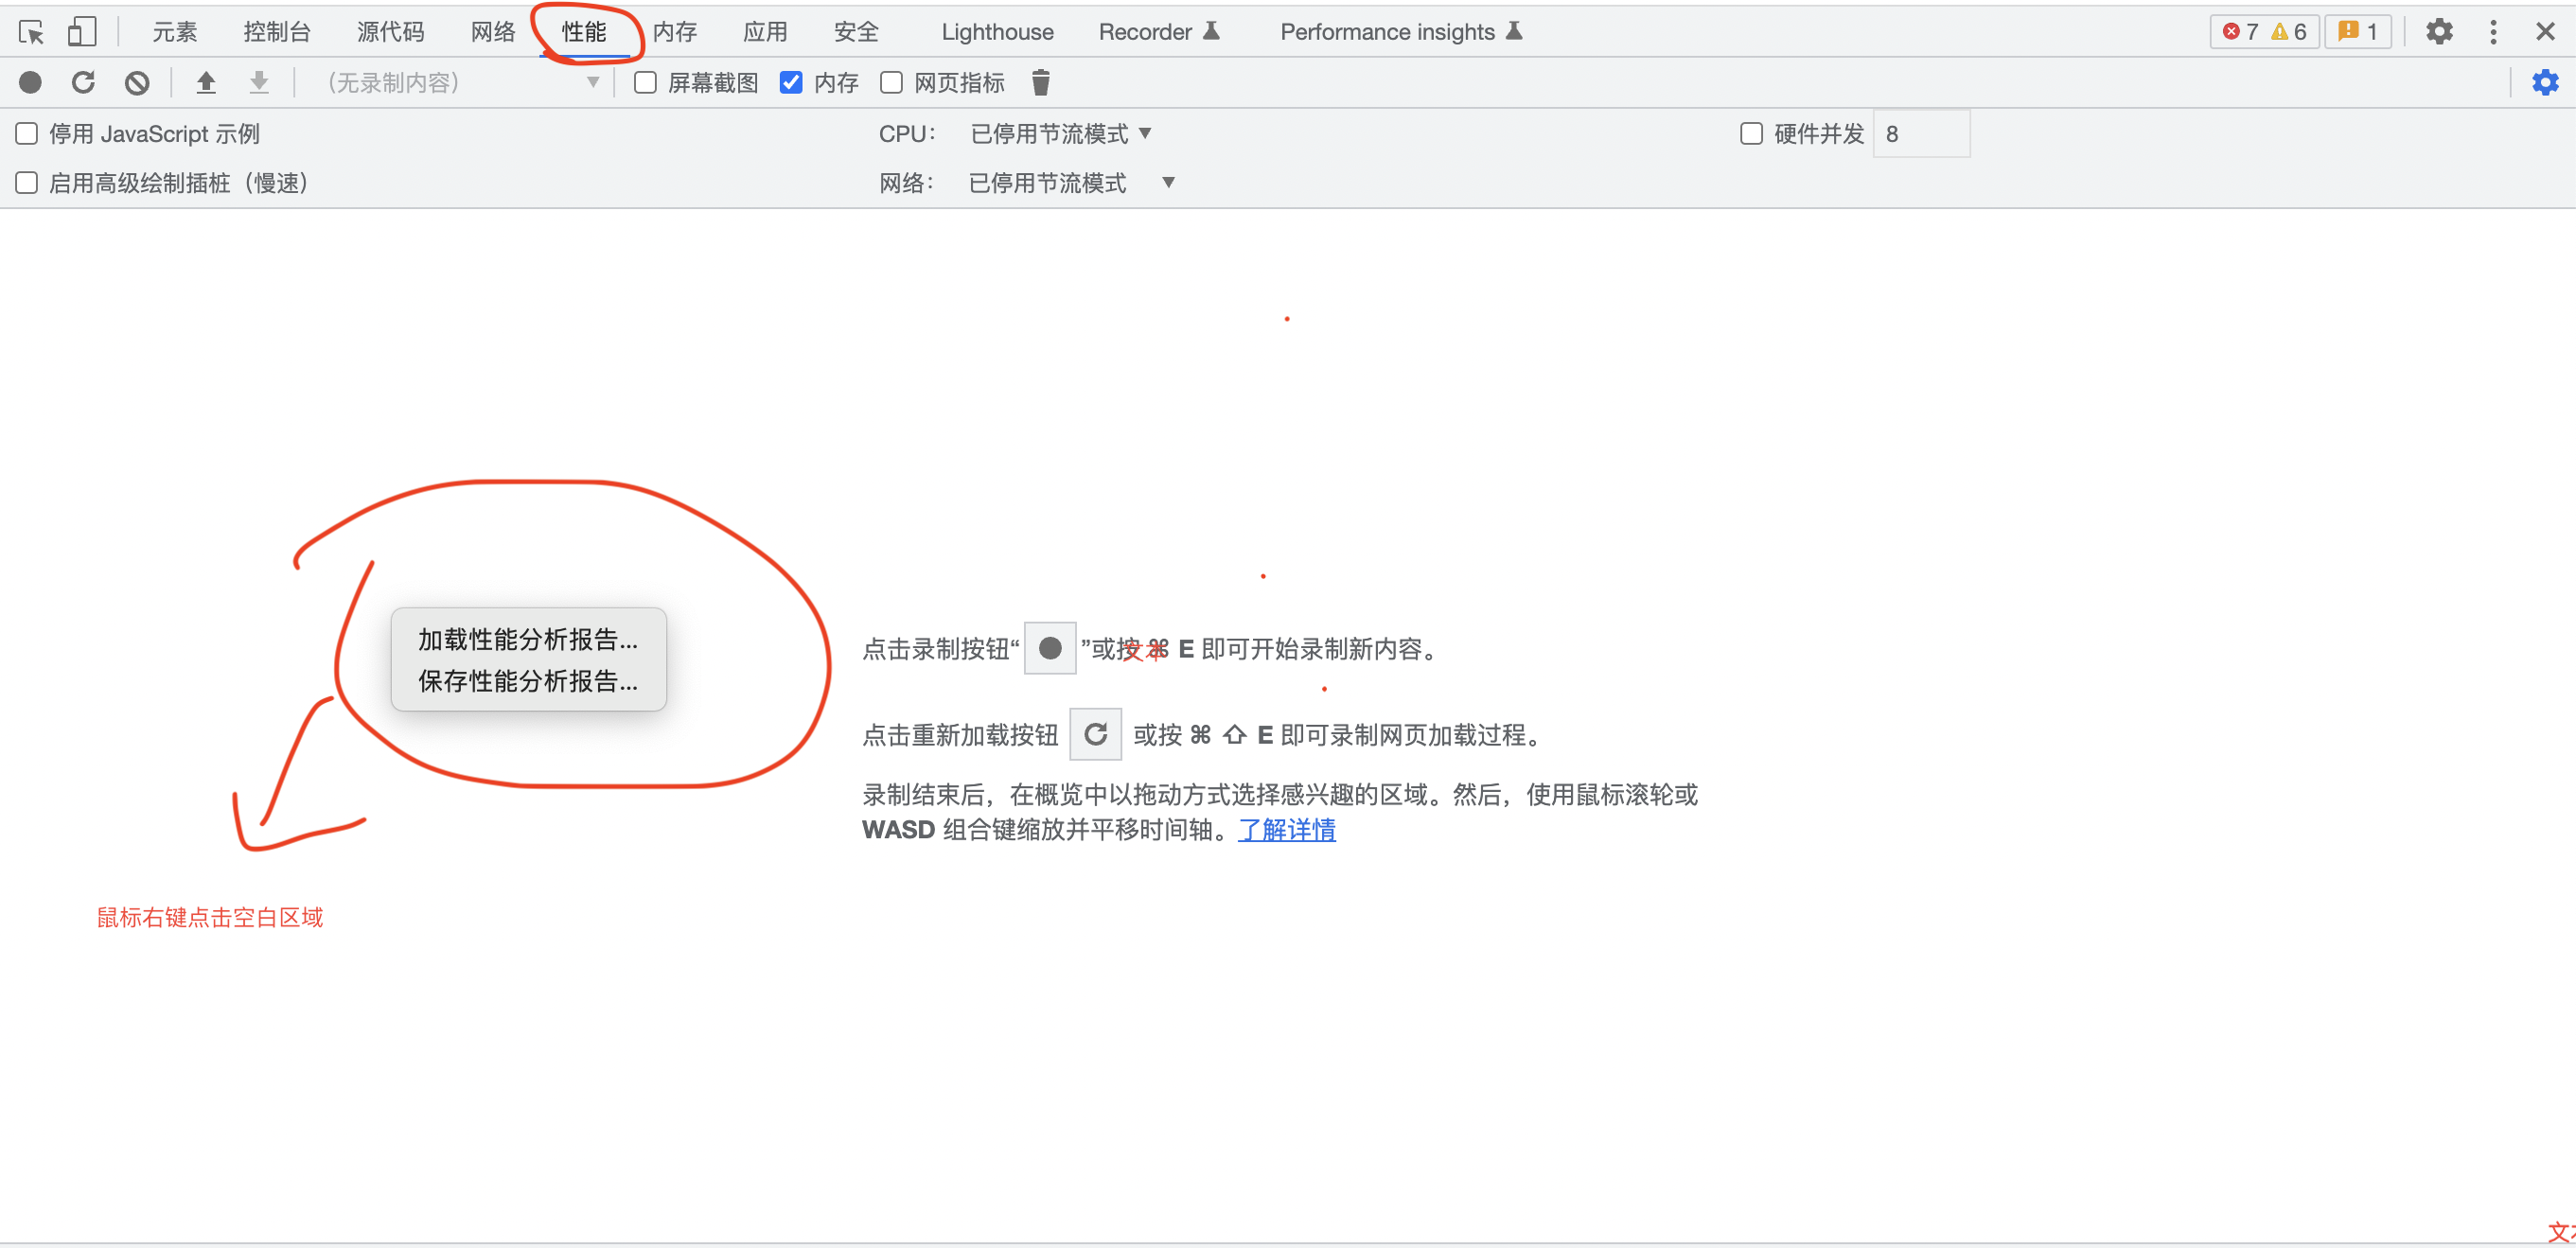
单击加载性能分析报告,选择xxx.cpuprofile文件
如何在浏览器中打开xxx.heapsnapshot文件
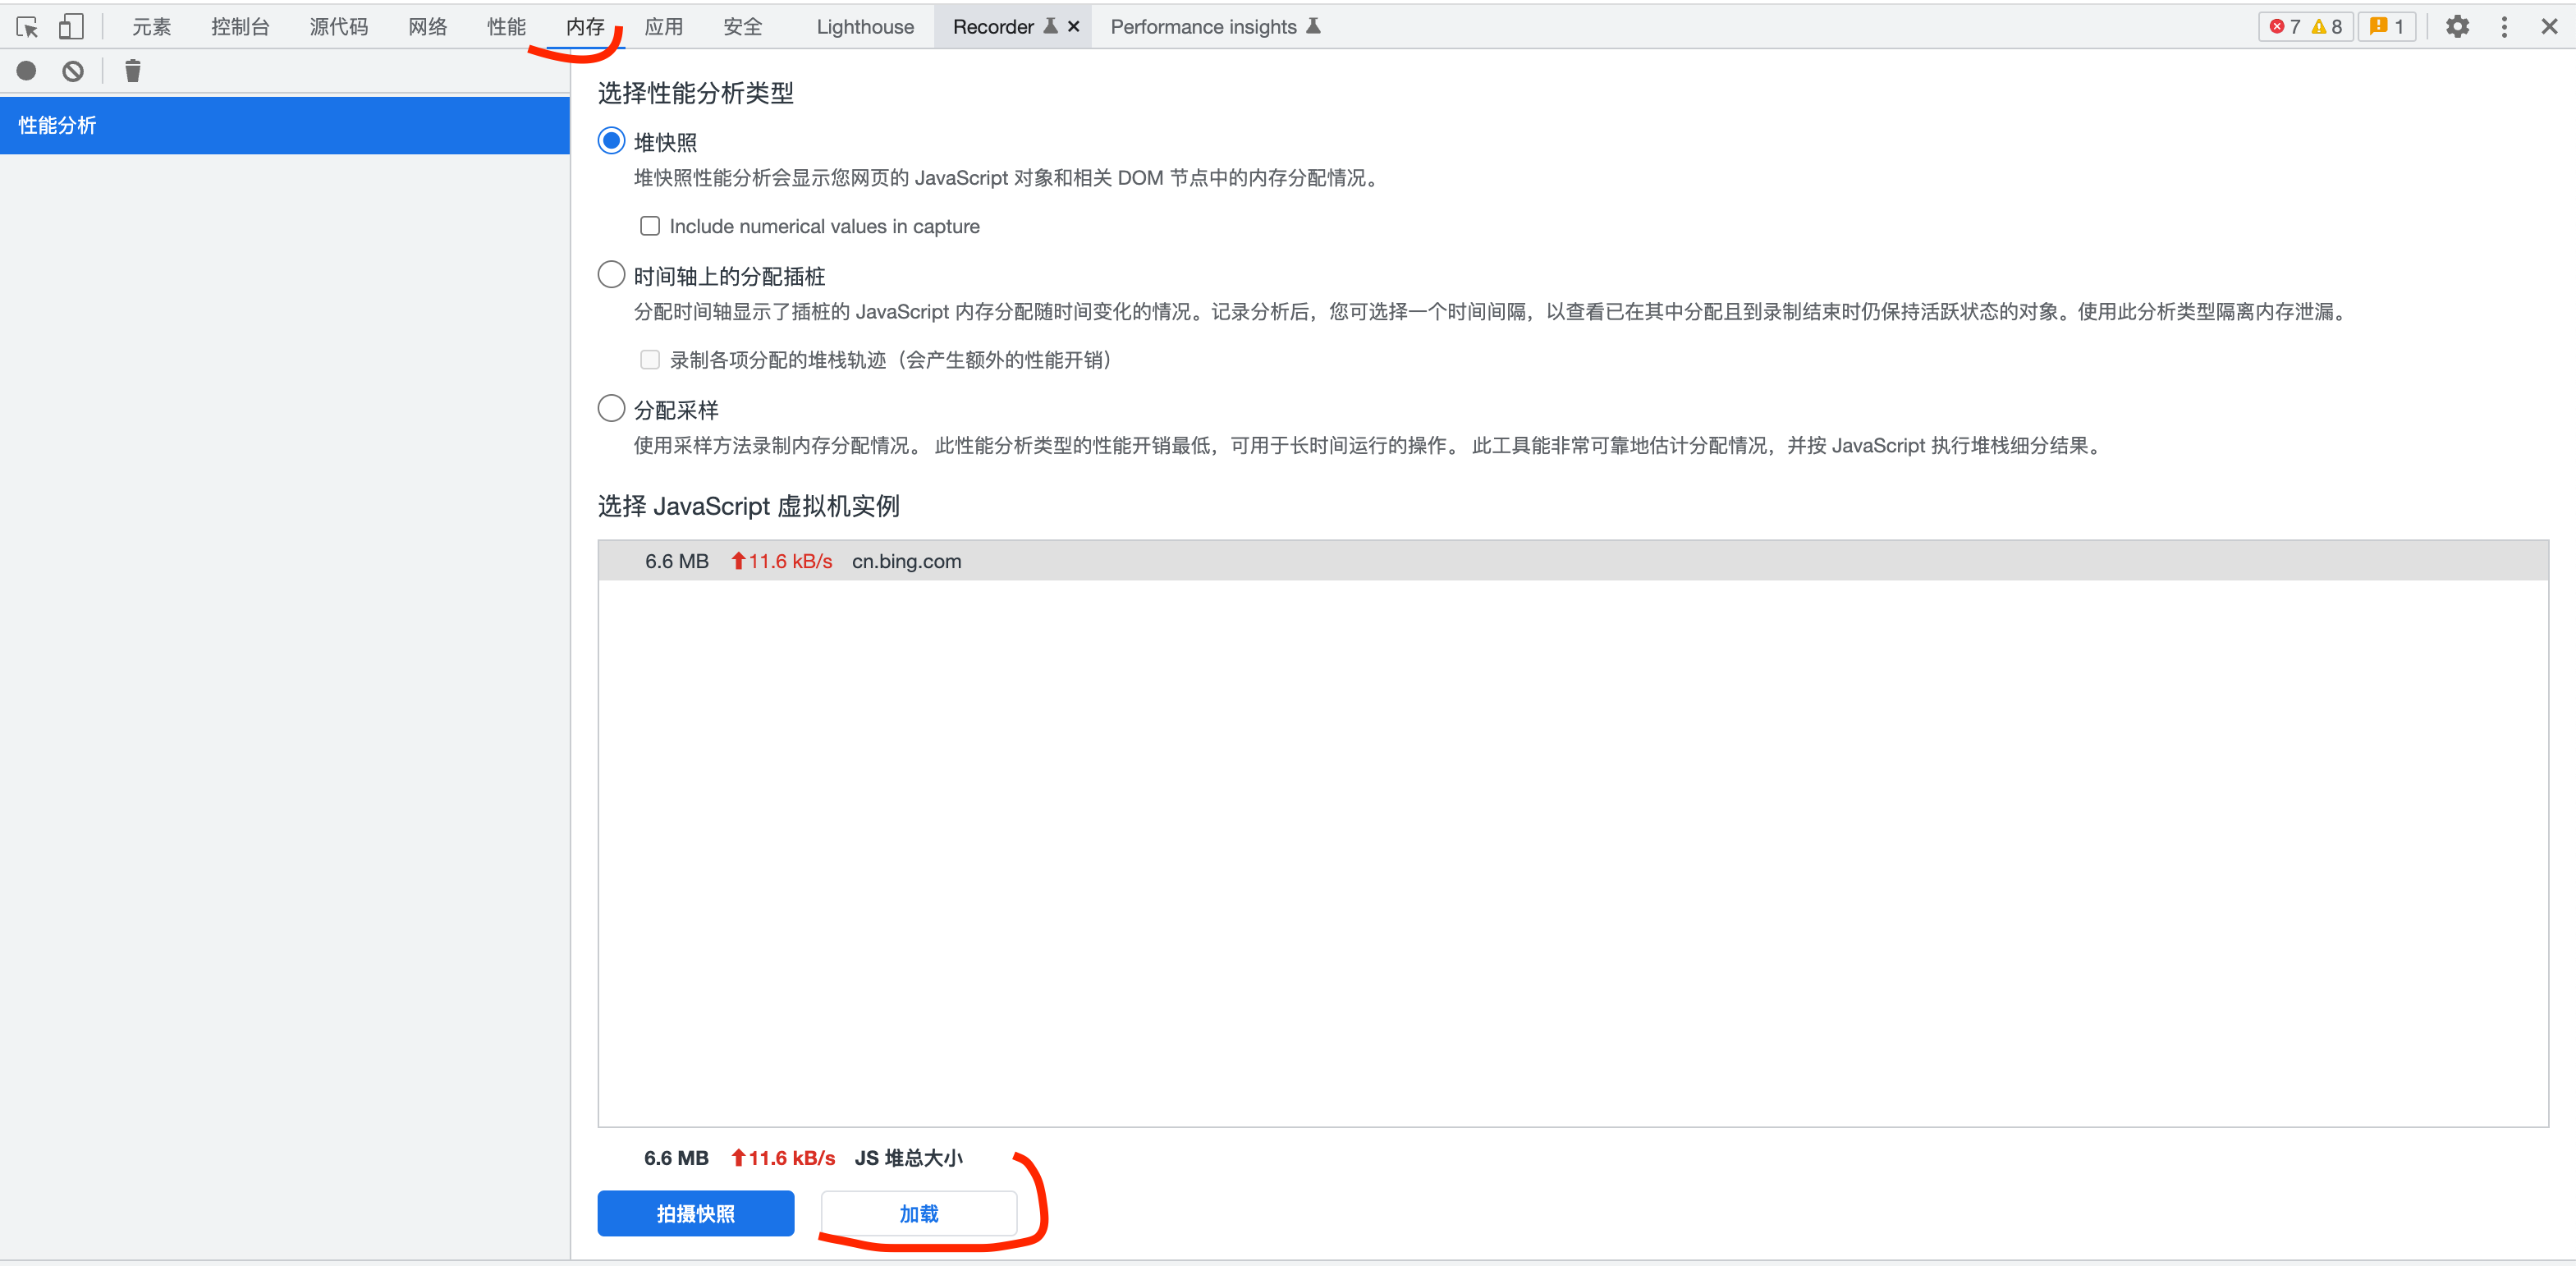
单击加载,选择xxx.heapsnapshot文件。
使用浏览器自带的功能
可以参考阮一峰老师的Node 调试工具入门教程
参考文章:
● https://www.ruanyifeng.com/blog/2018/03/node-debugger.html
● https://nodejs.org/zh-cn/docs/guides/diagnostics-flamegraph/
如果你喜欢我的作品,请考虑赞助我,以保持它们的可持续性。


 3212
3212

 被折叠的 条评论
为什么被折叠?
被折叠的 条评论
为什么被折叠?
 到【灌水乐园】发言


