


 本文介绍了如何使用Kamon监控Akka系统,包括Kamon库的使用、StatsD和Graphite作为数据后端以及Grafana仪表板的构建。通过Docker简化部署流程,展示了在JVM上监控事件驱动系统的方法。
我非常喜欢JVM,因为有很多工具可用于在运行时检查正在运行的JVM实例。 当监视线程,热方法和内存分配时,Java Mission Control(jmc)是我最喜欢的工具之一。
但是,在监视事件驱动的基于消息的系统(如Akka)时,这些工具的用途有限。 线程几乎没有意义,因为它可以处理任何类型的消息。 幸运的是,有一些工具可以填补这一空白。 尽管Akka文档确实非常广泛且有用,但是监视方面并没有很多。
我不是开发人员,而是操作人员,因此,我只会为监控存储,收集,显示东西做一个简短的介绍,并且“我认为是这样做的”。
大图景
首先,完成后,我们将运行此基础结构
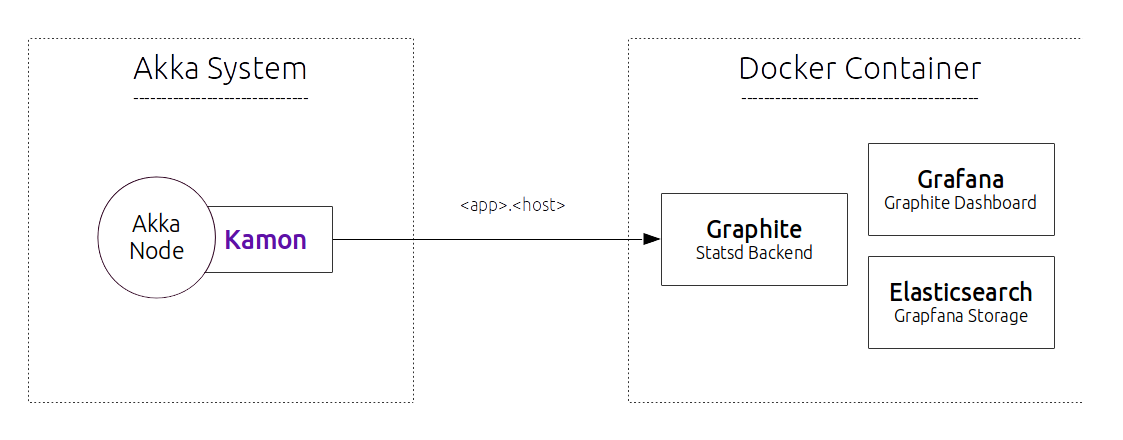
感谢docker,我们无需在右侧进行任何配置即可开始使用。
加蒙
从图片的左侧开始。 Kamon是一个使用AspectJ挂接到ActorSystem进行的方法调用并记录不同类型事件的库。 Kamon文档有很大的差距,但是您可以感觉到可能的情况。 我不会进行任何特殊配置,而只是使用默认设置来尽快上手。
StatsD –石墨
一个网络守护程序,它在Node.js平台上运行,并侦听通过UDP发送的统计信息(例如计数器和计时器),并将聚合发送到一个或多个可插入的后端服务。
Kamon还提供其他后端(datadog,newrelic)进行报告。 对于本教程,我们坚持使用免费的StatsD服务器和Graphite作为后端服务。
格拉法纳
Grafana是用于显示登录到Graphite的统计信息的前端。 您有一个不错的演示可以玩。 但是,我将详细介绍如何在Grafana仪表板中添加指标。
入门
首先,我们需要一个可以监视的应用程序。 我正在使用我的akka-kamon-activator。 签出代码:
git clone git@github.com:muuki88/activator-akka-kamon.git该应用程序包含两个消息生成器:一个用于峰值,一个用于恒定负载。 两种类型的参与者处理这些消息。 一个创建随机数,子演员计算主要因素。
Kamon依赖关系和sbt-aspectj
首先我们通过以下方式添加kamon依赖项
val kamonVersion = "0.3.4"

libraryDependencies ++= Seq(
  "com.typesafe.akka" %% "akka-actor" % "2.3.5",
  "io.kamon" %% "kamon-core" % kamonVersion,
  "io.kamon" %% "kamon-statsd" % kamonVersion,
  "io.kamon" %% "kamon-log-reporter" % kamonVersion,
  "io.kamon" %% "kamon-system-metrics" % kamonVersion,
  "org.aspectj" % "aspectjweaver" % "1.8.1"
)接下来,我们配置sbt-aspectj-plugin以在编译时编织代码。 首先将插件添加到您的plugins.sbt
addSbtPlugin("com.typesafe.sbt" % "sbt-aspectj" % "0.9.4")现在我们配置它
aspectjSettings

javaOptions <++= AspectjKeys.weaverOptions in Aspectj

// when you call "sbt run" aspectj weaving kicks in
fork in run := true
最后一步是配置应记录的内容。 打开你的application.conf您的阿卡配置所在。 Kamon使用kamon配置密钥。
kamon {

  # What should be recorder
  metrics {
    filters = [
      {
        # actors we should be monitored
        actor {
          includes = [ "user/*", "user/worker-*" ] # a list of what should be included
          excludes = [ "system/*" ]                # a list of what should be excluded
        }
      },

      # not sure about this yet. Looks important
      {
        trace {
          includes = [ "*" ]
          excludes = []
        }
      }
    ]
  }

  # ~~~~~~ StatsD configuration ~~~~~~~~~~~~~~~~~~~~~~~~

  statsd {
    # Hostname and port in which your StatsD is running. Remember that StatsD packets are sent using UDP and
    # setting unreachable hosts and/or not open ports wont be warned by the Kamon, your data wont go anywhere.
    hostname = "127.0.0.1"
    port = 8125

    # Interval between metrics data flushes to StatsD. It's value must be equal or greater than the
    # kamon.metrics.tick-interval setting.
    flush-interval = 1 second

    # Max packet size for UDP metrics data sent to StatsD.
    max-packet-size = 1024 bytes

    # Subscription patterns used to select which metrics will be pushed to StatsD. Note that first, metrics
    # collection for your desired entities must be activated under the kamon.metrics.filters settings.
    includes {
      actor       = [ "*" ]
      trace       = [ "*" ]
      dispatcher  = [ "*" ]
    }

    simple-metric-key-generator {
      # Application prefix for all metrics pushed to StatsD. The default namespacing scheme for metrics follows
      # this pattern:
      #    application.host.entity.entity-name.metric-name
      application = "yourapp"
    }
  }
}
我们的应用程序可以运行了。 但是首先,我们部署监控后端。
监控后端
正如我们在第一张图中所看到的,我们需要运行许多东西来存储日志事件。 使用的库和组件很可能是合理的,您(或者比开发人员更多的运维)将必须对其进行配置。 但是目前,我们只是在一个简单的Docker容器中一次将它们全部启动。 我没有将它们置于分离模式,所以我看到了怎么回事。
docker run -v /etc/localtime:/etc/localtime:ro -p 80:80 -p 8125:8125/udp -p 8126:8126 -p 8083:8083 -p 8086:8086 -p 8084:8084 --name kamon-grafana-dashboard muuki88/grafana_graphite:latest我的映像基于kamon 原始docker映像的分支 。
运行并构建仪表板
现在转到位于localhost的正在运行的Grafana实例。 您会看到一个默认值,我们将使用它来显示平均邮箱时间。 单击图的标题( First Graph(单击标题以进行编辑 )。现在,选择以下指标:
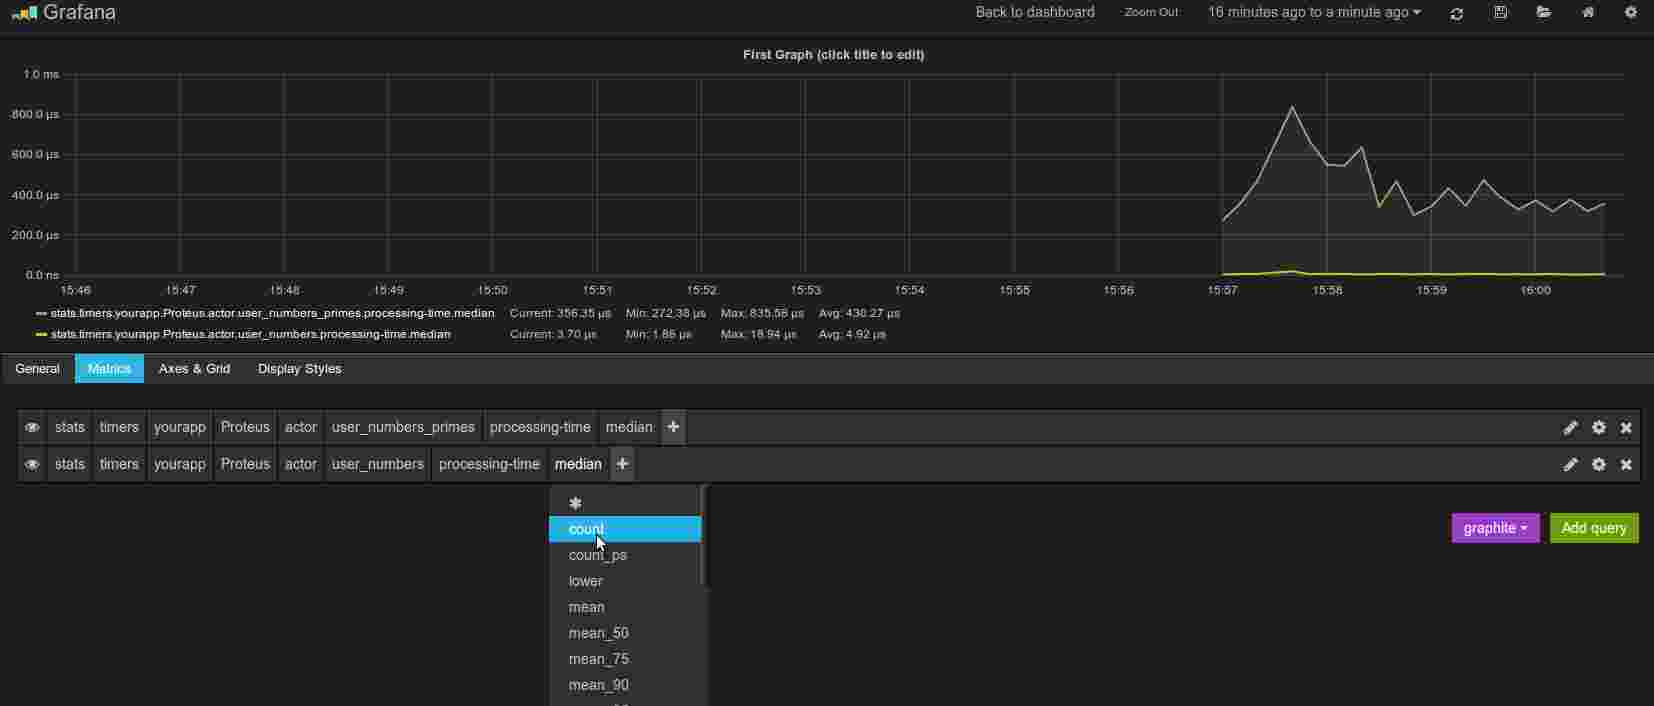
就是这样!
翻译自: https://www.javacodegeeks.com/2014/09/monitoring-akka-with-kamon.html


 554
554

 被折叠的 条评论
为什么被折叠?
被折叠的 条评论
为什么被折叠?
 到【灌水乐园】发言


