


逃逸优化
在较早的文章中,我写了关于如何开始优化性能的文章。 如果您还没有阅读过这篇文章,我建议您一定要看看,但是长话短说,作为提高性能的第一步,减少分配几乎总是值得的。 但是,准确了解您的程序实际分配的位置并不像您想象的那样容易。
在回顾有关类似主题的文章时,我发现尝试准确地测量分配与重新使用现有对象相对应花费的时间会很有趣。 我们知道在Java中分配确实非常快(暂时忽略对象分配的副作用),所以让我们看一下分配与对象重用之间的比较。
这是我编写的用来尝试测量该更改的代码的第一次尝试:
package util;

public class Allocation1 {
    static int iterations = 10_000_000;

    public static void main(String[] args) {
        for (int i = 0; i <3 ; i++) {
            testNoAllocations();
            testAllocations();
        }
    }

    private static void testNoAllocations() {
        long result = 0;
        long time = System.currentTimeMillis();
        TestObject to = new TestObject(0, 0);
        for (int i = 0; i < iterations; i++) {
            to.setI(5);
            to.setJ(5);
            result += to.getResult();
        }


        System.out.println("No allocation took "
                + (System.currentTimeMillis() - time)
                + " with result " + result);
    }

    private static void testAllocations() {
        long time = System.currentTimeMillis();
        long result = 0;

        for (int i = 0; i < iterations; i++) {
            result += new TestObject(5, 5).getResult();
        }

        System.out.println("Allocations took "
                + (System.currentTimeMillis() - time)
                + " with result " + result);
    }

    private static class TestObject {
        int i, j;

        public TestObject(int i, int j) {
            this.i = i;
            this.j = j;
        }

        public int getI() {
            return i;
        }

        public void setI(int i) {
            this.i = i;
        }

        public int getJ() {
            return j;
        }

        public void setJ(int j) {
            this.j = j;
        }

        public int getResult() {
            return i + j;
        }
    }
}
该程序的输出如下:
No allocation took 15 with result 100000000
Allocations took 11 with result 100000000
No allocation took 12 with result 100000000
Allocations took 13 with result 100000000
No allocation took 0 with result 100000000
Allocations took 1 with result 100000000
里面几乎没有任何东西,但是后来我变得可疑了。
testAllocations方法是实际分配的还是正在应用转义分析? 转义分析允许JIT绕过对象分配,并使用堆栈而不是堆。 有关更多详细信息,请参见此处 。
一种很好的查找方法是使用命令行设置-verbosegc运行程序,并查看是否正在调用gc。 我怀疑没有gc,考虑到我没有设置-Xms和-Xmx标志的事实,因此不应该这样做。
所以我写了另一个小程序,迫使testAllocate方法“转义”并分配:
package util;


public class Allocation2 {
    static int iterations = 10_000_000;

    public static void main(String[] args) {
        for (int i = 0; i <3 ; i++) {
            testNoAllocations();
            testAllocations();
        }
    }

    private static void testNoAllocations() {
        long result = 0;
        long time = System.currentTimeMillis();
        TestObject to = new TestObject(0, 0);
        TestObject[] tarr = new TestObject[iterations];
        for (int i = 0; i < iterations; i++) {
            to.setI(5);
            to.setJ(5);
            tarr[i] = to;
            result += to.getResult();
        }


        System.out.println("No allocation took "
                + (System.currentTimeMillis() - time)
                + " with result " + result);
    }

    private static void testAllocations() {
        long result = 0;
        long time = System.currentTimeMillis();

        TestObject[] tarr = new TestObject[iterations];

        for (int i = 0; i < iterations; i++) {
            tarr[i] = new TestObject(5, 5);
            result += tarr[i].getResult();
        }

        System.out.println("Allocations took "
                + (System.currentTimeMillis() - time)
                + " with result " + result);
    }

    private static class TestObject {
        int i, j;

        public TestObject(int i, int j) {
            this.i = i;
            this.j = j;
        }

        public int getI() {
            return i;
        }

        public void setI(int i) {
            this.i = i;
        }

        public int getJ() {
            return j;
        }

        public void setJ(int j) {
            this.j = j;
        }

        public int getResult() {
            return i + j;
        }
    }
}
此输出非常不同,请参见下文:
我使用-verbose:gc运行–我选择了红色的System.out,以便可以轻松识别时间。
*** No allocation took 43 with result 100000000
[GC (Allocation Failure)  111405K->108693K(142336K), 0.1243020 secs]
[Full GC (Ergonomics)  108693K->69499K(190976K), 0.3276730 secs]
[GC (Allocation Failure)  102779K->102923K(204288K), 0.1275237 secs]
[GC (Allocation Failure)  149515K->149731K(224256K), 0.2172119 secs]
[Full GC (Ergonomics)  149731K->149326K(359936K), 1.1698787 secs]
[GC (Allocation Failure)  215886K->215502K(365056K), 0.2680804 secs]
 **** Allocations took 2321 with result 100000000
*** No allocation took 37 with result 100000000
[Full GC (Ergonomics)  365307K->52521K(314368K), 0.1279458 secs]
[GC (Allocation Failure)  124201K->124497K(314368K), 0.2493061 secs]
[GC (Allocation Failure)  196177K->196401K(419840K), 0.3004662 secs]
 **** Allocations took 733 with result 100000000
[GC (Allocation Failure)  276094K->274825K(429056K), 0.5655052 secs]
[Full GC (Ergonomics)  274825K->1024K(427520K), 0.0042224 secs]
*** No allocation took 583 with result 100000000
[GC (Allocation Failure)  98304K->59382K(527872K), 0.0727687 secs]
[GC (Allocation Failure)  224246K->224582K(534016K), 0.1465164 secs]
 **** Allocations took 263 with result 100000000
*** No allocation took 15 with result 100000000
[GC (Allocation Failure)  389446K->167046K(643584K), 0.0831585 secs]
 **** Allocations took 119 with result 100000000
[GC (Allocation Failure)  366101K->91504K(653312K), 0.0006495 secs]
*** No allocation took 15 with result 100000000
[GC (Allocation Failure)  329072K->290206K(681472K), 0.1650293 secs]
 **** Allocations took 202 with result 100000000
如您所见,这次肯定是程序在分配,而分配的测试时间要慢得多。
让我们看看是否可以通过设置高-Xms值来消除GC暂停的需要。
这次,GC几乎被淘汰了,我们得到了以下结果:
*** No allocation took 48 with result 100000000
 **** Allocations took 162 with result 100000000
*** No allocation took 44 with result 100000000
 **** Allocations took 172 with result 100000000
*** No allocation took 28 with result 100000000
 **** Allocations took 179 with result 100000000
*** No allocation took 40 with result 100000000
 **** Allocations took 365 with result 100000000
*** No allocation took 73 with result 100000000
[GC (Allocation Failure)  1572864K->188862K(6029312K), 0.2602120 secs]
 **** Allocations took 499 with result 100000000
*** No allocation took 43 with result 100000000
 **** Allocations took 62 with result 100000000
*** No allocation took 17 with result 100000000
 **** Allocations took 228 with result 100000000
*** No allocation took 95 with result 100000000
 **** Allocations took 364 with result 100000000
*** No allocation took 46 with result 100000000
 **** Allocations took 194 with result 100000000
*** No allocation took 14 with result 100000000
[GC (Allocation Failure)  1761726K->199238K(6029312K), 0.2232670 secs]

 **** Allocations took 282 with result 100000000
因此,即使没有GC,分配也相当慢。
下一步是通过使用探查器查看我的程序来检查正在发生的事情。
我用我最喜欢的分析器YourKit运行了第一个程序Allocation1 ,开始看到了截然不同的行为。 我们之前显示的未分配程序现在正在分配(我可以在下面用冗长的GC运行此程序)。
这是输出:
[YourKit Java Profiler 2014内部版本14114]日志文件:/Users/daniel/.yjp/log/Allocation1-11980.log
No allocation took 20 with result 100000000
[GC (Allocation Failure)  33280K->1320K(125952K), 0.0032859 secs]
[GC (Allocation Failure)  34600K->1232K(125952K), 0.0028476 secs]
[GC (Allocation Failure)  34512K->1136K(125952K), 0.0020955 secs]
[GC (Allocation Failure)  34416K->1168K(159232K), 0.0024346 secs]
[GC (Allocation Failure)  67728K->1240K(159232K), 0.0021334 secs]
Allocations took 109 with result 100000000
No allocation took 26 with result 100000000
[GC (Allocation Failure)  67800K->1376K(222208K), 0.0036706 secs]
[GC (Allocation Failure)  134496K->1508K(222208K), 0.0024567 secs]
Allocations took 98 with result 100000000
No allocation took 1 with result 100000000
[GC (Allocation Failure)  134628K->1516K(355840K), 0.0008581 secs]

Allocations took 56 with result 100000000
在YourKit中,我们看到了这些对象的创建:
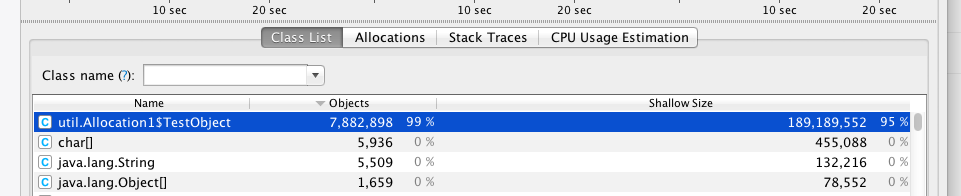
使用YourKit进行运行会干扰转义分析,并导致对象被分配!
我在上一篇文章“ 性能优化的第一规则 ”中提出的建议是消除分配。 (从YourKit的角度来看)(从YourKit的角度来看)此程序(分配1)看起来像是正在分配,并且开发人员根据我的建议可能会花费大量的精力减少分配。 当开发人员发现在重新运行该程序(没有YourKit)时根本没有实现任何事情时,他们会感到惊讶和失望。 当然,现在我们知道为什么,分配只是运行探查器的副作用! 没有分析器,分配将被“转义-分析”。
因此,我们如何知道在探查器中看到的分配是真实的还是仅由探查器干扰逃生分析引起的。
答案是使用Flight Recorder 。 有关飞行记录器和其他探查器之间的区别,请参见我以前的文章 。
这是我们运行Allocation1时的飞行记录。
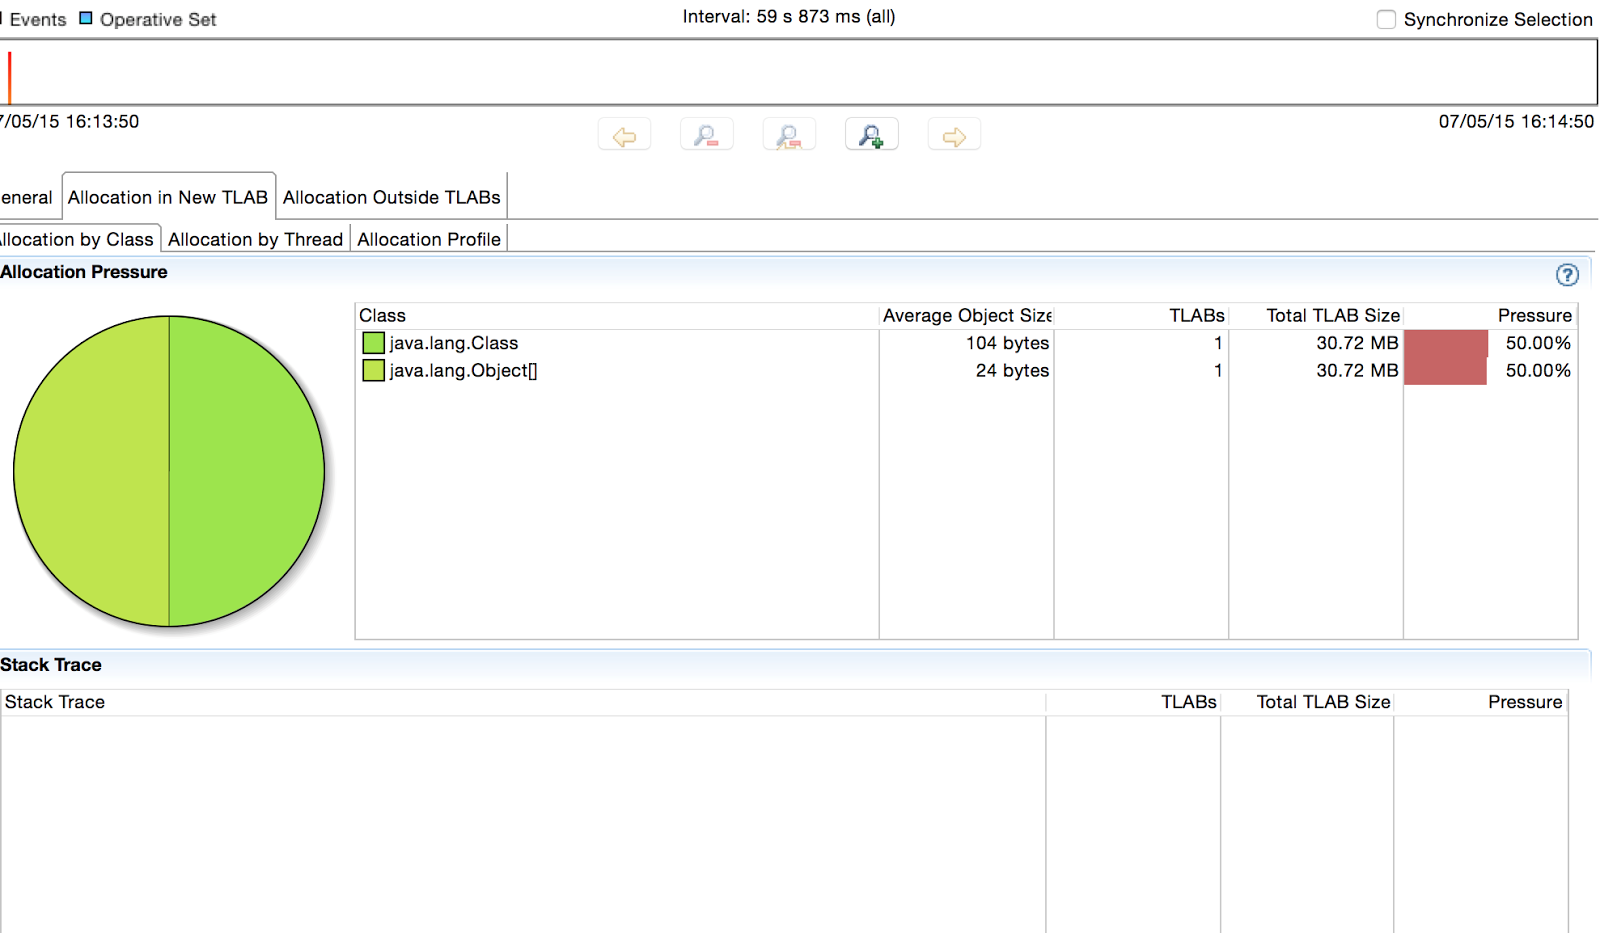
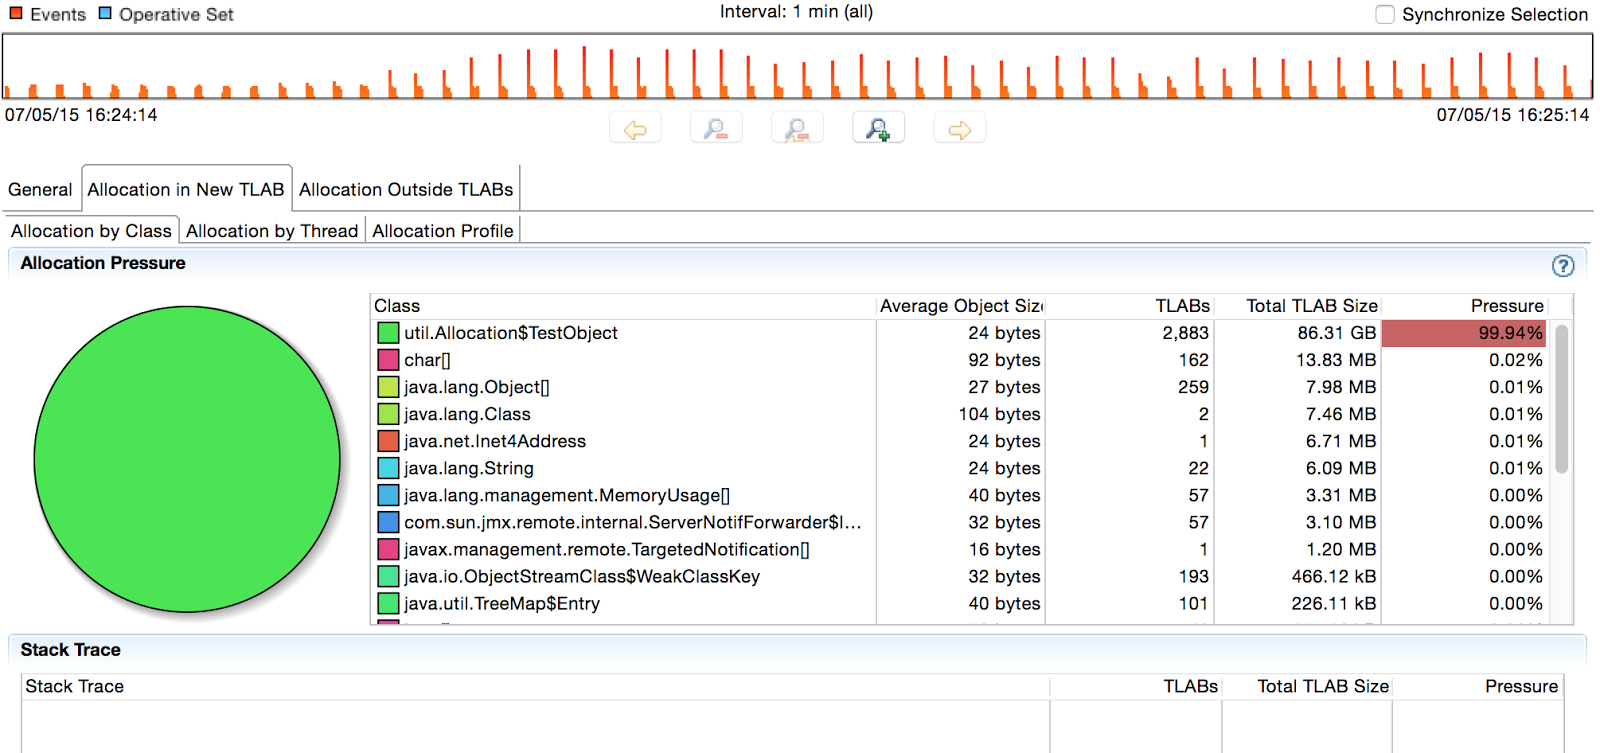
如您所见,没有记录任何分配。 将此与我们从运行Allocation2获得的飞行记录进行对比。
结论
- 最好不要分配对象
- 但是转义分析意味着调用new并不总是导致分配!
- 通常,探查器会干扰转义分析,因此请谨慎确定分配,以免在没有探查器的情况下逃脱。
- 使用Flight Recorder不应干扰逃生分析,并且可以使您更准确地反映实际分配情况。
关于该主题的进一步阅读:
随后,我从尼桑·瓦卡特(Nitsan Wakart)看到了一篇出色的文章(与往常一样): http ://psy-lob-saw.blogspot.co.uk/2014/12/the-escape-of-arraylistiterator.html
逃逸优化


 740
740

 被折叠的 条评论
为什么被折叠?
被折叠的 条评论
为什么被折叠?
 到【灌水乐园】发言


