


 本文详细介绍了如何使用MATLAB进行三维曲面绘图,包括设置图形对象句柄、动态图的创建以及如何在动态图中叠加画图。通过实例展示了动态生成圆和移动曲线的过程,同时讲解了如何利用MATLAB进行曲面交线的可视化。
目录
hold on 的基础上刷新画图:set(h, ’xdata’ ,x, ’ydata’ ,y),每次重置点(曲线或曲面)的横纵坐标
一、三维曲面绘图
二、图形对象句柄
1.三位图形属性设置
x=-2:.1:2;
[X,Y]=meshgrid(x);
Z=X.*exp(-X.^2-Y.^2);
h=surf(X,Y,Z);
get(h)
set(h,'edgecolor','b','facecolor','g','edgealpha',0.3,'facealpha',0.3)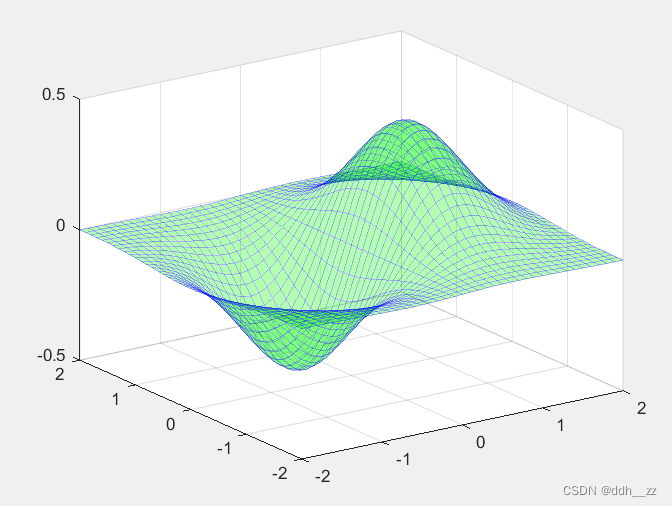
2. 动态图
要点:
1)用循环语句+pause()
2) 叠加画图:hold on
3)hold on 的基础上刷新画图:set(h, ’xdata’ ,x, ’ydata’ ,y),每次重置点(曲线或曲面)的横纵坐标
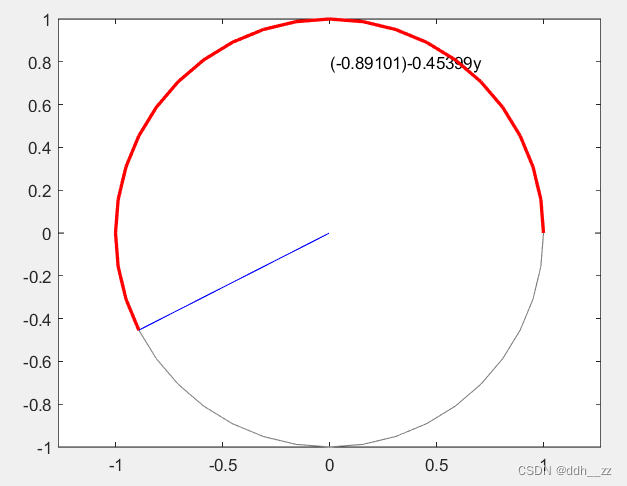
(1)动态生成圆
t=0:pi/20:2*pi;
x=cos(t);y=sin(t);
plot(x,y,'Color',[0.5 0.5 0.5])
axis equal,hold on
h_r=plot(0,0,'r')
n=length(t);
h_txt=text(0,0.8,'')
for i=1:n
    if i>=2  %i=1 下面就会出现x(0)
        plot([x(i),x(i-1)],[y(i),y(i-1)],'r-','linewidth',2)
        %[x(i),x(i-1)],[y(i),y(i-1)]可理解为向量
        %plot(X,Y) X,Y都为向量,则表示绘制一条折线;X为向量,Y为矩阵,则为多条折线

    end
    %因为前面用了hold on,所以已经画过的班级还是保留的
    %所以用set()来更新半径向量的坐标值
    set(h_r,'xdata',[0,x(i)],'ydata',[0,y(i)],'color','b') %更新下一次点的位置
    set(h_txt,'string',['(',num2str(x(i)),')',num2str(y(i)),'y'])
    %num2str 数字转为字符串
    pause(0.1)
end
(2)移动曲线
t=-2*pi:pi/10:2*pi;
y1=sin(t);y2=cos(t);
plot(t,y2,'b') %余弦
hold on;
h=plot(t,y1,'m') %正弦
for i=0:0.2:10
    y1=sin(t+i*pi/2);  %每次移动0.2*pi/2
    set(h,'ydata',y1);
    pause(0.2) %暂停0.2秒
end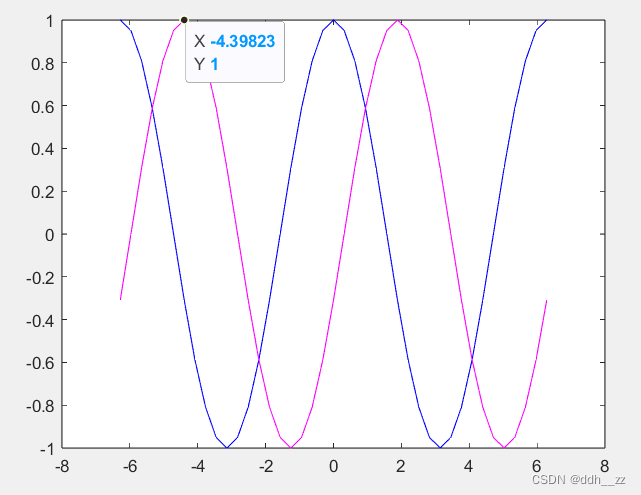
三、应用:重积分

%画两个曲面
t=-1:0.1:1;
[x,y]=meshgrid(t);
z1=x.^2+2*y.^2;
z2=2-x.^2;
mesh(x,y,z1),hold on
mesh(x,y,z2)

%求交线
r0=abs(z1-z2)<=0.1;  %相交点1;不相交0

zz=r0.*z2;yy=r0.*y;xx=r0.*x;
plot3(xx(r0~=0),yy(r0~=0),zz(r0~=0),'k*')
plot(xx(r0~=0),yy(r0~=0),'b*')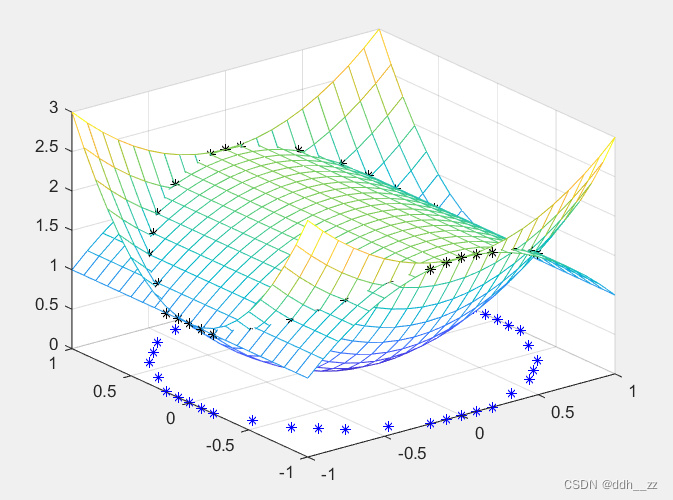


 被折叠的 条评论
为什么被折叠?
被折叠的 条评论
为什么被折叠?
 到【灌水乐园】发言


