


 该代码使用pandas读取CSV文件中的S&P500和FTSE100指数数据,将日期列转换为datetime格式,筛选出2010年的数据,并用matplotlib绘制了当年这两条指数的线性图表,调整了X轴为每月1号的刻度,增强了图表的可读性。
import pandas as pd
import matplotlib.pyplot as plt
import seaborn as sns
sns.set_theme(style='whitegrid',palette='deep')
# 读取标普500指数和富时100指数数据
df_spx500_and_ftse100 = pd.read_csv('line_chart_data.csv')
# 预览数据样式
df_spx500_and_ftse100.head(5)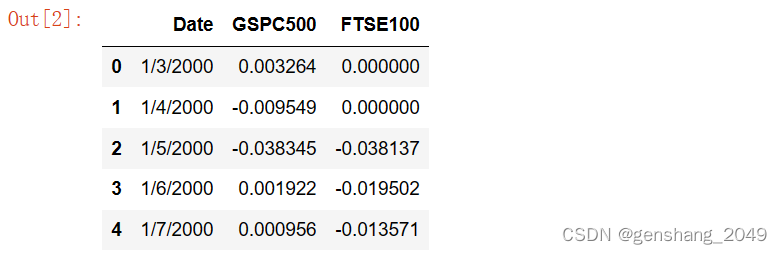
# 此时的Date列为字符串,由于下面需要进行日期比较,所以需要将字符格式转为datetime格式
# 数据处理:字符 >> 日期格式(通过pd.to_datetime()实现)
df_spx500_and_ftse100['Date'] = pd.to_datetime(df_spx500_and_ftse100['Date'])
# 预览格式转换后的结果
df_spx500_and_ftse100.head(5)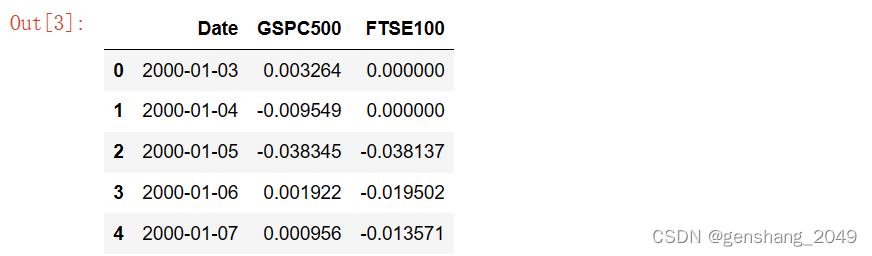
# 最低0.47元/天 解锁文章


 被折叠的 条评论
为什么被折叠?
被折叠的 条评论
为什么被折叠?
 到【灌水乐园】发言


