


曾经尝试用Excel做3D散点图,但发现Excel绘制出来的实质还是一个二维图表,无法满足需求,后来下载了Web图表控件ChartDirector,刚好它支持3D散点图样式,做出来的效果还不错。今天就跟大家演示一下如何用ChartDirector绘制3D散点图。
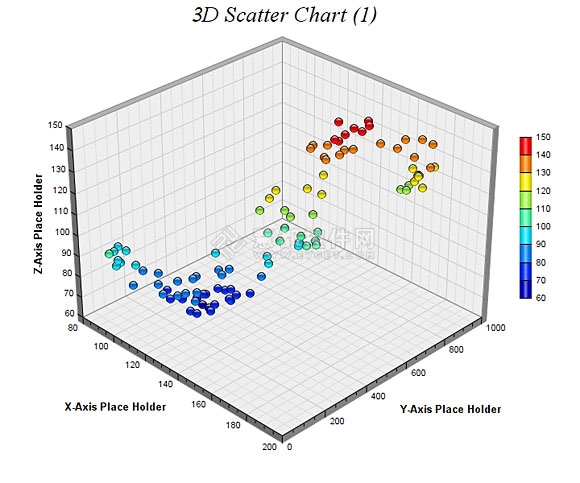
如图:
主要有以下几个步骤:
1、用ThreeDScatterChart.ThreeDScatterChart创建一个ThreeDScatterChart对象
2、用ThreeDChart.setPlotRegion指定绘图区域的位置和大小
3、用ThreeDScatterChart.addScatterGroup向图表添加一组散点。在本例中,标记颜色设置为SameAsMainColor,颜色会根据Z坐标的颜色轴进行变化,颜色轴的访问可以用ThreeDChart.colorAxis。
4、用ThreeDChart.setColorAxis设置颜色轴的位置
5、分别用BaseChart.addTitle 和 Axis.setTitle添加图表和轴标题
6、最后用BaseChart.makeChart生成图表
下面是ChartDirector生成三维散点图的部分代码:
|
1
2
3
4
5
6
7
8
9
10
11
12
13
14
15
16
17
18
19
20
21
22
23
24
25
26
27
28
29
30
31
32
33
34
35
36
37
38
39
40
41
42
|
#include "chartdir.h"
int main(int argc, char *argv[])
{
// The XYZ data for the 3D scatter chart as 3 random data series
RanSeries *r = new RanSeries(0);
DoubleArray xData = r->getSeries(100, 100, -10, 10);
DoubleArray yData = r->getSeries(100, 0, 0, 20);
DoubleArray zData = r->getSeries(100, 100, -10, 10);
// Create a ThreeDScatterChart object of size 720 x 600 pixels
ThreeDScatterChart *c = new ThreeDScatterChart(720, 600);
// Add a title to the chart using 20 points Times New Roman Italic font
c->addTitle("3D Scatter Chart (1) ", "timesi.ttf", 20);
// Set the center of the plot region at (350, 280), and set width x depth x
// height to 360 x 360 x 270 pixels
c->setPlotRegion(350, 280, 360, 360, 270);
// Add a scatter group to the chart using 11 pixels glass sphere symbols, in
// which the color depends on the z value of the symbol
c->addScatterGroup(xData, yData, zData, "", Chart::GlassSphere2Shape, 11,
Chart::SameAsMainColor);
// Add a color axis (the legend) in which the left center is anchored at (645,
// 270). Set the length to 200 pixels and the labels on the right side.
c->setColorAxis(645, 270, Chart::Left, 200, Chart::Right);
// Set the x, y and z axis titles using 10 points Arial Bold font
c->xAxis()->setTitle("X-Axis Place Holder", "arialbd.ttf", 10);
c->yAxis()->setTitle("Y-Axis Place Holder", "arialbd.ttf", 10);
c->zAxis()->setTitle("Z-Axis Place Holder", "arialbd.ttf", 10);
// Output the chart
c->makeChart("threedscatter.png");
//free up resources
delete r;
delete c;
return 0;
}
|


 3208
3208


 被折叠的 条评论
为什么被折叠?
被折叠的 条评论
为什么被折叠?
 到【灌水乐园】发言


