


![]()
![]()
![]()
![]()
![]()
<!DOCTYPE html>
<html lang="zh">
<head>
<meta charset="UTF-8" />
<meta name="viewport" content="width=device-width, initial-scale=1.0" />
<meta http-equiv="X-UA-Compatible" content="ie=edge" />
<title>Document</title>
<style type="text/css">
.box {
width: 500px;
height: 100px;
border: 1px solid red;
}
#box2{height: 400px;}
</style>
<script src="jquery.min.js"></script>
<script src="echarts.js"></script>
</head>
<body>
<div class="box" id="box"></div>
<div class="box" id="box2"></div>
<script>
var colorList = ['#afa3f5', '#00d488', '#3feed4', '#3bafff', '#f1bb4c', "rgba(250,250,250,0.5)"];
var sportsIcon = {
'a': '1.png',
'b': '1.png'
};
tbarshow3()
function tbarshow3() {
var box = echarts.init($("#box")[0]);
option = {
series: [
// 主要展示层的
{
radius: ['25%', '51%'],
type: 'pie',
label: {
normal: {
formatter: function(params) {
console.log('{a|}');
var str = '';
switch(params.name) {
case '体育技能':
str = '{a}666';
break;
case '体育行为':
str = '{a|}';
break;
}
return str
},
rich: {
a: {
width: 38,
height: 38,
backgroundColor: {
image: sportsIcon.a
},
},
b: {
width: 29,
height: 45,
backgroundColor: {
image: sportsIcon.b
},
align: 'left'
}
}
}
},
data: [{
value: 17,
name: '体育技能',
},
{
value: 23,
name: '体育行为'
}
],
},
// 边框的设置
]
};
box.setOption(option, true);
}
var sportsIcon={
a:'img/aicon.png',
b:'img/bicon.png',
c:'img/cicon.png',
d:'img/dicon.png',
e:'img/eicon.png'
}
tbarshow4()
function tbarshow4() {
var box2 = echarts.init($("#box2")[0]);
option = {
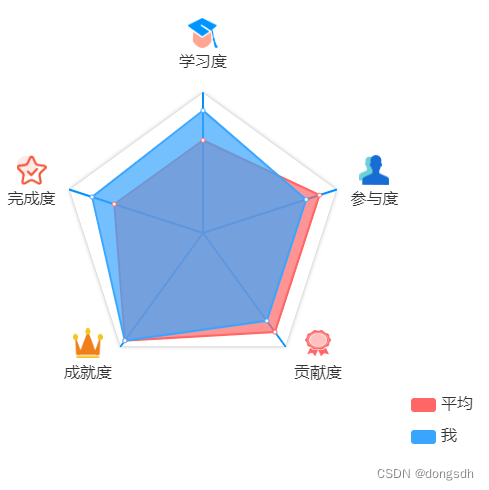
legend: {
data: ['平均','我'],
right: '5px',
bottom: '5px',
orient: 'vertical',
textStyle: {
fontFamily: 'PingFangSC-Regular',
color: '#333',
fontSize: 16,
lineHeight: 22
}
},
radar: [
{
name:{
textStyle: {
fontSize: '16',
color: '#333333',
},
formatter:function (params) {
var str = '';
switch(params){
case '学习度':str = '{d|}\n'+params+'';break;
case '完成度':str = '{c|}\n'+params;break;
case '成就度':str = '{b|}\n'+params;break;
case '贡献度':str = '{a|}\n'+params;break;
case '参与度':str = '{e|}\n'+params;break;
}
return str
},
lineHeight: 30,
rich: {
a: {
width: 26,
height: 26,
align: 'center',
backgroundColor: {
image: sportsIcon.a
}
},
b: {
width: 30,
height: 30,
align: 'center',
backgroundColor: {
image: sportsIcon.b
}
},
c: {
width: 30,
height: 30,
align: 'center',
backgroundColor: {
image: sportsIcon.c
}
},
d: {
width: 30,
height: 30,
align: 'center',
backgroundColor: {
image: sportsIcon.d
}
},
e: {
width: 30,
height: 30,
align: 'center',
backgroundColor: {
image: sportsIcon.e
}
}
}
},
indicator: [
{ text: '学习度' },
{ text: '完成度' },
{ text: '成就度' },
{ text: '贡献度' },
{ text: '参与度' }
],
center: ['44%', '55%'],
radius: 140,
startAngle: 90,
splitNumber: 4,
// name: {
// formatter:'{value}',
// textStyle: {
// fontSize: '20',
// color: '#333333',
// },
// },
splitArea: {
areaStyle: {
/*color: ['rgba(255, 255, 255, 1)',
'rgba(255, 255, 255, 1)', 'rgba(255, 255, 255, 1)',
'rgba(255, 255, 255, 1)', 'rgba(255, 255, 255, 1)'],*/
color: '#fff',
shadowColor: 'rgba(0, 0, 0, 0.3)',
shadowBlur: 4
}
},
axisLine: {
lineStyle: {
color: '#0091FF',
width: 2
}
},
splitLine: {
show: false,
lineStyle: {
color: '#0091FF',
width: 2
},
}
},
],
series: [
{
name: '雷达图',
type: 'radar',
itemStyle: {
emphasis: {
// color: 各异,
lineStyle: {
width: 4
}
}
},
data: [
{
value: [3300, 10000, 28000, 35000, 50000, 19000],
name: '平均',
itemStyle: {
normal: {
color: '#FF6666',
}
},
areaStyle: {
normal: {
color: '#FF6666'
},
}
},
{
value: [5000, 14000, 28000, 31000, 42000, 21000],
name: '我',
itemStyle: {
normal: {
color: '#39A5FE',
}
},
areaStyle: {
normal: {
color: '#39A5FE'
},
}
}
]
}
]
};
box2.setOption(option, true);
}
</script>
</body>
</html>


 3000
3000


 被折叠的 条评论
为什么被折叠?
被折叠的 条评论
为什么被折叠?
 到【灌水乐园】发言


