


前言
oracle的性能监测工具除了AWR、ASH、ADDM,还可以参考oracle的动态性能视图:v$active_session_history (dba_hist_active_sess_history)、v$sqlstats(dba_hist_sqlstat)、v$sqlarea、v$session_longops等,但是这些视图都是一段时间内的汇总,没有单条sql的执行情况。
而sql monitor提供类似mysql 慢sql日志功能,相关的动态视图v$sql_monitor、v$sql_plan_monitor
The V$SQL_MONITOR view contains a subset of the statistics available in V$SQL. However, unlike V$SQL, monitoring statistics are not cumulative over several executions. Instead, one entry in V$SQL_MONITOR is dedicated to a single execution of a SQL statement. If two executions of the same SQL statement
are being monitored, each of these executions will have a separate entry in V$SQL_MONITOR
To uniquely identify two executions of the same SQL statement, a composite key called an execution key is generated. This execution key is composed of three attributes, each corresponding to a column in V$SQL_MONITOR:
• SQL identifier to identify the SQL statement (SQL_ID)
• Start execution timestamp (SQL_EXEC_START)
• An internally generated identifier to ensure that this primary key is truly
unique (SQL_EXEC_ID)
一、确认sql monitor是否开启
默认的,statistics_level和control_management_pack_access为TYPICAL和DIAGNOSTIC+TUNING,即自动开启sql monitor。
二、sql被捕获的前提
sql monitor开启后,会自动捕获符合下面条件之一的sql到v$sql_monitor

即:
1、sql单次执行的IO/CPU时间超过5s
2、并行执行的sql,如加 /*+parallel(t,4)*/
3、加/*+monitor*/这种强制监控的语句
4、无法修改代码,监控某sql_id,在实例层面监控此sql
经测试,alter system set events sql_monitor的方式并无法监控sql_id,官方文档提及此功能有待商榷,所以v$sql_monitor中的内容目前只有前3种;
因为sql monitor可以记录超过5s的sql,这对于我们平常调优有很大的参考意义
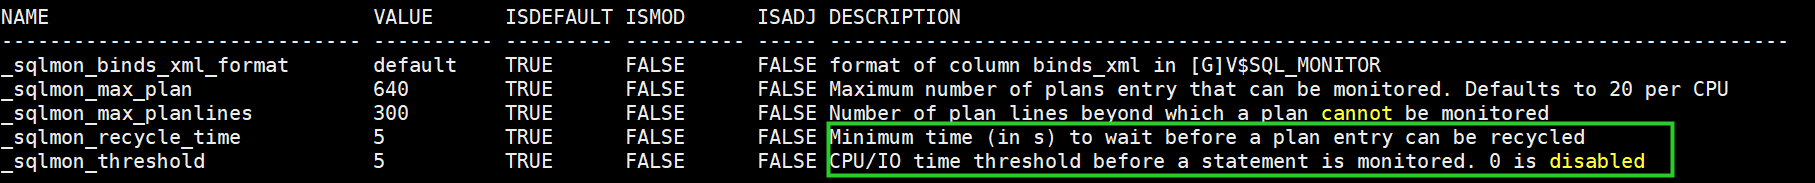
三、与sql monitor有关的参数
v$sql_monitor等动态视图每秒刷新一次,一些sqlmon隐含参数(不重启即可生效)如:
_sqlmon_recycle_time 监控的语句在动态视图中的保留时间(s)
_sqlmon_threshold 语句被监控的最小执行时间,类似mysql的long_query_time(默认为5s)
| set lines 400; col name for a30; col value for a10; col description for a80 select x.ksppinm name, y.ksppstvl value, y.ksppstdf isdefault, decode(bitand(y.ksppstvf,7),1,'MODIFIED',4,'SYSTEM_MOD','FALSE') ismod, decode(bitand(y.ksppstvf,2),2,'TRUE','FALSE') isadj, KSPPDESC description from sys.x$ksppi x, sys.x$ksppcv y where x.inst_id = userenv('Instance') and y.inst_id = userenv('Instance') and x.indx = y.indx and x.ksppinm like '%sqlmon%' order by translate(x.ksppinm, ' _', ' '); |

四、sql monitor报告查看
oracle cloud control上显示的sql monitor信息如下

如果没有GC,可以使用DBMS_SQLTUNE.report_sql_monitor来查看,比如
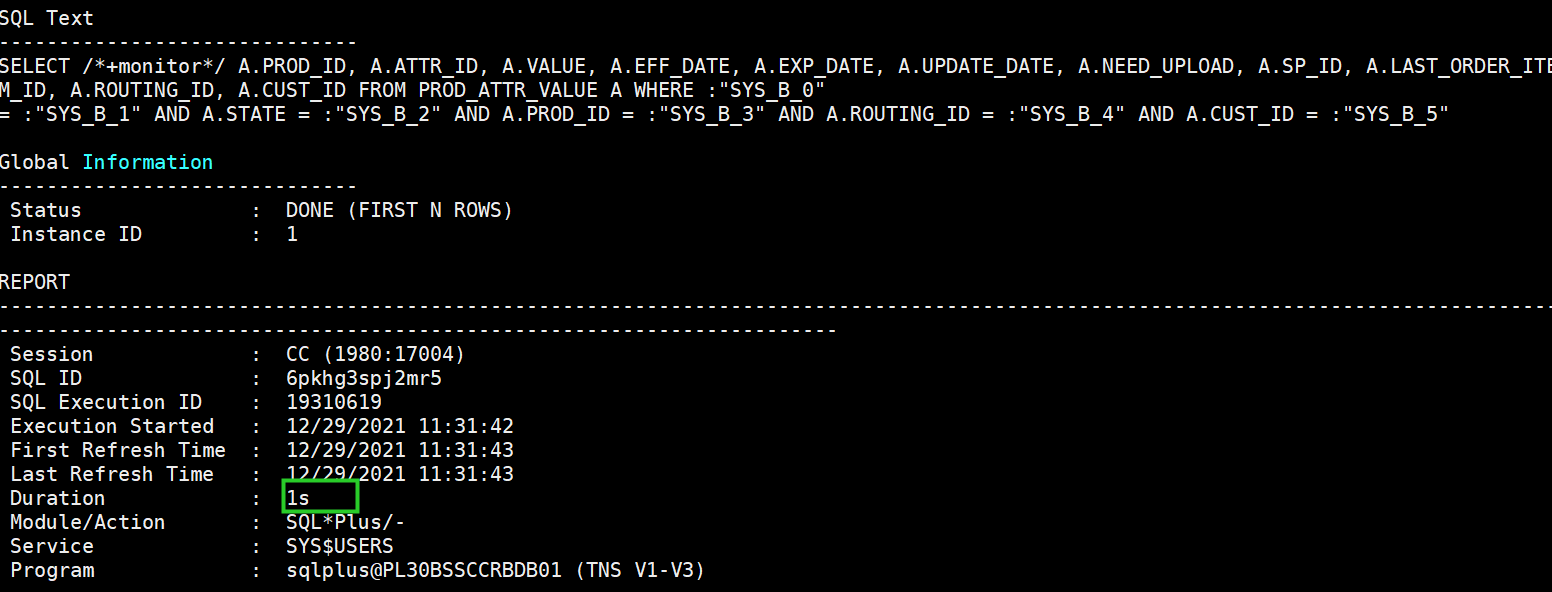
已知一个慢sql的sql_id,如果此sql执行时间超过5s,就能自动被加入v$sql_monitor,可以临时改_sqlmon_recycle_time到300(保留5min,注意抓到sql之后需要改回默认值,一面过多占用sga资源),通过以下命令得到sql的执行id:
| select max(elapsed_time/1000),max(CPU_TIME/1000),max(QUEUING_TIME/1000) from v$sql_monitor where sql_id='6pkhg3spj2mr5'; select SQL_EXEC_ID from v$sql_monitor where elapsed_time/1000>5 and sql_id='6pkhg3spj2mr5'; |
通过sql_id和SQL_EXEC_ID得到此次执行的monitor report
| set long 10000000 set longchunksize 10000000 set linesize 200 SELECT DBMS_SQLTUNE.report_sql_monitor(sql_id => '6pkhg3spj2mr5', type => 'TEXT',SQL_EXEC_ID=>'19310619') report FROM dual; |

如果sql的执行时间小于5s大于1s,可以临时修改_sqlmon_threshold为1,将1s以上的sql全部monitor(注意抓到sql之后需要改回默认值,一面过多占用sga资源);
如果sql的执行时间小于1s,因为_sqlmon_threshold只能为整数,就要自己根据原来的sql构造监控sql,强制加/*+monitor*/,再通过sql_id和SQL_EXEC_ID得到monitor report。
除了text,还可以得到html版的report下载查看
五、关闭sql monitor
修改隐含参数_sqlmon_threshold为0即可关闭sql monitor,防止某sql从v$sql_monitor age out,除了增大_sqlmon_recycle_time,还可以临时关闭sql monitor(记得分析完恢复)
| 关闭: alter system set "_sqlmon_threshold"=0; 开启: alter system set "_sqlmon_threshold"=5; |
_sqlmon_threshold设为0后,以下sql全都不再被自动监控
1、sql单次执行的IO/CPU时间超过5s
2、加hint并行执行的sql,如加 /*+parallel(t,4)*/
3、加/*+monitor*/这种强制监控的语句


 329
329


 被折叠的 条评论
为什么被折叠?
被折叠的 条评论
为什么被折叠?
 到【灌水乐园】发言


