


jsGantt 是一个可定制的、灵活的、多语言的甘特图组件,由原生 JavaScript 构建。它使用客户端渲染以获得快速的性能和动态的交互性。非常适用于任何需要交互式时间线或时间表显示的项目。
更多特点
-
多语言支持: 通过对多语言的支持,使您的甘特图可以在全球范围内使用。
-
任务和可折叠的任务组: 以有组织的方式构建你的任务,并轻松浏览它们。
-
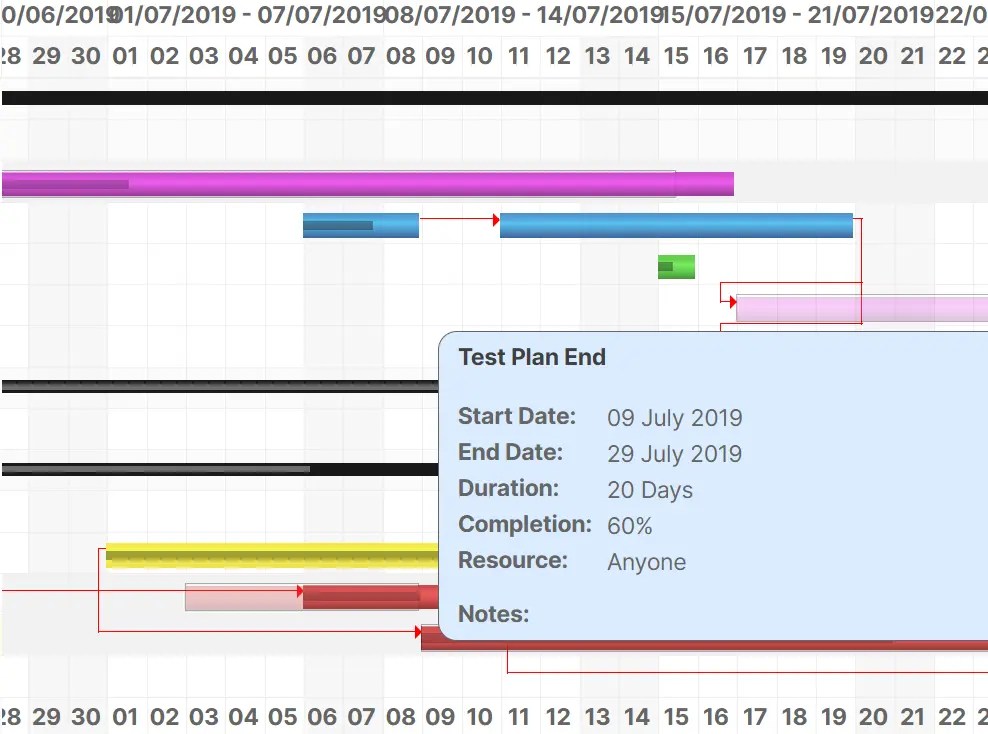
依赖关系和突出显示: 可视化任务的依赖性,并通过简单的悬停获得任务细节。
-
数据可编辑性: 通过内嵌的责任方列表,随时更新你的甘特表。
-
附加列: 使用附加列来丰富你的甘特表,使其具有更多的数据。
-
动态加载和格式变化: 动态加载任务,并在小时、日、周、月和季度格式之间毫不费力地切换。
-
远程或本地数据: 从本地JS对象或远程JSON/XML数据源获取你的甘特图数据。
-
也可与Angular、React、Vue和.Net合作
如何使用它
1.安装并导入jsGantt。
# NPM
$ npm i jsgantt-improved
import {JSGantt} from 'jsgantt-improved';
2.或者直接在文档中加载所需的JS/CSS文件。
<!-- OR -->
<link rel="stylesheet" href="dist/jsgantt.css" />
<script src="dist/jsgantt.js"></script>
3.创建一个空的容器来放置甘特图。
<div style="position:relative" class="gantt" id="example"></div>
4.创建一个新的甘特图实例。
-
pDiv: 图表容器的选择器
-
pFormat: “小时”、“日”、“周”、"月 "或 “季度”
// JSGantt.GanttChart(pDiv, pFormat);
const myChart = new JSGantt.GanttChart(document.getElementById('GanttChartDIV'), 'day');
5.从JS对象、JS字符串、JSON或XML加载任务数据。
// object
myChart.AddTaskItemObject({
  pID: 1,
  pName: "Name 1",
  pStart: "2023-02-25",
  pEnd: "2023-03-17",
  pPlanStart: "2023-04-01",
  pPlanEnd: "2023-04-15 12:00",
  pClass: "",
  pPlanClass: ""
  pLink: "",
  pMile: 0,
  pRes: "Brian", // resource name
  pComp: 0,
  pGroup: 0, // 0 = normal task, 1 = standard group task, 2 = combined group task
  pParent: 0, // parent ID
  pOpen: 1, // 1 = open, 0 = closed
  pDepend: "", // comma separated list of ids this task is dependent on
  pCaption: "",
  pCost: 1000,
  pNotes: "Some Notes text",
  pBarText: "ex. bar text",
  category: "My Category",
  sector: "Finance"
});
// JSON
JSGantt.parseJSON('./data.json', myChart);
// XML
JSGantt.parseXML("./data.xml", myChart);
6.在页面上画出图表。
myChart.Draw();
7.按ID删除一个任务项目。
myChart.RemoveTaskItem(5);
8.清除所有任务。
myChart.ClearTasks()
9.设置选项。
g.setOptions({
  vCaptionType: 'Complete',  // Set to Show Caption : None,Caption,Resource,Duration,Complete,
  vQuarterColWidth: 36,
  vDateTaskDisplayFormat: 'day dd month yyyy', // Shown in tooltip box
  vDayMajorDateDisplayFormat: 'mon yyyy - Week ww',// Set format to display dates in the "Major" header of the "Day" view
  vWeekMinorDateDisplayFormat: 'dd mon', // Set format to display dates in the "Minor" header of the "Week" view
  vLang: lang,
  vAdditionalHeaders: { // Add data columns to your table
    category: {
      title: 'Category'
    },
    sector: {
      title: 'Sector'
    }
  },
  vShowTaskInfoLink: 1, // Show link in tool tip (0/1)
  vShowEndWeekDate: 0,  // Show/Hide the date for the last day of the week in header for daily view (1/0)
  vUseSingleCell: 10000, // Set the threshold at which we will only use one cell per table row (0 disables).  Helps with rendering performance for large charts.
  vFormatArr: ['Day', 'Week', 'Month', 'Quarter'], // Even with setUseSingleCell using Hour format on such a large chart can cause issues in some browsers
  vScrollTo: new Date(),
  // EVENTS
  // OnChangee
  vEventsChange: {
    taskname: console.log,
    res: console.log,
  },
  // EventsClickCell
  vEvents: {
    taskname: console.log,
    res: console.log,
    dur: console.log,
    comp: console.log,
    start: console.log,
    end: console.log,
    planstart: console.log,
    planend: console.log,
    cost: console.log,
    additional_category: console.log, // for additional fields
    beforeDraw: ()=>console.log('before draw listener'),
    afterDraw: ()=>console.log('before after listener')
  },
  vEventClickRow: console.log,
  vEventClickCollapse: console.log
});


 117
117


 被折叠的 条评论
为什么被折叠?
被折叠的 条评论
为什么被折叠?
 到【灌水乐园】发言


