


下载安装Elasticsearch
linux中 elasticsearch不能以root用户启动 需要创建一个新用户
下载地址:https://www.elastic.co/cn/downloads/past-releases/elasticsearch-7-6-2
添加用户
[root@localhost ~]# adduser esname
将安装目录赋权给新用户
[root@localhost ~]# chown -R esname  /opt
#上传到/opt目录并解压文件
[root@localhost opt]# tar -zxvf elasticsearch-7.6.2-linux-x86_64.tar.gz
#切换用户
[root@localhost opt]# su esname

#进入解压后文件夹 启动elasticsearch
[esname@localhost opt]$ cd elasticsearch-7.6.2
[esname@localhost elasticsearch-7.6.2]$ ./bin/elasticsearch -d
报错:
future versions of Elasticsearch will require Java 11; your Java version from [/opt/jdk1.8.0_171/jre] does not meet this requirement
#这是因为jdk版本过低造成的可忽略,或者换成上面建议的jdk11.
启动成功后访问:http://192.168.133.172:9200/

部分常见es启动报错场景:

进入config目录修改elasticsearch.yml文件
取消注释保留一个节点
cluster.initial_master_nodes: ["node-1"]
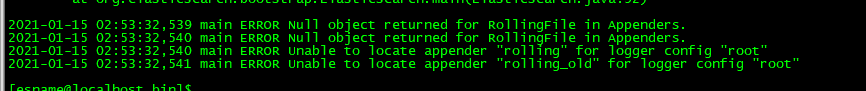
针对此错误需要进入config目录修改文件log4j2.properties 中logger.deprecation.level = warn 改为 error
[esname@localhost config]$ ll
[esname@localhost config]$ vi log4j2.properties

系统后台已经有一个elasticsearch进程。需要杀掉该进程。
查看启动进程进程
[esname@localhost bin]$ ps -ef | grep elastic

使用kill -9 端口号  杀掉进程 重新启动
安装nodejs
官网: https://nodejs.org/en/download/
#使用以下命令解压
[root@localhost opt]# tar -xvf node-v14.9.0-linux-x64.tar.xz
#重命名
[root@localhost opt]# mv node-v14.9.0-linux-x64 nodejs
#添加软连
[root@localhost opt]# ln -s /opt/nodejs/bin/npm /usr/local/bin/npm
[root@localhost opt]# ln -s /opt/nodejs/bin/node /usr/local/bin/node
#查看版本号
[root@localhost opt]# node -v
[root@localhost opt]# npm -v
下载安装elasticsearch-head
Github地址: https://github.com/mobz/elasticsearch-head
下载
[root@localhost ~]# wget https://github.com/mobz/elasticsearch-head/archive/master.zip
解压
[root@localhost opt]# unzip master.zip
如出现下面提示,执行下面的命令
bash: unzip: command not found
[root@localhost opt]# yum install unzip zip
#修改解压后的名称
[es@localhost opt]$ mv elasticsearch-head-master/ elasticsearch-head
#进入解压后的目录
[es@localhost opt]$ cd elasticsearch-head/
#安装
[root@localhost elasticsearch-head]# npm install
安装出现以下错误

针对:npm ERR! phantomjs-prebuilt@2.1.16 install: `node install.js`错误
#解决
[root@localhost elasticsearch-head]# npm install phantomjs-prebuilt@2.1.16 --ignore-scripts
再次编译

针对:npm WARN elasticsearch-head@0.0.0 license should be a valid SPDX license expression错误
编辑目录下的package.json 文件
[root@localhost elasticsearch-head]# vi package.json

针对错误:elasticsearch-head@0.0.0 license
    需要:将icense修改为为 重新编译
针对错误:fsevent
    fsevent是mac系统的,在win或者Linux下使用了,所以会有警告,忽略即可。fsevent的作用是能够检测文件目录的修改,可以记录恶意软件的非法操作,获取恶意软件的完整路径,删除和修改日期。


启动elasticsearch-head
[root@localhost elasticsearch-head]# npm run start

> elasticsearch-head@0.0.0 start /opt/elasticsearch-head
> grunt server

Running "connect:server" (connect) task
Waiting forever...
Started connect web server on http://localhost:9100
访问 elasticsearch-head
在浏览器访问:http://192.168.133.170:9100/

修改elasticsearch服务连接地址:http://192.168.133.170:9200/

如果修改完连接地址连接不上elasticsearch服务:
在elasticsearch的安装目录下找到config文件夹,找到elasticsearch.yml文件,打开编辑它,加上如下这两行配置
http.cors.enabled: true
http.cors.allow-origin: "*"
http.cors.enabled:配置项表示是否支持跨域,默认为false;
http.cors.allow-origin:当设置允许跨域,默认为*,表示支持所有域名,如果我们只是允许某些网站能访问,那么可以使用正则表达式。比如只允许本地地址。 /https?😕/localhost(:[0-9]+)?/
然后重启elasticsearch,打开elasticsearch-head重新连接。
安装ik分词器
#github地址
https://github.com/medcl/elasticsearch-analysis-ik
#下载
wget https://github.com/medcl/elasticsearch-analysis-ik/releases/download/v7.10.1/elasticsearch-analysis-ik-7.10.1.zip
#进入plugins目录创建新文件夹 将下载的ik分词器解压
[es@localhost opt]$ cd /opt/elasticsearch/plugins/
[es@localhost plugins]$ mkdir ik
[es@localhost plugins]$ cd ik/
[es@localhost ik]$ mv /opt/elasticsearch-analysis-ik-7.10.1.zip  /opt/elasticsearch/plugins/ik/
[es@localhost ik]$ unzip elasticsearch-analysis-ik-7.10.1.zip
[es@localhost ik]$ ll
total 5832
-rw-r--r--. 1 es es  263965 May  6  2018 commons-codec-1.9.jar
-rw-r--r--. 1 es es   61829 May  6  2018 commons-logging-1.2.jar
drwxr-xr-x. 2 es es    4096 Dec 25  2019 config
-rw-r--r--. 1 es es   54626 Dec 17 11:54 elasticsearch-analysis-ik-7.10.1.jar
-rw-rw-r--. 1 es es 4504592 Dec 16 22:59 elasticsearch-analysis-ik-7.10.1.zip
-rw-r--r--. 1 es es  736658 May  6  2018 httpclient-4.5.2.jar
-rw-r--r--. 1 es es  326724 May  6  2018 httpcore-4.4.4.jar
-rw-r--r--. 1 es es    1807 Dec 17 11:55 plugin-descriptor.properties
-rw-r--r--. 1 es es     125 Dec 17 11:55 plugin-security.policy
#重启后进行测试
[es@localhost ik]$ curl -XGET -H "Content-Type: application/json"  "http://localhost:9200/_analyze?pretty=true" -d'{"text":"公安部:各地校车将享最高路权"}';
{
  "tokens" : [
    {
      "token" : "公",
      "start_offset" : 0,
      "end_offset" : 1,
      "type" : "<IDEOGRAPHIC>",
      "position" : 0
    },
    {
      "token" : "安",
      "start_offset" : 1,
      "end_offset" : 2,
      "type" : "<IDEOGRAPHIC>",
      "position" : 1
    },
  ……
    {
      "token" : "路",
      "start_offset" : 12,
      "end_offset" : 13,
      "type" : "<IDEOGRAPHIC>",
      "position" : 11
    },
    {
      "token" : "权",
      "start_offset" : 13,
      "end_offset" : 14,
      "type" : "<IDEOGRAPHIC>",
      "position" : 12
    }
  ]
}
下载安装Logstash
下载
wget https://artifacts.elastic.co/downloads/logstash/logstash-7.6.2.tar.gz
[root@localhost opt]# tar -zxvf logstash-7.6.2.tar.gz
[root@localhost opt]# chown -R esname /opt/logstash-7.6.2
[root@localhost opt]# su esname
[esname@localhost opt]$ cd logstash-7.6.2
[esname@localhost logstash-7.6.2]$ cd config/
[esname@localhost config]$ vi logstash-es.conf
#添加以下内容
input {
  stdin { }
  beats {
    port => 9900
    ssl => false
  }
}
output {
    elasticsearch {
        action => "index"
        hosts => "192.168.133.172:9200"
        index  => "logstash-%{+YYYY-MM}"
    }
    stdout { codec=> rubydebug }
}

#启动服务
[esname@localhost config]$ ../bin/logstash -f ./logstash-es.conf
安装kibana
#下载
[root@localhost opt]# wget https://artifacts.elastic.co/downloads/kibana/kibana-7.6.2-linux-x86_64.tar.gz
#解压
[root@localhost opt]# tar -zxvf kibana-7.6.2-linux-x86_64.tar.gz
#重命名
[root@localhost opt]# mv kibana-7.6.2-linux-x86_64   kibana-7.6.2
#进入config目录
[root@localhost opt]# cd kibana-7.6.2/config/
[root@localhost config]# ll
total 12
-rw-r--r--. 1 root root 3009 Mar 26  2020 apm.js
-rw-r--r--. 1 root root 5249 Mar 26  2020 kibana.yml
#编辑   kibana.yml文件

重启elasticsearch,然后启动kibana
#赋权给esname用户
[root@localhost opt]# chown -R esname  /opt

#进入kibana安装目录的bin目录,启动kibana
[esname@localhost bin]$ ./kibana
Error: Could not close browser client handle! 解决方案如下:
在kibana的config中的kibana.yml中配置
elasticsearch.hosts: [“http://192.168.147.52:9200”]
xpack.reporting.capture.browser.chromium.disableSandbox: true
xpack.reporting.capture.browser.chromium.proxy.enabled: false
xpack.reporting.enabled: false

重新启动kibaba。
访问:http://192.168.133.172:5601/


 1231
1231


 被折叠的 条评论
为什么被折叠?
被折叠的 条评论
为什么被折叠?
 到【灌水乐园】发言


