


参考:Windows Phone 7 chart图表编程、Silverlight的DataVisualization类组件研究(图表控件)
一、图表控件的选择
http://stackoverflow.com/questions/577278/wpf-chart-controls/4227432#4227432,
免费的可选择有:amCharts-Quick-Charts,sparrowtoolkit,DataVisualization组件
2.1.1、MainPage页面
<phone:PhoneApplicationPage
    x:Class="QuickChartsWPApp.MainPage"
    xmlns="http://schemas.microsoft.com/winfx/2006/xaml/presentation"
    xmlns:x="http://schemas.microsoft.com/winfx/2006/xaml"
    xmlns:phone="clr-namespace:Microsoft.Phone.Controls;assembly=Microsoft.Phone"
    xmlns:shell="clr-namespace:Microsoft.Phone.Shell;assembly=Microsoft.Phone"
    xmlns:d="http://schemas.microsoft.com/expression/blend/2008"
    xmlns:mc="http://schemas.openxmlformats.org/markup-compatibility/2006"
    xmlns:amq="clr-namespace:AmCharts.Windows.QuickCharts;assembly=AmCharts.Windows.QuickCharts.WP"
    FontFamily="{StaticResource PhoneFontFamilyNormal}"
    FontSize="{StaticResource PhoneFontSizeNormal}"
    Foreground="{StaticResource PhoneForegroundBrush}"
    SupportedOrientations="PortraitOrLandscape" Orientation="Portrait"
    mc:Ignorable="d" d:DesignWidth="480" d:DesignHeight="768"
    shell:SystemTray.IsVisible="True" Loaded="PhoneApplicationPage_Loaded">

    <!--LayoutRoot contains the root grid where all other page content is placed-->
    <Grid x:Name="LayoutRoot" Background="Transparent">
        <Grid.RowDefinitions>
            <RowDefinition Height="Auto"/>
            <RowDefinition Height="*"/>
        </Grid.RowDefinitions>

        <!--TitlePanel contains the name of the application and page title-->
        <StackPanel x:Name="TitlePanel" Grid.Row="0" Margin="24,24,0,12">
            <TextBlock x:Name="ApplicationTitle" Text="amCharts QuickCharts for Windows Phone" Style="{StaticResource PhoneTextNormalStyle}"/>
            <TextBlock x:Name="PageTitle" Text="serial chart" Margin="-3,-8,0,0" Style="{StaticResource PhoneTextTitle1Style}"/>
        </StackPanel>

        <!--ContentPanel - place additional content here-->
        <Grid x:Name="ContentGrid" Grid.Row="1">
            <Grid.RowDefinitions>
                <RowDefinition />
                <RowDefinition Height="Auto" />
                <RowDefinition Height="Auto" />
            </Grid.RowDefinitions>
            <amq:SerialChart x:Name="chart1" DataSource="{Binding Data}" CategoryValueMemberPath="cat1"
                         AxisForeground="White"
                         PlotAreaBackground="Black"
                             MinimumCategoryGridStep="200"
                         GridStroke="DarkGray">
                <amq:SerialChart.Graphs>
                    <amq:LineGraph ValueMemberPath="val1" Title="Line #1" Brush="Blue" />
                    <amq:ColumnGraph ValueMemberPath="val2" Title="Column #2" Brush="#8000FF00" ColumnWidthAllocation="0.4" />
                    <amq:AreaGraph ValueMemberPath="val3" Title="Area #1" Brush="#80FF0000" />
                </amq:SerialChart.Graphs>
            </amq:SerialChart>


            <Grid Grid.Row="1" >
                <Grid.ColumnDefinitions>
                    <ColumnDefinition></ColumnDefinition>
                    <ColumnDefinition></ColumnDefinition>
                    <ColumnDefinition></ColumnDefinition>
                </Grid.ColumnDefinitions>
                <Button Content="Rebind" Click="Button_Click" Grid.Column="0" />
                <Button Content="Pie" Click="GoPie_Click"  Grid.Column="1" />
                <Button Content="Pivot" Click="GoPivot_Click"  Grid.Column="2" />
            </Grid>

        </Grid>
    </Grid>

    <!-- Sample code showing usage of ApplicationBar
    <phone:PhoneApplicationPage.ApplicationBar>
        <shell:ApplicationBar IsVisible="True" IsMenuEnabled="True">
            <shell:ApplicationBarIconButton x:Name="appbar_button1" IconUri="/Images/appbar_button1.png" Text="Button 1"></shell:ApplicationBarIconButton>
            <shell:ApplicationBarIconButton x:Name="appbar_button2" IconUri="/Images/appbar_button2.png" Text="Button 2"></shell:ApplicationBarIconButton>
            <shell:ApplicationBar.MenuItems>
                <shell:ApplicationBarMenuItem x:Name="menuItem1" Text="MenuItem 1"></shell:ApplicationBarMenuItem>
                <shell:ApplicationBarMenuItem x:Name="menuItem2" Text="MenuItem 2"></shell:ApplicationBarMenuItem>
            </shell:ApplicationBar.MenuItems>
        </shell:ApplicationBar>
    </phone:PhoneApplicationPage.ApplicationBar>
    -->


</phone:PhoneApplicationPage>
2.1.2、后台
using System;
using System.Collections.Generic;
using System.Linq;
using System.Net;
using System.Windows;
using System.Windows.Controls;
using System.Windows.Documents;
using System.Windows.Input;
using System.Windows.Media;
using System.Windows.Media.Animation;
using System.Windows.Shapes;
using Microsoft.Phone.Controls;
using System.Collections.ObjectModel;
using System.Windows.Threading;

namespace QuickChartsWPApp
{
    public partial class MainPage : PhoneApplicationPage
    {
        // Constructor
        public MainPage()
        {
            InitializeComponent();
        }

        private ObservableCollection<TestDataItem> _data = new ObservableCollection<TestDataItem>()
        {
            new TestDataItem() { cat1 = "cat1", val1=5, val2=15, val3=12},
            new TestDataItem() { cat1 = "cat2", val1=15.2, val2=1.5, val3=2.1M},
            new TestDataItem() { cat1 = "cat3", val1=25, val2=5, val3=2},
            new TestDataItem() { cat1 = "cat4", val1=8.1, val2=1, val3=22},
            new TestDataItem() { cat1 = "cat5", val1=8.1, val2=1, val3=22},
            new TestDataItem() { cat1 = "cat6", val1=8.1, val2=1, val3=22},
            new TestDataItem() { cat1 = "cat7", val1=4.1, val2=4, val3=2},
            new TestDataItem() { cat1 = "cat8", val1=8.1, val2=1, val3=22},
            new TestDataItem() { cat1 = "cat9", val1=8.1, val2=1, val3=22},
            new TestDataItem() { cat1 = "cat10", val1=8.1, val2=1, val3=22},
            new TestDataItem() { cat1 = "cat11", val1=8.1, val2=1, val3=22},
            new TestDataItem() { cat1 = "cat12", val1=8.1, val2=1, val3=22},
            new TestDataItem() { cat1 = "cat13", val1=4.1, val2=4, val3=2},
            new TestDataItem() { cat1 = "cat14", val1=8.1, val2=1, val3=22},
            new TestDataItem() { cat1 = "cat15", val1=8.1, val2=1, val3=22},
            new TestDataItem() { cat1 = "cat16", val1=8.1, val2=1, val3=22},
            new TestDataItem() { cat1 = "cat17", val1=8.1, val2=1, val3=22},
        };

        public ObservableCollection<TestDataItem> Data { get { return _data; } }

        private void PhoneApplicationPage_Loaded(object sender, RoutedEventArgs e)
        {
            this.DataContext = this;
        }

        private void Button_Click(object sender, RoutedEventArgs e)
        {
            _data.Clear();
            _data.Add(new TestDataItem() { cat1 = "cat1", val1 = 5, val2 = 15, val3 = 12 });
            _data.Add(new TestDataItem() { cat1 = "cat2", val1=15.2, val2=1.5, val3=2.1M});
            _data.Add(new TestDataItem() { cat1 = "cat3", val1=25, val2=5, val3=2});
            _data.Add(new TestDataItem() { cat1 = "cat4", val1=8.1, val2=1, val3=22});
            _data.Add(new TestDataItem() { cat1 = "cat5", val1=8.1, val2=1, val3=22});
            _data.Add(new TestDataItem() { cat1 = "cat6", val1=8.1, val2=1, val3=22});
            _data.Add(new TestDataItem() { cat1 = "cat7", val1=4.1, val2=4, val3=2});
            _data.Add(new TestDataItem() { cat1 = "cat8", val1=8.1, val2=1, val3=22});
            _data.Add(new TestDataItem() { cat1 = "cat9", val1=8.1, val2=1, val3=22});
            _data.Add(new TestDataItem() { cat1 = "cat10", val1=8.1, val2=1, val3=22});
            _data.Add(new TestDataItem() { cat1 = "cat11", val1=8.1, val2=1, val3=22});
            _data.Add(new TestDataItem() { cat1 = "cat12", val1=8.1, val2=1, val3=22});
            _data.Add(new TestDataItem() { cat1 = "cat13", val1=4.1, val2=4, val3=2});
            _data.Add(new TestDataItem() { cat1 = "cat14", val1=8.1, val2=1, val3=22});
            _data.Add(new TestDataItem() { cat1 = "cat15", val1=8.1, val2=1, val3=22});
            _data.Add(new TestDataItem() { cat1 = "cat16", val1=8.1, val2=1, val3=22});
            _data.Add(new TestDataItem() { cat1 = "cat17", val1=8.1, val2=1, val3=22});
        }

        private void GoPie_Click(object sender, RoutedEventArgs e)
        {
            NavigationService.Navigate(new Uri("/PieChart.xaml", UriKind.Relative));
        }

        private void GoPivot_Click(object sender, RoutedEventArgs e)
        {
            NavigationService.Navigate(new Uri("/PivotPage1.xaml", UriKind.Relative));
        }
    }

    public class TestDataItem
    {
        public string cat1 { get; set; }
        public double val1 { get; set; }
        public double val2 { get; set; }
        public decimal val3 { get; set; }
    }
}
2.1.3 、效果

2.2.1 、PieChart页面
<phone:PhoneApplicationPage
x:Class="QuickChartsWPApp.PieChart"
xmlns="http://schemas.microsoft.com/winfx/2006/xaml/presentation"
xmlns:x="http://schemas.microsoft.com/winfx/2006/xaml"
xmlns:phone="clr-namespace:Microsoft.Phone.Controls;assembly=Microsoft.Phone"
xmlns:shell="clr-namespace:Microsoft.Phone.Shell;assembly=Microsoft.Phone"
xmlns:d="http://schemas.microsoft.com/expression/blend/2008"
xmlns:mc="http://schemas.openxmlformats.org/markup-compatibility/2006"
xmlns:amq="clr-namespace:AmCharts.Windows.QuickCharts;assembly=AmCharts.Windows.QuickCharts.WP"
FontFamily="{StaticResource PhoneFontFamilyNormal}"
FontSize="{StaticResource PhoneFontSizeNormal}"
Foreground="{StaticResource PhoneForegroundBrush}"
SupportedOrientations="PortraitOrLandscape" Orientation="Portrait"
mc:Ignorable="d" d:DesignHeight="768" d:DesignWidth="480"
shell:SystemTray.IsVisible="True"
Loaded="PhoneApplicationPage_Loaded">
<!--LayoutRoot contains the root grid where all other page content is placed-->
<Grid x:Name="LayoutRoot" Background="Transparent">
<Grid.RowDefinitions>
<RowDefinition Height="Auto"/>
<RowDefinition Height="*"/>
</Grid.RowDefinitions>
<!--TitlePanel contains the name of the application and page title-->
<StackPanel x:Name="TitlePanel" Grid.Row="0" Margin="24,24,0,12">
<TextBlock x:Name="ApplicationTitle" Text="amCharts QuickCharts for Windows Phone" Style="{StaticResource PhoneTextNormalStyle}"/>
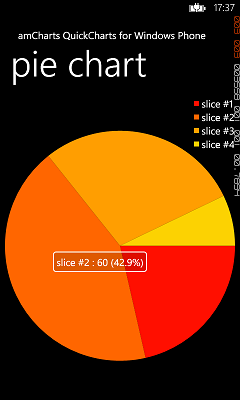
<TextBlock x:Name="PageTitle" Text="pie chart" Margin="-3,-8,0,0" Style="{StaticResource PhoneTextTitle1Style}"/>
</StackPanel>
<!--ContentPanel - place additional content here-->
<Grid x:Name="ContentGrid" Grid.Row="1">
<amq:PieChart x:Name="pie1"
TitleMemberPath="title"
ValueMemberPath="value"
>
</amq:PieChart>
</Grid>
</Grid>
</phone:PhoneApplicationPage>
2.2.2 、后台
using System;
using System.Collections.Generic;
using System.Linq;
using System.Net;
using System.Windows;
using System.Windows.Controls;
using System.Windows.Documents;
using System.Windows.Input;
using System.Windows.Media;
using System.Windows.Media.Animation;
using System.Windows.Shapes;
using Microsoft.Phone.Controls;
using System.Collections.ObjectModel;

namespace QuickChartsWPApp
{
    public partial class PieChart : PhoneApplicationPage
    {
        public PieChart()
        {
            InitializeComponent();
        }

        public ObservableCollection<PData> Data = new ObservableCollection<PData>()
        {
            new PData() { title = "slice #1", value = 30 },
            new PData() { title = "slice #2", value = 60 },
            new PData() { title = "slice #3", value = 40 },
            new PData() { title = "slice #4", value = 10 },
        };

        private void PhoneApplicationPage_Loaded(object sender, RoutedEventArgs e)
        {
            pie1.DataSource = Data;
        }
    }

    public class PData
    {
        public string title { get; set; }
        public double value { get; set; }
    }
}
2.2.3、效果
三、sparrowtoolkit控件
3.1 、MainPage页面
<phone:PhoneApplicationPage
x:Class="Chart.MainPage"
xmlns="http://schemas.microsoft.com/winfx/2006/xaml/presentation"
xmlns:x="http://schemas.microsoft.com/winfx/2006/xaml"
xmlns:phone="clr-namespace:Microsoft.Phone.Controls;assembly=Microsoft.Phone"
xmlns:shell="clr-namespace:Microsoft.Phone.Shell;assembly=Microsoft.Phone"
xmlns:d="http://schemas.microsoft.com/expression/blend/2008"
xmlns:mc="http://schemas.openxmlformats.org/markup-compatibility/2006"
mc:Ignorable="d"
xmlns:local="clr-namespace:Chart"
xmlns:sparrow="clr-namespace:Sparrow.Chart;assembly=Sparrow.Chart.WP8.45"
FontFamily="{StaticResource PhoneFontFamilyNormal}"
FontSize="{StaticResource PhoneFontSizeNormal}"
Foreground="{StaticResource PhoneForegroundBrush}"
SupportedOrientations="Portrait" Orientation="Portrait"
shell:SystemTray.IsVisible="True">
<!--LayoutRoot 是包含所有页面内容的根网格-->
<Grid x:Name="LayoutRoot" Background="Transparent">
<Grid.RowDefinitions>
<RowDefinition Height="Auto"/>
<RowDefinition Height="*"/>
</Grid.RowDefinitions>
<!-- 本地化说明:
若要本地化显示的字符串,请将其值复制到应用程序的非特定语言资源文件(AppResources.resx)
中的适当命名的键,然后
将属性的引号之间的硬编码文本值
替换为其路径指向该字符串名称的绑定子句。
例如:
Text="{Binding Path=LocalizedResources.ApplicationTitle, Source={StaticResource LocalizedStrings}}"
此绑定指向模板的名为“ApplicationTitle”的字符串资源。
在“项目属性”选项卡中添加受支持的语言将会为
每种语言创建一个新的 resx 文件,该文件可以包含 UI 字符串的翻译值
。这些示例中的绑定将导致在运行时从
与应用程序的 CurrentUICulture 匹配的 .resx 文件中
提取属性的值。
-->
<!--TitlePanel 包含应用程序的名称和页标题-->
<StackPanel x:Name="TitlePanel" Grid.Row="0" Margin="12,17,0,28">
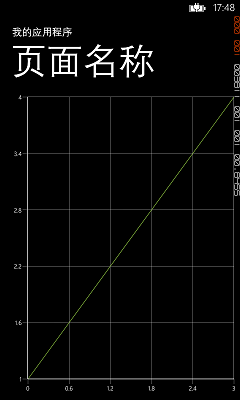
<TextBlock Text="我的应用程序" Style="{StaticResource PhoneTextNormalStyle}" Margin="12,0"/>
<TextBlock Text="页面名称" Margin="9,-7,0,0" Style="{StaticResource PhoneTextTitle1Style}"/>
</StackPanel>
<!--ContentPanel - 在此处放置其他内容-->
<Grid x:Name="ContentPanel" Grid.Row="1" Margin="12,0,12,0">
<!--<sparrow:SparrowChart>
<sparrow:SparrowChart.XAxis>
<sparrow:LinearXAxis/>
</sparrow:SparrowChart.XAxis>
<sparrow:SparrowChart.YAxis>
<sparrow:LinearYAxis/>
</sparrow:SparrowChart.YAxis>
<sparrow:LineSeries>
<sparrow:LineSeries.Points>
<sparrow:DoublePoint Data="0" Value="1"/>
<sparrow:DoublePoint Data="1" Value="2"/>
<sparrow:DoublePoint Data="2" Value="3"/>
<sparrow:DoublePoint Data="3" Value="4"/>
</sparrow:LineSeries.Points>
</sparrow:LineSeries>
</sparrow:SparrowChart>-->
<sparrow:SparrowChart>
<sparrow:SparrowChart.DataContext>
<local:ViewModel/>
</sparrow:SparrowChart.DataContext>
<sparrow:SparrowChart.XAxis>
<sparrow:LinearXAxis/>
</sparrow:SparrowChart.XAxis>
<sparrow:SparrowChart.YAxis>
<sparrow:LinearYAxis/>
</sparrow:SparrowChart.YAxis>
<sparrow:LineSeries PointsSource="{Binding Collection}" XPath="X" YPath="Y"/>
</sparrow:SparrowChart>
</Grid>
<!--取消注释,以显示对齐网格,从而帮助确保
控件在公用边界上对齐。图像在系统栏中显示时的
上边距为 -32px。如果隐藏了系统栏,则将此值设为 0
(或完全删除边距)。
在发送之前删除此 XAML 和图像本身。-->
<!--<Image Source="/Assets/AlignmentGrid.png" VerticalAlignment="Top" Height="800" Width="480" Margin="0,-32,0,0" Grid.Row="0" Grid.RowSpan="2" IsHitTestVisible="False" />-->
</Grid>
</phone:PhoneApplicationPage>3.2 、后台
using System;
using System.Collections.Generic;
using System.Linq;
using System.Net;
using System.Windows;
using System.Windows.Controls;
using System.Windows.Navigation;
using Microsoft.Phone.Controls;
using Microsoft.Phone.Shell;
using Chart.Resources;
using System.Collections.ObjectModel;

namespace Chart
{
    public partial class MainPage : PhoneApplicationPage
    {
        // 构造函数
        public MainPage()
        {
            InitializeComponent();

            // 用于本地化 ApplicationBar 的示例代码
            //BuildLocalizedApplicationBar();
        }

        // 用于生成本地化 ApplicationBar 的示例代码
        //private void BuildLocalizedApplicationBar()
        //{
        //    // 将页面的 ApplicationBar 设置为 ApplicationBar 的新实例。
        //    ApplicationBar = new ApplicationBar();

        //    // 创建新按钮并将文本值设置为 AppResources 中的本地化字符串。
        //    ApplicationBarIconButton appBarButton = new ApplicationBarIconButton(new Uri("/Assets/AppBar/appbar.add.rest.png", UriKind.Relative));
        //    appBarButton.Text = AppResources.AppBarButtonText;
        //    ApplicationBar.Buttons.Add(appBarButton);

        //    // 使用 AppResources 中的本地化字符串创建新菜单项。
        //    ApplicationBarMenuItem appBarMenuItem = new ApplicationBarMenuItem(AppResources.AppBarMenuItemText);
        //    ApplicationBar.MenuItems.Add(appBarMenuItem);
        //}
    }
    //Create a model
    public class Model
    {
        public double X { get; set; }
        public double Y { get; set; }

        public Model(double x, double y)
        {
            X = x;
            Y = y;
        }
    }

    // Create a ViewModel
    public class ViewModel
    {
        public ObservableCollection<Model> Collection { get; set; }
        public ViewModel()
        {
            Collection = new ObservableCollection<Model>();
            GenerateDatas();
        }
        private void GenerateDatas()
        {
            this.Collection.Add(new Model(0, 1));
            this.Collection.Add(new Model(1, 2));
            this.Collection.Add(new Model(2, 3));
            this.Collection.Add(new Model(3, 4));
        }
    }
}
四、基于Silverlight的DataVisualization组件
4.1、MainPage页面
<phone:PhoneApplicationPage
xmlns="http://schemas.microsoft.com/winfx/2006/xaml/presentation"
xmlns:x="http://schemas.microsoft.com/winfx/2006/xaml"
xmlns:phone="clr-namespace:Microsoft.Phone.Controls;assembly=Microsoft.Phone"
xmlns:shell="clr-namespace:Microsoft.Phone.Shell;assembly=Microsoft.Phone"
xmlns:charting="clr-namespace:System.Windows.Controls.DataVisualization.Charting;assembly=System.Windows.Controls.DataVisualization.Toolkit"
xmlns:local="clr-namespace:WpCharts"
xmlns:d="http://schemas.microsoft.com/expression/blend/2008"
xmlns:mc="http://schemas.openxmlformats.org/markup-compatibility/2006"
xmlns:controls="clr-namespace:Microsoft.Phone.Controls;assembly=Microsoft.Phone.Controls"
x:Class="WpCharts.MainPage"
SupportedOrientations="PortraitOrLandscape"
Orientation="Portrait"
mc:Ignorable="d"
d:DesignWidth="480"
d:DesignHeight="800"
shell:SystemTray.IsVisible="False">
<phone:PhoneApplicationPage.Resources>
<!-- Data -->
<local:GradeOneDataProvider x:Key="GradeOneData"/>
<local:GradeTwoDataProvider x:Key="GradeTwoData"/>
</phone:PhoneApplicationPage.Resources>
<Grid>
<Grid.RowDefinitions>
<RowDefinition />
</Grid.RowDefinitions>
<!-- Title -->
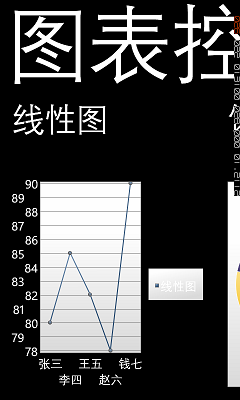
<controls:Panorama Background="Transparent" x:Name="Panorama" SelectionChanged="Panorama_SelectionChanged" FontSize="24" Title="图表控件" >
<controls:PanoramaItem Header="线性图">
<charting:Chart x:Name="LineSeriesChart" FontSize="24"/>
</controls:PanoramaItem>
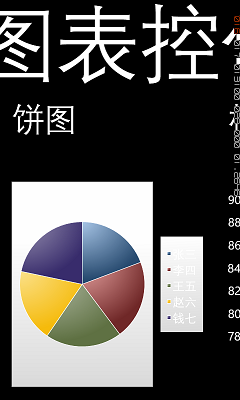
<controls:PanoramaItem Header="饼图">
<charting:Chart x:Name="PieSeriesChart" FontSize="24"/>
</controls:PanoramaItem>
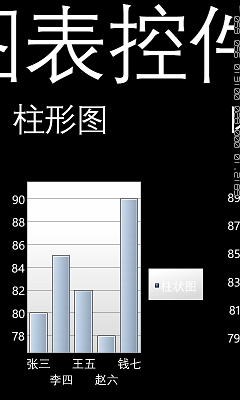
<controls:PanoramaItem Header="柱形图">
<charting:Chart x:Name="ColumnSeriesChart" FontSize="24"/>
</controls:PanoramaItem>
<controls:PanoramaItem Header="区域图">
<charting:Chart x:Name="AreaSeriesChart" FontSize="24"/>
</controls:PanoramaItem>
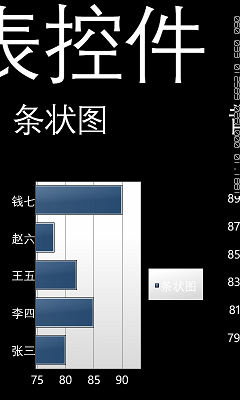
<controls:PanoramaItem Header="条状图">
<charting:Chart x:Name="BarSeriesChart" FontSize="24"/>
</controls:PanoramaItem>
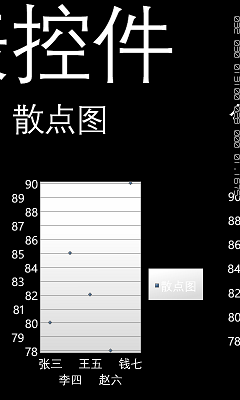
<controls:PanoramaItem Header="散点图">
<charting:Chart x:Name="ScatterSeriesChart" FontSize="24"/>
</controls:PanoramaItem>
<controls:PanoramaItem Header="气泡图">
<charting:Chart x:Name="BubbleSeriesChart" FontSize="24"/>
</controls:PanoramaItem>
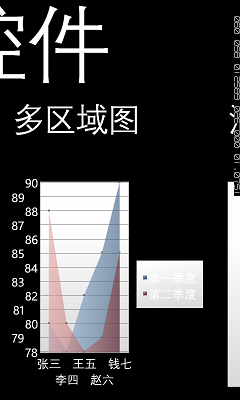
<controls:PanoramaItem Header="多区域图">
<charting:Chart x:Name="MutiAreaSeriesChart" FontSize="24">
<charting:Chart.Series>
<charting:AreaSeries Title="第一季度" ItemsSource="{Binding GradeOneData,Source={StaticResource GradeOneData}}" IndependentValueBinding="{Binding Name}" DependentValueBinding="{Binding Score}"/>
<charting:AreaSeries Title="第二季度" ItemsSource="{Binding GradeTwoData,Source={StaticResource GradeTwoData}}" IndependentValueBinding="{Binding Name}" DependentValueBinding="{Binding Score}"/>
</charting:Chart.Series>
</charting:Chart>
</controls:PanoramaItem>
<controls:PanoramaItem Header="混合图">
<charting:Chart x:Name="MixtureChart" FontSize="24"/>
</controls:PanoramaItem>
</controls:Panorama>
</Grid>
</phone:PhoneApplicationPage>4.2、后台
using System.Collections.Generic;
using System.Windows;
using System.Windows.Controls;
using Microsoft.Phone.Controls;
using System.Windows.Media;
using System.Windows.Controls.DataVisualization.Charting;


namespace WpCharts
{
    #region 静态绑定资源

    public class GradeOneDataProvider
    {
        public List<Students> GradeOneData
        {
            get
            {
                return new List<Students> {
                    new Students() { Name = "张三", Score = 80 },
                    new Students() { Name = "李四", Score = 78 },
                    new Students() { Name = "王五", Score = 82 },
                    new Students() { Name = "赵六", Score = 85 },
                    new Students() { Name = "钱七", Score = 90 }
                };
            }
        }
    }

    public class GradeTwoDataProvider
    {
        public List<Students> GradeTwoData
        {
            get
            {
                return new List<Students> {
                    new Students() { Name = "张三", Score = 88 },
                    new Students() { Name = "李四", Score = 80 },
                    new Students() { Name = "王五", Score = 78 },
                    new Students() { Name = "赵六", Score = 79 },
                    new Students() { Name = "钱七", Score = 85 }
                };
            }
        }
    }


    #endregion

    public class Students
    {
        public string Name { get; set; }
        public int Score { get; set; }
    }

    public partial class MainPage : PhoneApplicationPage
    {
        public MainPage()
        {
            InitializeComponent();
            this.Loaded += new RoutedEventHandler(MainPage_Loaded);
        }

        void MainPage_Loaded(object sender, RoutedEventArgs e)
        {
            //添加图表序列
            //线性图
            LineSeries LS = new LineSeries();
            LS.Title = "线性图";
            LS.ItemsSource = GetStudentsInfo();
            LS.IndependentValueBinding = new System.Windows.Data.Binding("Name");
            LS.DependentValueBinding = new System.Windows.Data.Binding("Score");

            //饼图
            PieSeries PS = new PieSeries();
            PS.Title = "饼图";
            PS.ItemsSource = GetStudentsInfo();
            PS.IndependentValueBinding = new System.Windows.Data.Binding("Name");
            PS.DependentValueBinding = new System.Windows.Data.Binding("Score");

            //柱状图
            ColumnSeries CS = new ColumnSeries();
            CS.Title = "柱状图";
            CS.ItemsSource = GetStudentsInfo();
            CS.IndependentValueBinding = new System.Windows.Data.Binding("Name");
            CS.DependentValueBinding = new System.Windows.Data.Binding("Score");

            //区域图
            AreaSeries AS = new AreaSeries();
            AS.Title = "区域图";
            AS.ItemsSource = GetStudentsInfo();
            AS.IndependentValueBinding = new System.Windows.Data.Binding("Name");
            AS.DependentValueBinding = new System.Windows.Data.Binding("Score");

            //条状图
            BarSeries BS = new BarSeries();
            BS.Title = "条状图";
            BS.ItemsSource = GetStudentsInfo();
            BS.IndependentValueBinding = new System.Windows.Data.Binding("Name");
            BS.DependentValueBinding = new System.Windows.Data.Binding("Score");

            //散点图
            ScatterSeries SS = new ScatterSeries();
            SS.Title = "散点图";
            SS.ItemsSource = GetStudentsInfo();
            SS.IndependentValueBinding = new System.Windows.Data.Binding("Name");
            SS.DependentValueBinding = new System.Windows.Data.Binding("Score");

            //气泡图
            BubbleSeries BUS = new BubbleSeries();
            BUS.Title = "气泡图";
            BUS.ItemsSource = GetStudentsInfo();
            BUS.IndependentValueBinding = new System.Windows.Data.Binding("Name");
            BUS.DependentValueBinding = new System.Windows.Data.Binding("Score");


            LineSeriesChart.Series.Add(LS);
            PieSeriesChart.Series.Add(PS);
            ColumnSeriesChart.Series.Add(CS);
            AreaSeriesChart.Series.Add(AS);
            BarSeriesChart.Series.Add(BS);
            ScatterSeriesChart.Series.Add(SS);
            BubbleSeriesChart.Series.Add(BUS);


        }

        //数据源1
        private List<Students> GetStudentsInfo()
        {
            List<Students> returnedValue = new List<Students>();
            returnedValue.Add(new Students() { Name = "张三", Score = 80 });
            returnedValue.Add(new Students() { Name = "李四", Score = 85 });
            returnedValue.Add(new Students() { Name = "王五", Score = 82 });
            returnedValue.Add(new Students() { Name = "赵六", Score = 78 });
            returnedValue.Add(new Students() { Name = "钱七", Score = 90 });
            return returnedValue;
        }

        //数据源2
        private List<Students> GetStudentsInfo2()
        {
            List<Students> returnedValue = new List<Students>();
            returnedValue.Add(new Students() { Name = "孙八", Score = 76 });
            returnedValue.Add(new Students() { Name = "牛久", Score = 88 });
            returnedValue.Add(new Students() { Name = "代十", Score = 91 });
            returnedValue.Add(new Students() { Name = "唐一", Score = 70 });
            returnedValue.Add(new Students() { Name = "丁二", Score = 62 });
            return returnedValue;
        }

        private void Panorama_SelectionChanged(object sender, SelectionChangedEventArgs e)
        {
            if (Panorama.SelectedIndex == 8)
            {
                MixtureChart.Series.Clear();
                //添加图表序列
                //线性图
                LineSeries LS = new LineSeries();
                LS.Title = "线性图";
                LS.ItemsSource = GetStudentsInfo();
                LS.IndependentValueBinding = new System.Windows.Data.Binding("Name");
                LS.DependentValueBinding = new System.Windows.Data.Binding("Score");

                //饼图
                PieSeries PS = new PieSeries();
                PS.Title = "饼图";
                PS.ItemsSource = GetStudentsInfo();
                PS.IndependentValueBinding = new System.Windows.Data.Binding("Name");
                PS.DependentValueBinding = new System.Windows.Data.Binding("Score");

                //柱状图
                ColumnSeries CS = new ColumnSeries();
                CS.Title = "柱状图";
                CS.ItemsSource = GetStudentsInfo();
                CS.IndependentValueBinding = new System.Windows.Data.Binding("Name");
                CS.DependentValueBinding = new System.Windows.Data.Binding("Score");

                //区域图
                AreaSeries AS = new AreaSeries();
                AS.Title = "区域图";
                AS.ItemsSource = GetStudentsInfo();
                AS.IndependentValueBinding = new System.Windows.Data.Binding("Name");
                AS.DependentValueBinding = new System.Windows.Data.Binding("Score");

                //条状图
                BarSeries BS = new BarSeries();
                BS.Title = "条状图";
                BS.ItemsSource = GetStudentsInfo();
                BS.IndependentValueBinding = new System.Windows.Data.Binding("Name");
                BS.DependentValueBinding = new System.Windows.Data.Binding("Score");

                //散点图
                ScatterSeries SS = new ScatterSeries();
                SS.Title = "散点图";
                SS.ItemsSource = GetStudentsInfo();
                SS.IndependentValueBinding = new System.Windows.Data.Binding("Name");
                SS.DependentValueBinding = new System.Windows.Data.Binding("Score");

                //气泡图
                BubbleSeries BUS = new BubbleSeries();
                BUS.Title = "气泡图";
                BUS.ItemsSource = GetStudentsInfo();
                BUS.IndependentValueBinding = new System.Windows.Data.Binding("Name");
                BUS.DependentValueBinding = new System.Windows.Data.Binding("Score");

                MixtureChart.Series.Add(LS);
                MixtureChart.Series.Add(PS);
                MixtureChart.Series.Add(CS);
                MixtureChart.Series.Add(AS);
                MixtureChart.Series.Add(BS);
                MixtureChart.Series.Add(SS);
                MixtureChart.Series.Add(BUS);

                //MixtureChart.Series.Add(LS);
                //MixtureChart.Series.Add(CS);
                //MixtureChart.Series.Add(AS);
                //MixtureChart.Series.Add(SS);
            }
        }
    }
}
4.3、效果


 1401
1401

 被折叠的 条评论
为什么被折叠?
被折叠的 条评论
为什么被折叠?
 到【灌水乐园】发言


