


 本文通过实例演示了如何使用R语言中的ggplot2包绘制带有线性回归拟合曲线的散点图,并展示了如何调整拟合公式以实现不同的回归曲线。
目的:使用geom_smooth来画曲线拟合图
R代码:
#!/usr/bin/Rscript
##Reference:
#http://stackoverflow.com/questions/1476185/how-to-overlay-a-line-for-an-lm-object-on-a-ggplot2-scatterplot
library(ggplot2)
N = 300
x=1:N+rnorm(N, 10, 60)
y=1:N+rnorm(N, 10, 60)
colour=sample(c('red','blue'), N, replace=TRUE)
df = data.frame(x=x, y=y, colour=colour)
##
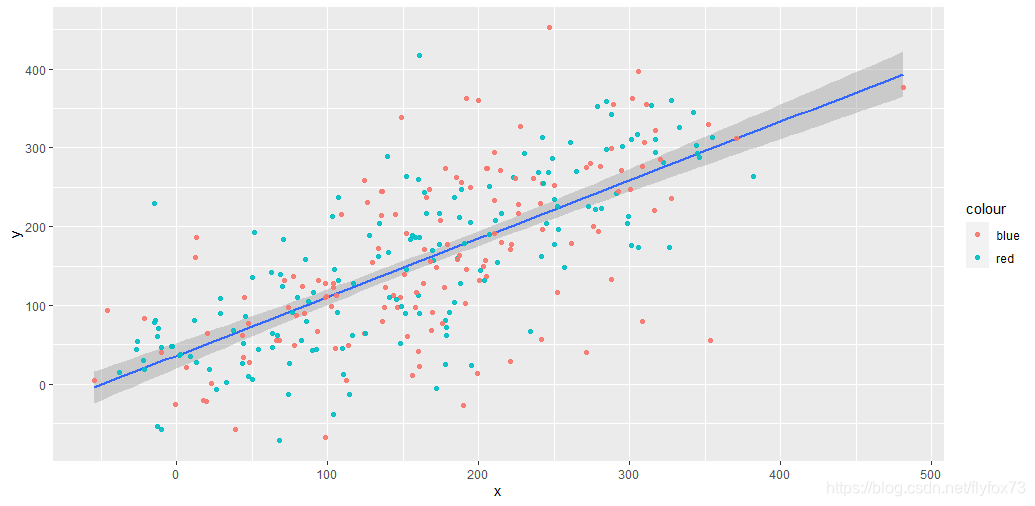
g1=ggplot(df)+geom_smooth(aes(x=x,y=y),method='lm')+geom_point(data=df, aes(x=x,y=y, colour=colour), alpha=.9)
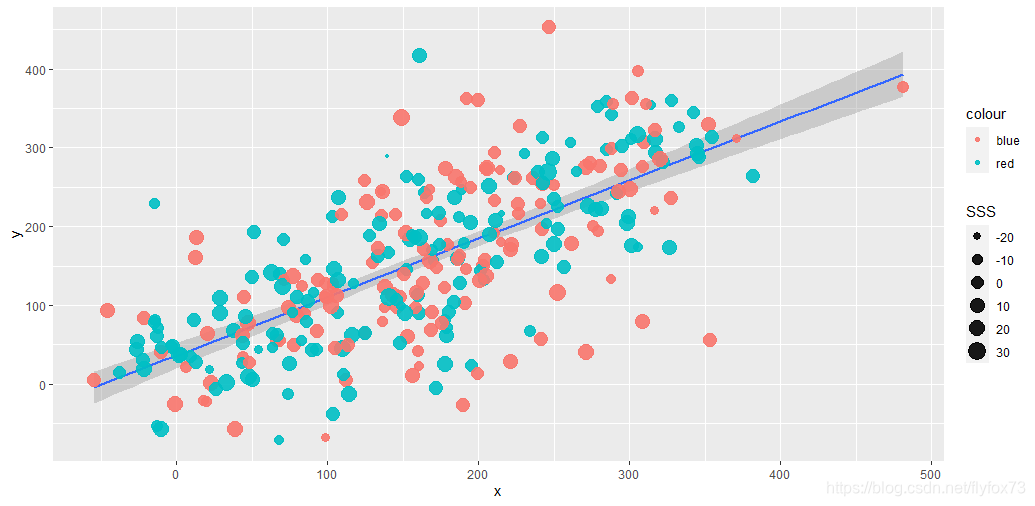
SSS= rnorm(N, 4, 10)
ggplot(df)+geom_smooth(aes(x=x,y=y),method='lm')+geom_point(data=df, aes(x=x,y=y, colour=colour,size=SSS),alpha=.9)
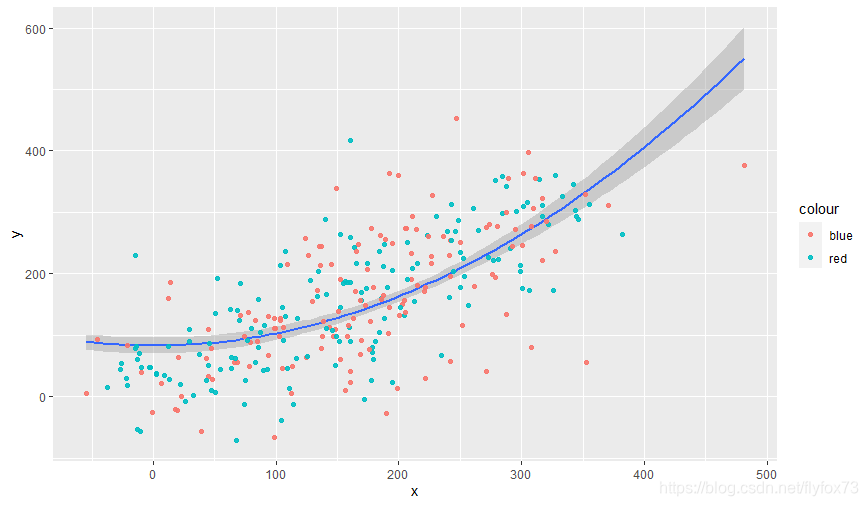
## You can provide a formula for regression
g2=ggplot(df)+geom_smooth(aes(x=x,y=y),method='lm', formula=y~I(x*x))+geom_point(data=df, aes(x=x,y=y, colour=colour), alpha=.9)
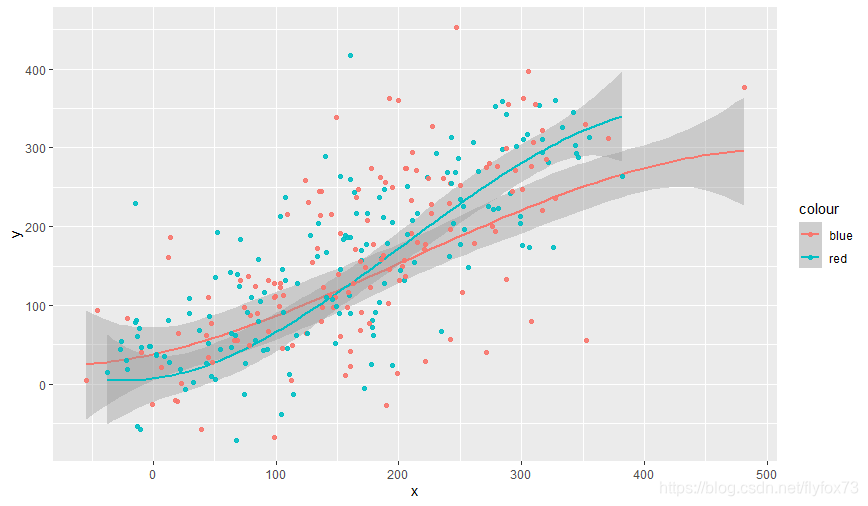
## Provide an arbitrary formula for regressing
g3=ggplot(df)+geom_smooth(aes(x=x,y=y, colour=colour),method='lm', formula=y~I(poly(x,3)))+geom_point(data=df, aes(x=x,y=y, colour=colour), alpha=.9)


 892
892

 被折叠的 条评论
为什么被折叠?
被折叠的 条评论
为什么被折叠?
 到【灌水乐园】发言


