


copy: http://www.brendangregg.com/linuxperf.html
Linux Performance
hi-res: observability + static + perf-tools/bcc (svg)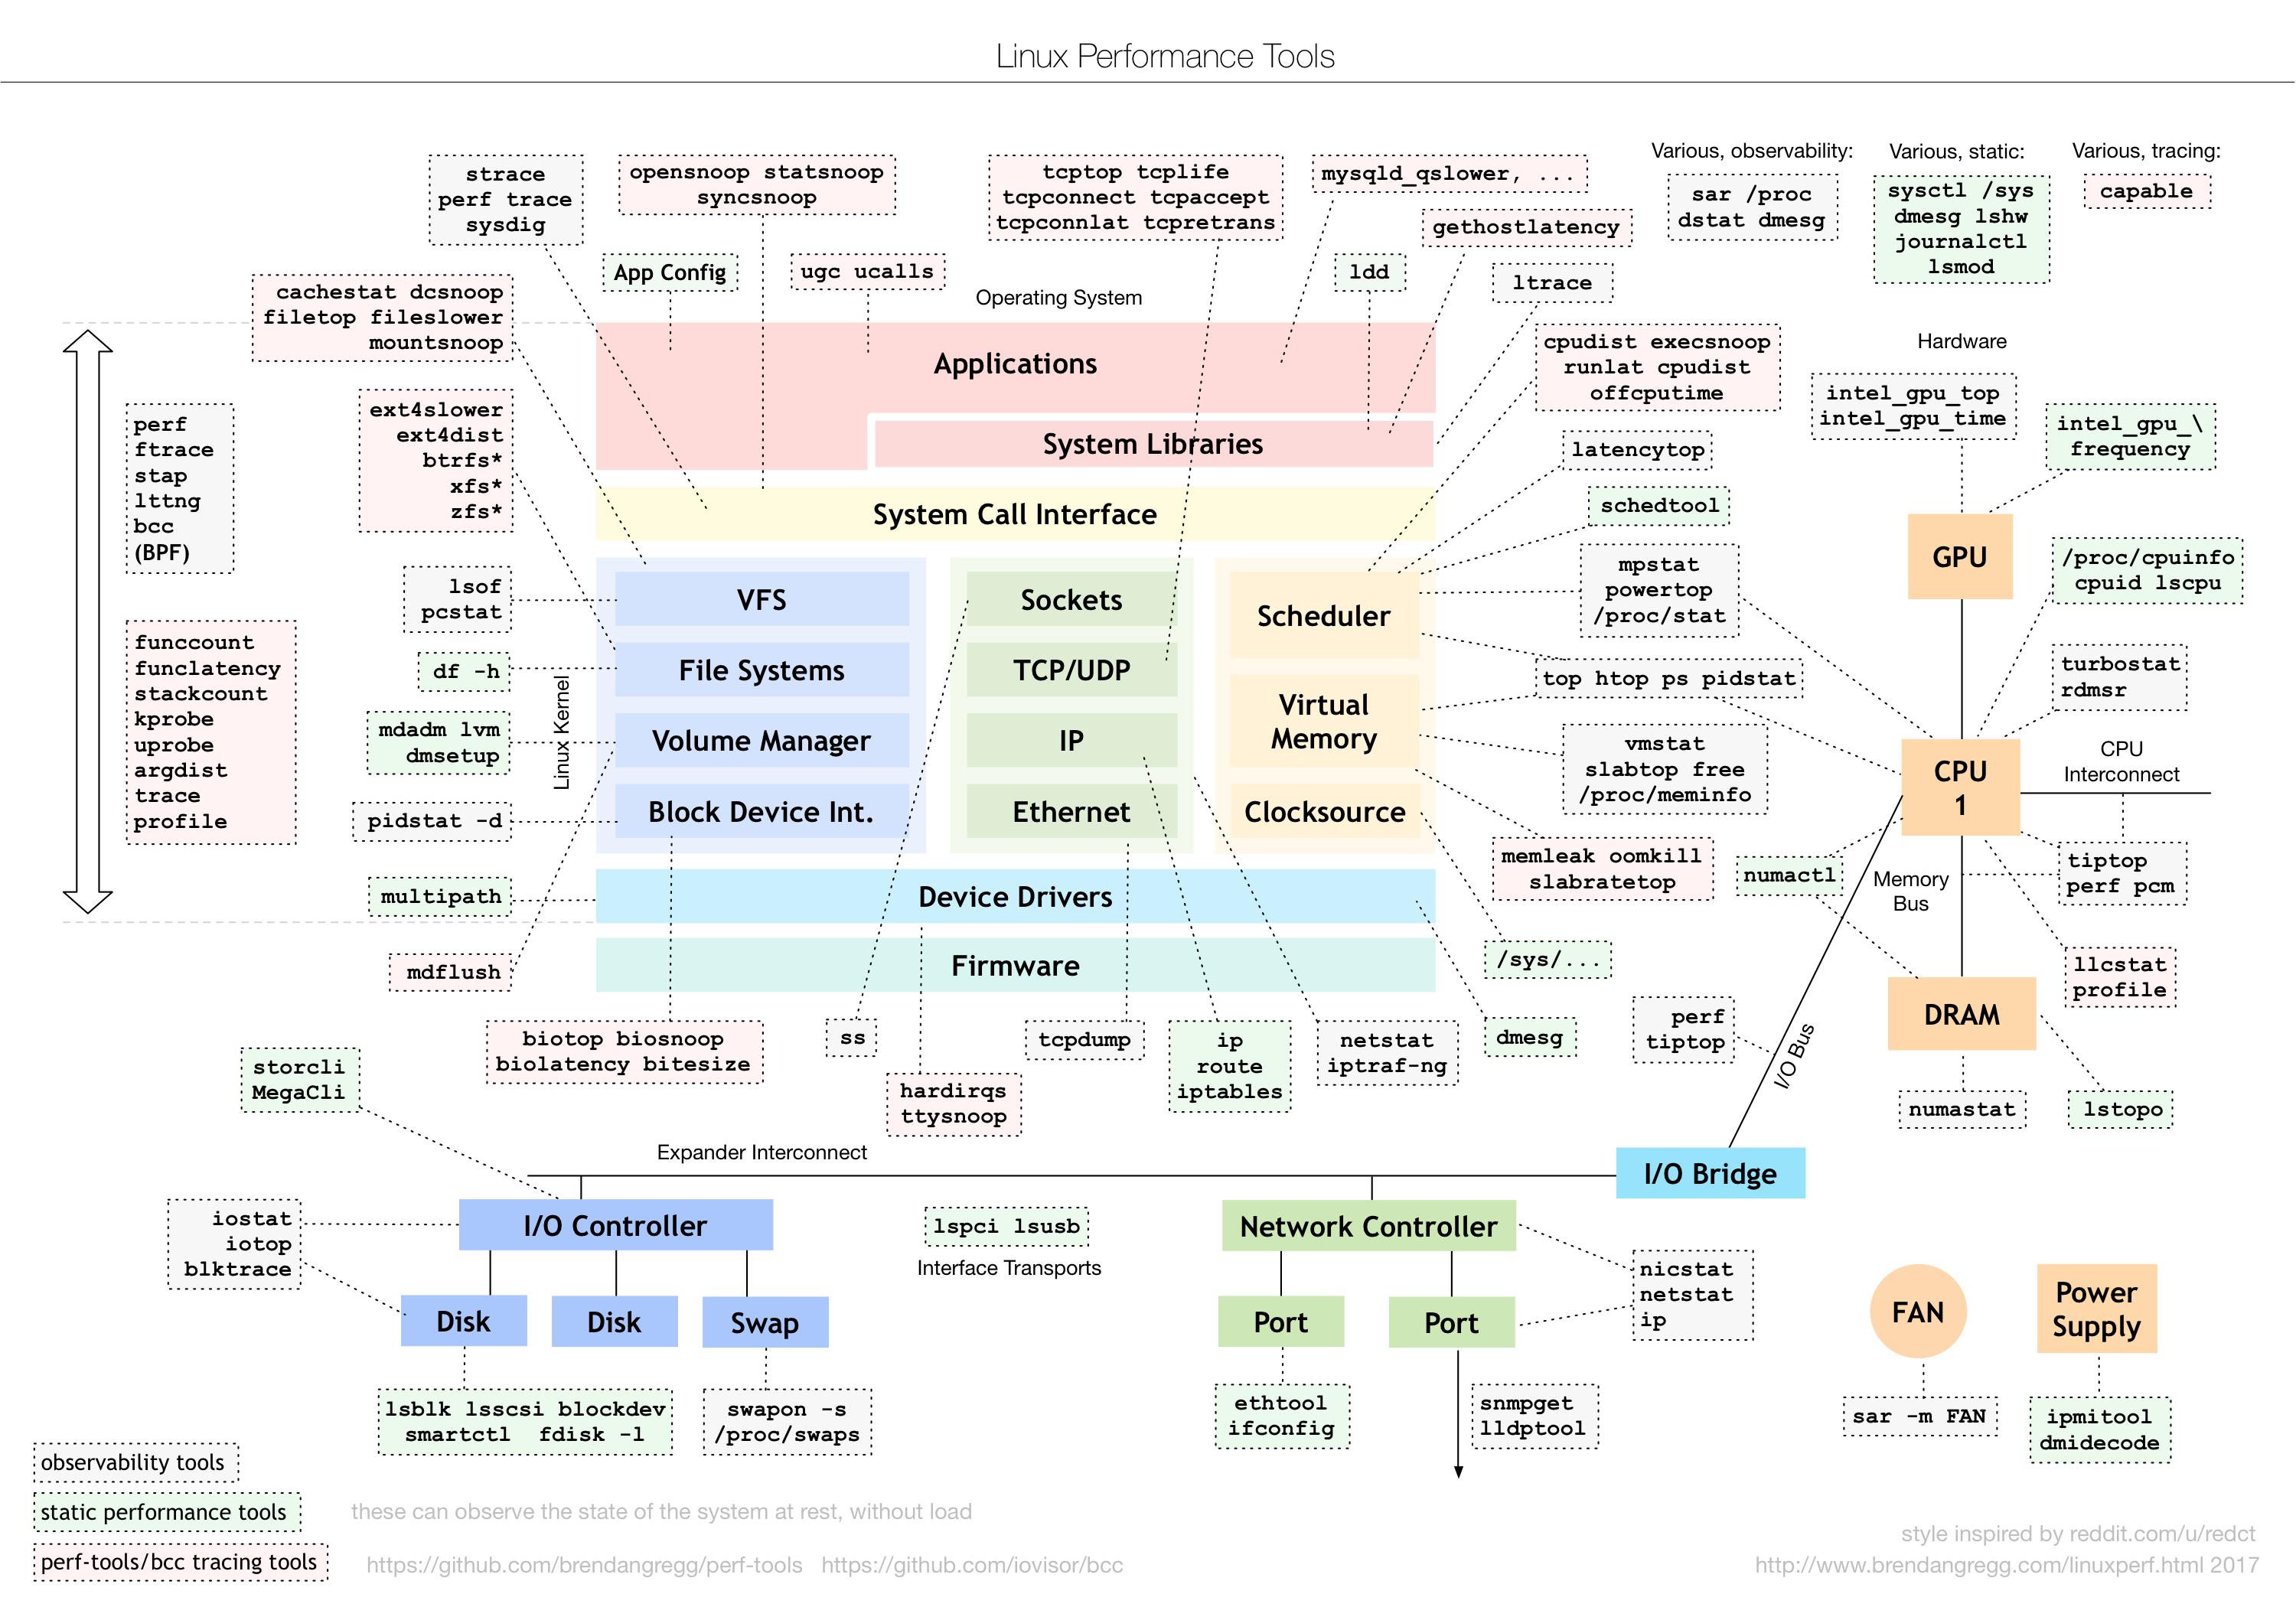
slides: observability
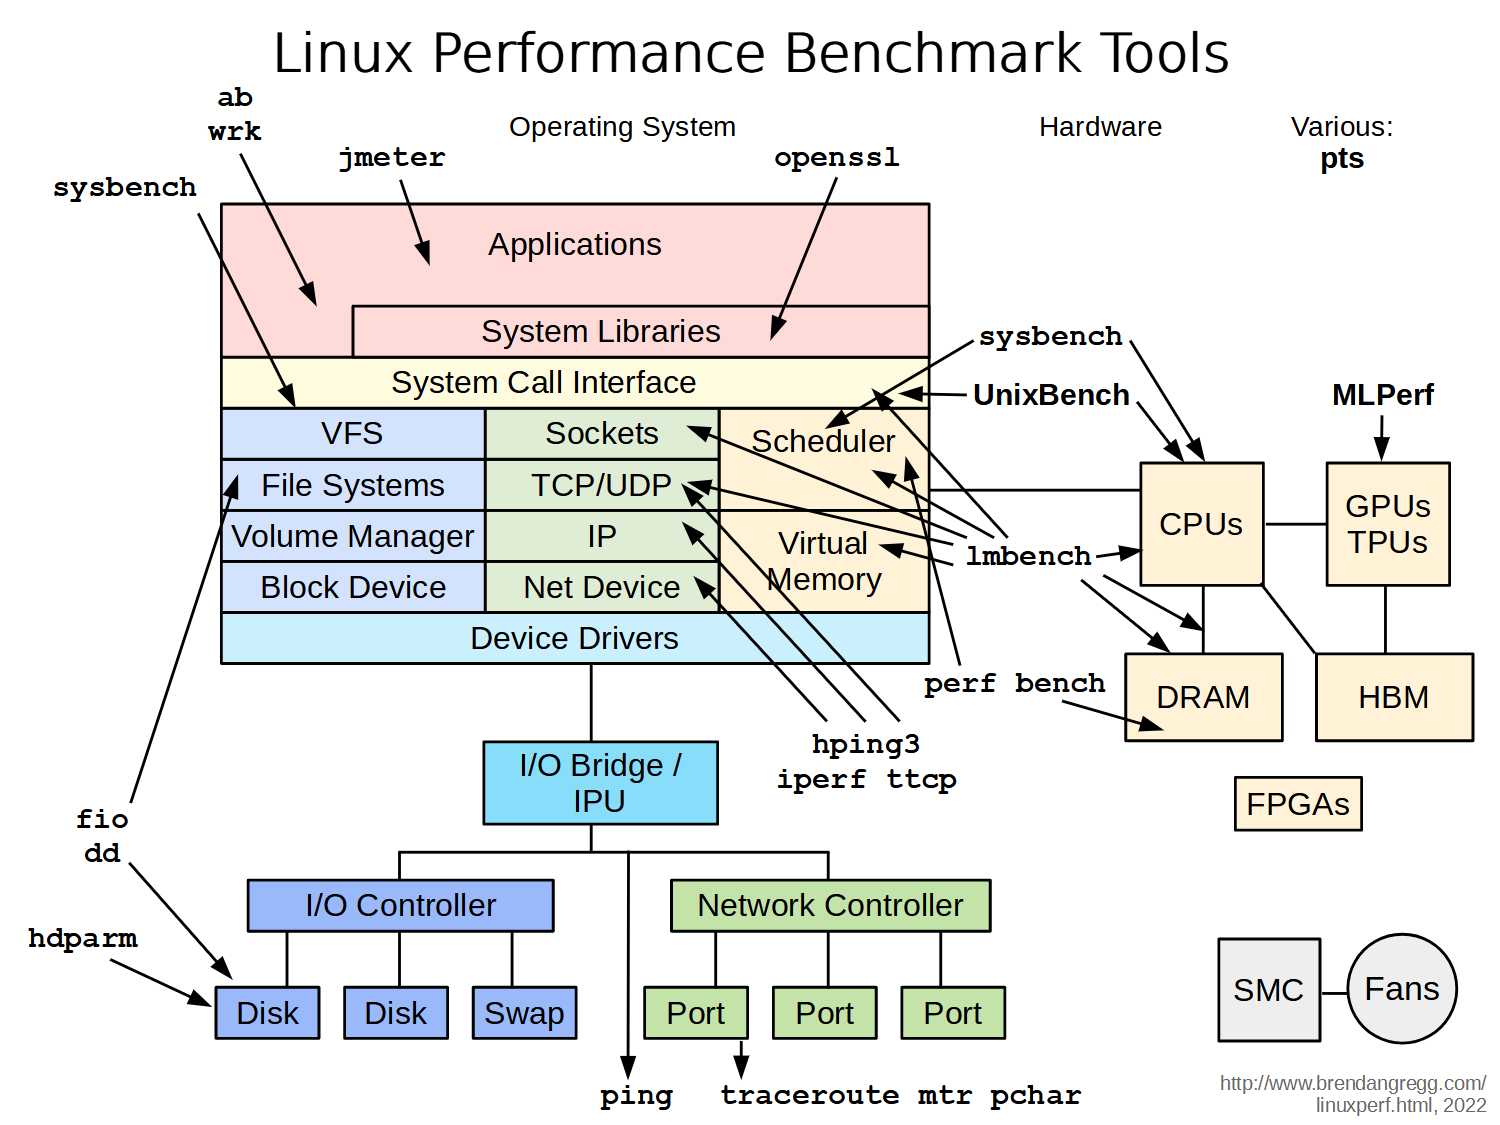
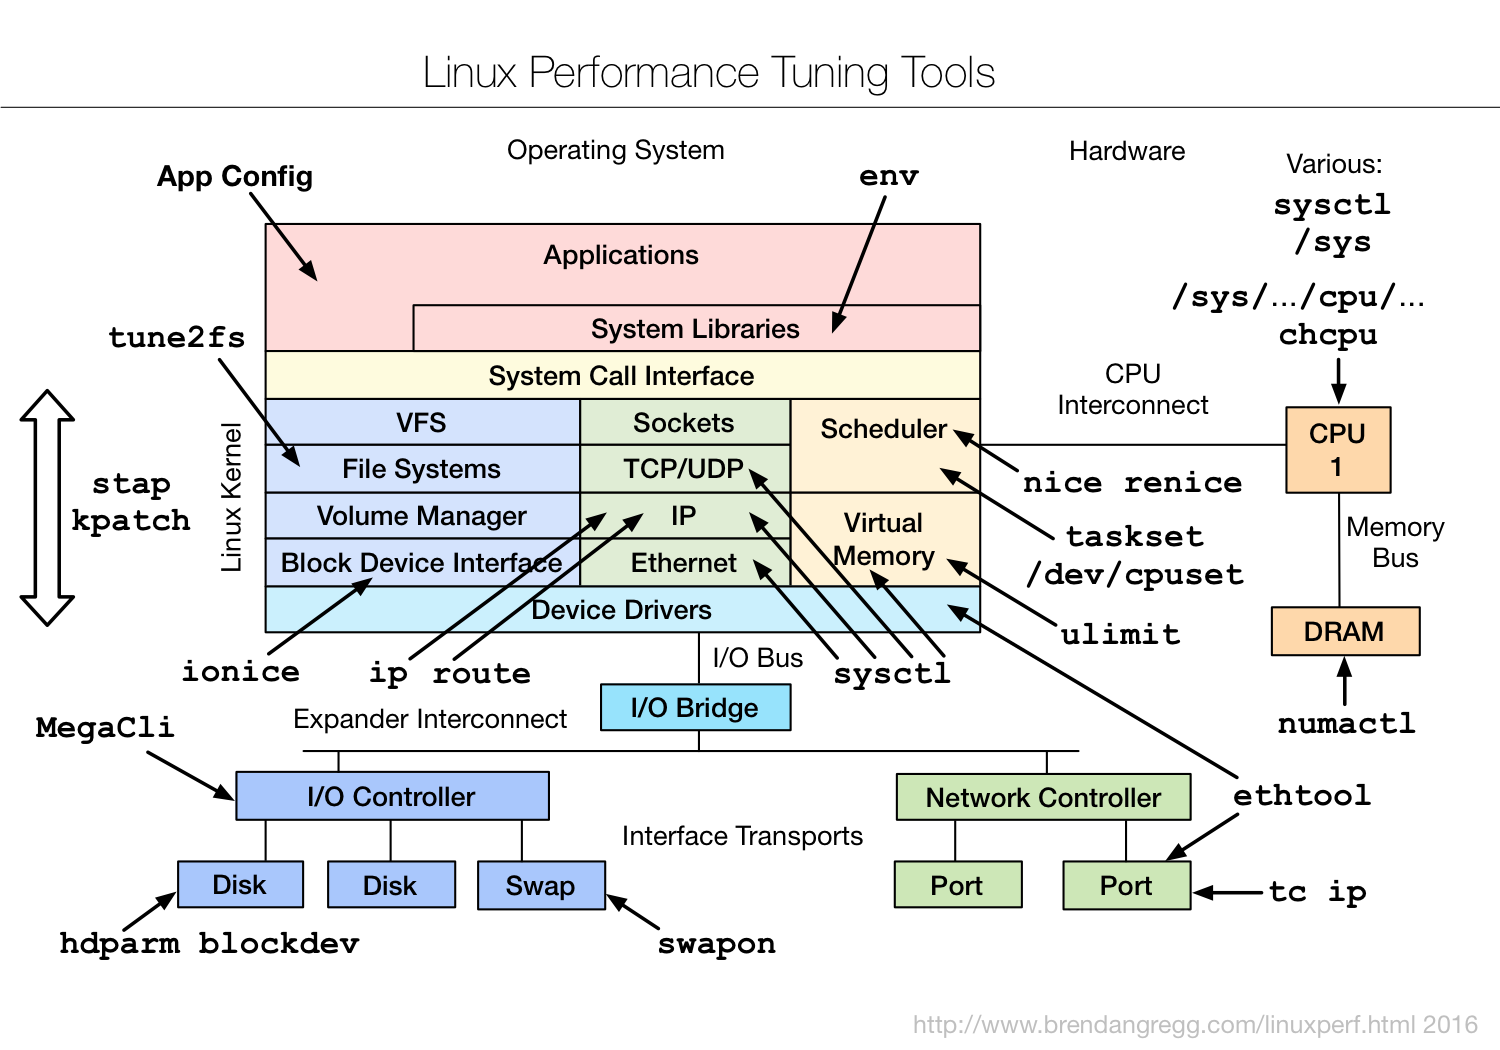
slides: static, benchmarking, tuning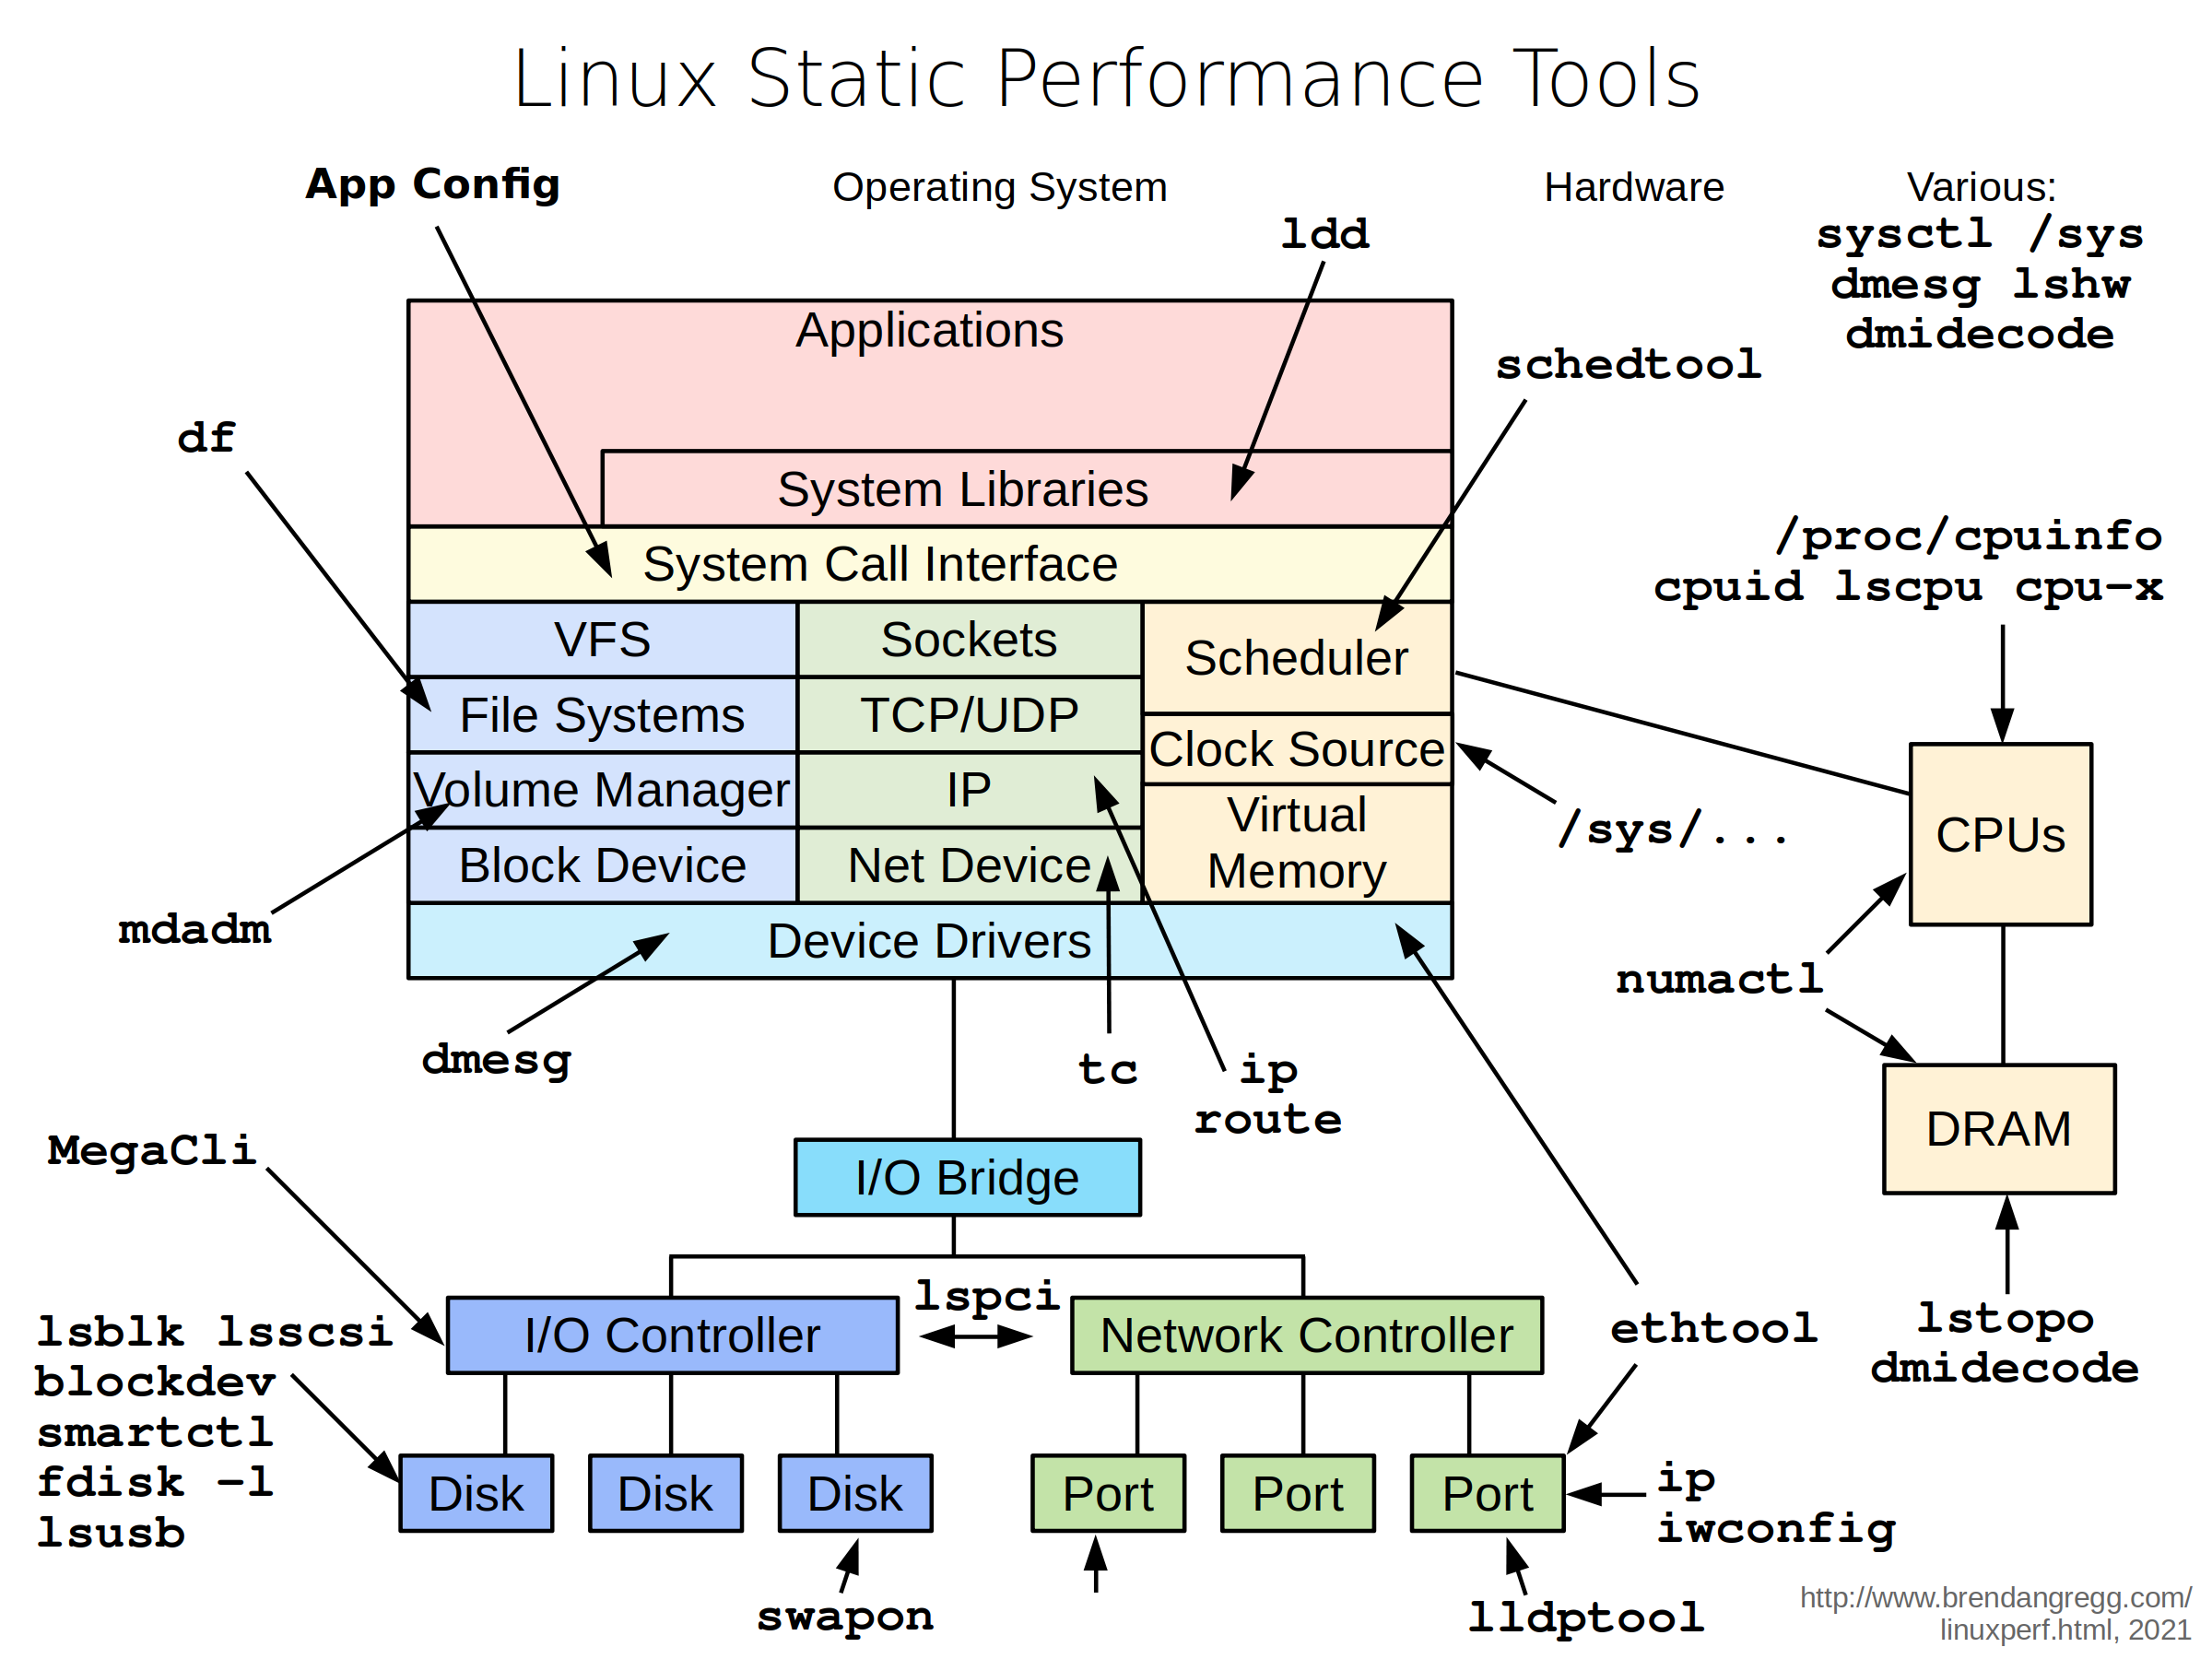
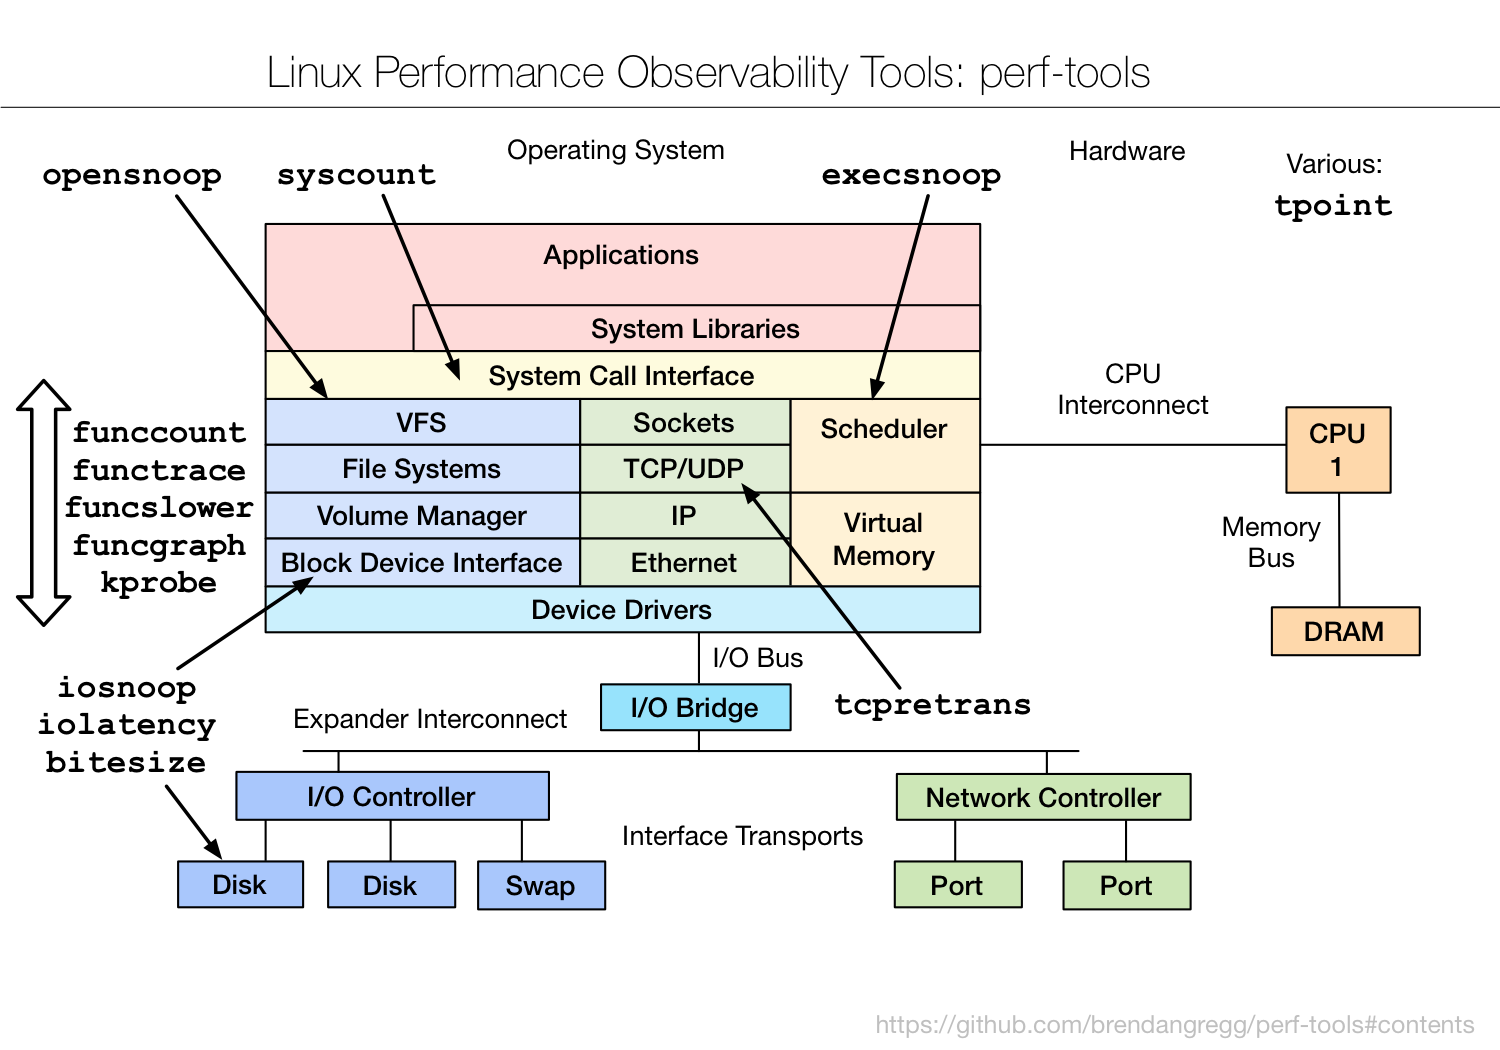
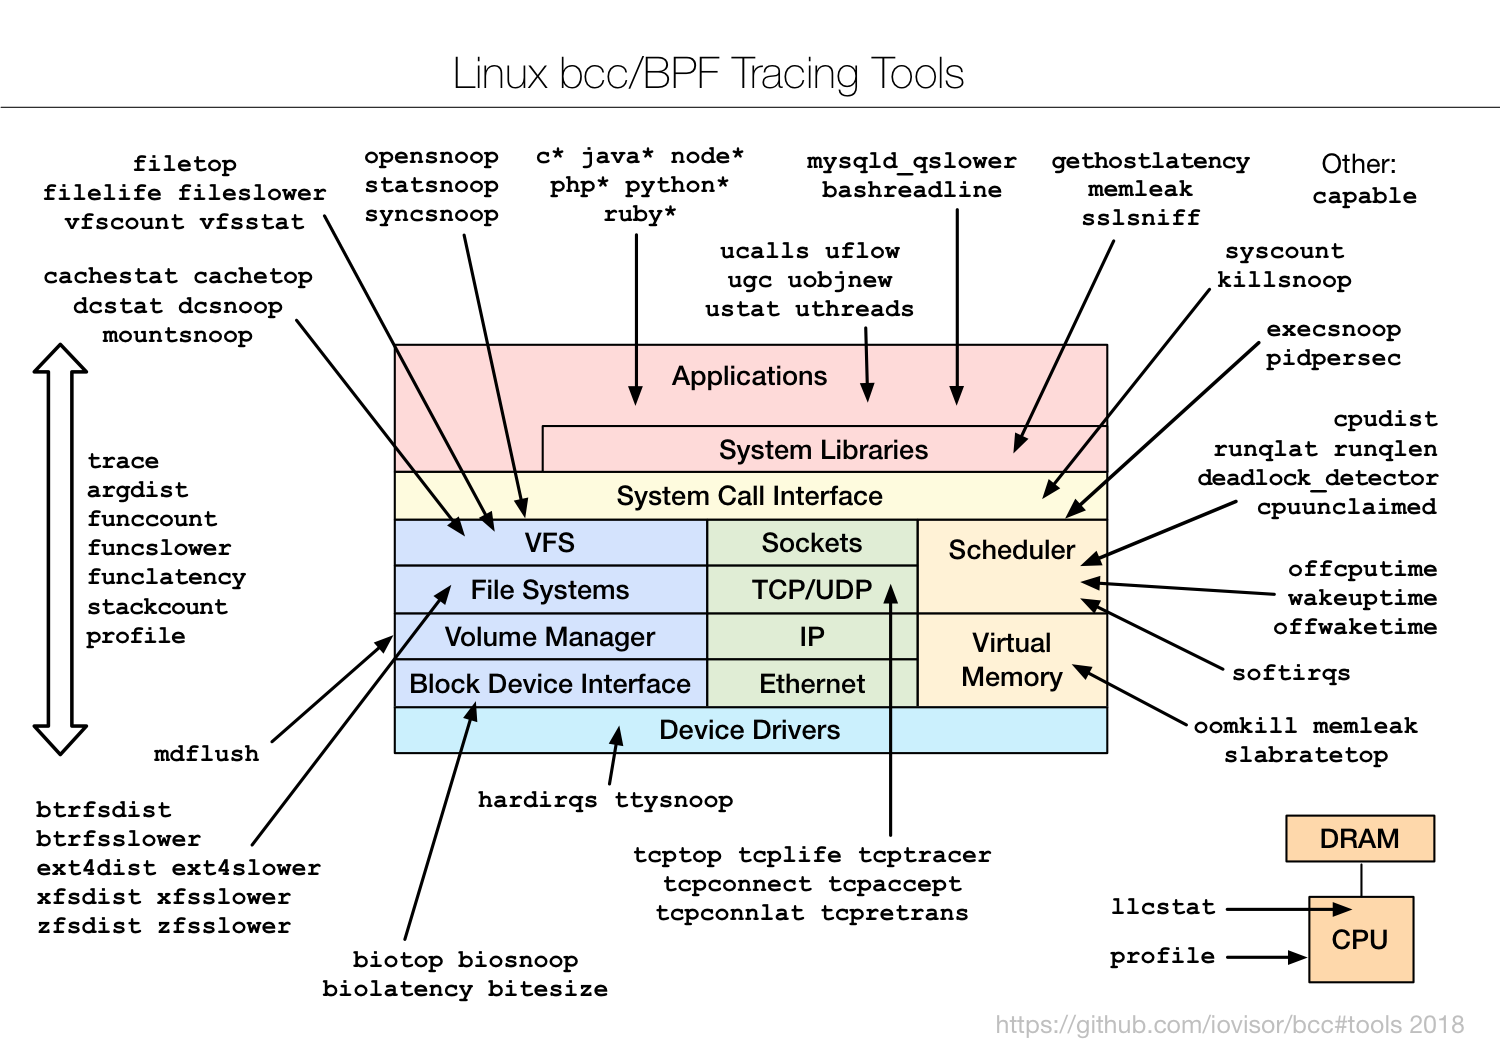
sar, perf-tools, bcc/BPF: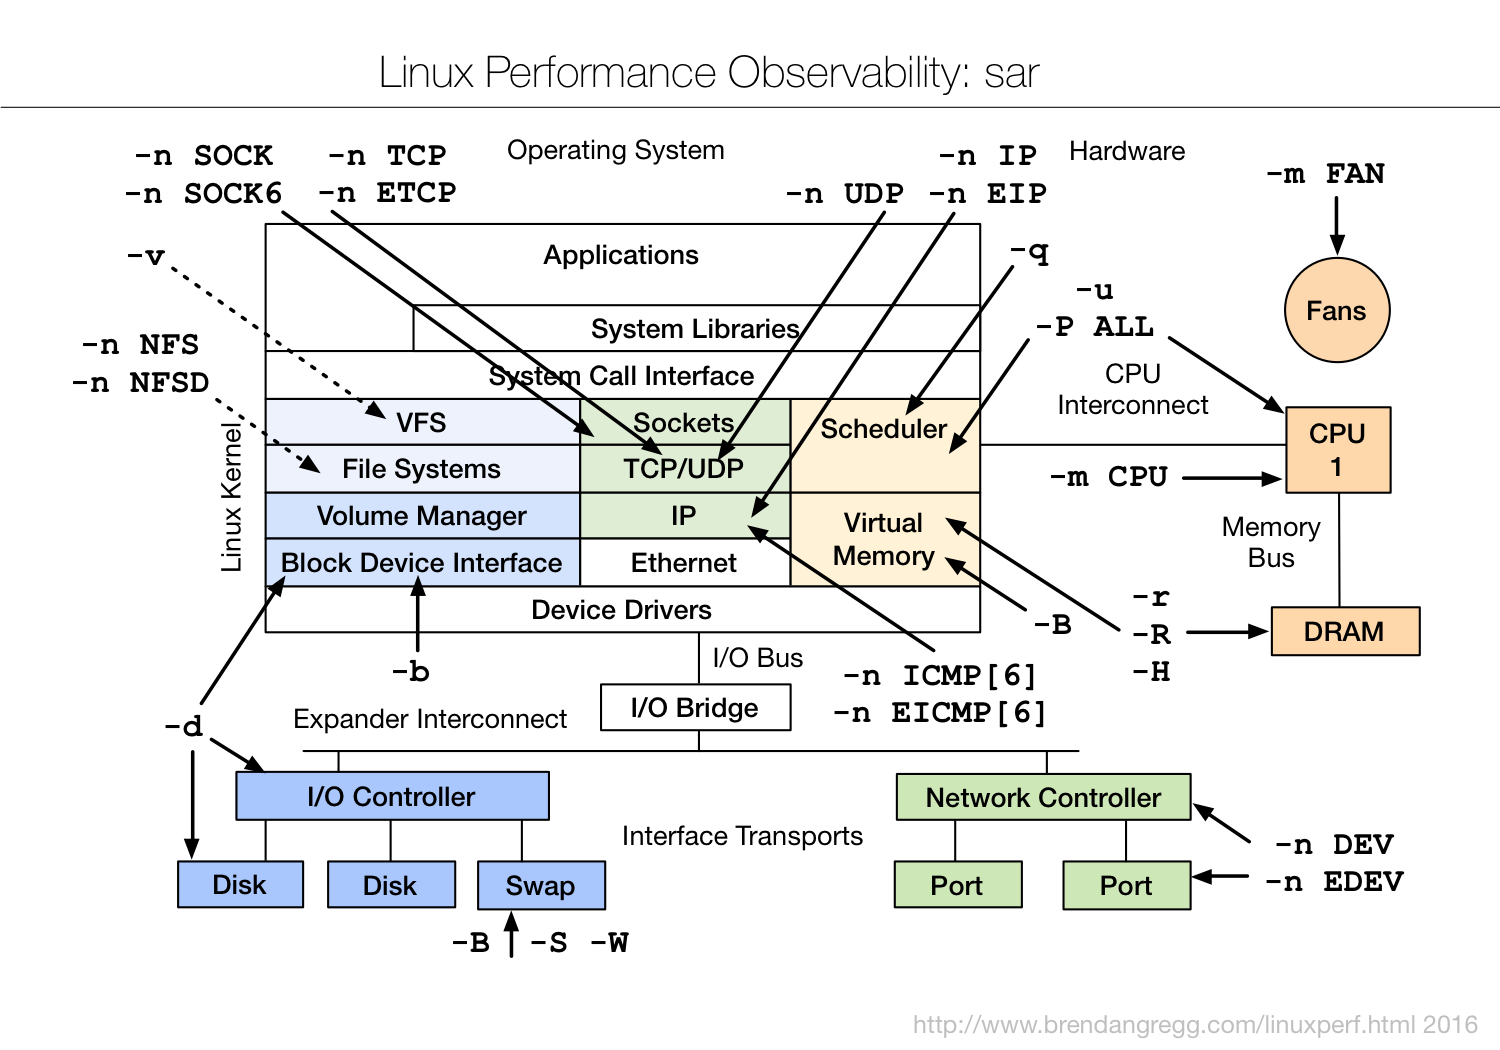
Images license: creative commons Attribution-ShareAlike 4.0.
This page links to various Linux performance material I've created, including the tools maps on the right. The first is a hi-res version combining observability, static performance tuning, and perf-tools/bcc (see discussion). The remainder were designed for use in slide decks and have larger fonts and arrows, and show: Linux observability tools, Linux benchmarking tools, Linux tuning tools, and Linux sar. For even more diagrams, see my slide decks below.
Tools
- perf_events: perf one-liners, examples, visualizations.
- eBPF tools: eBPF tracing tools and examples with bcc.
- perf-tools: perf analysis tools using ftrace (github).
- bcc: perf analysis tools using eBPF (github).
- ktap: one-liners, examples, and scripts.
- Flame Graphs: using perf, SystemTap, and ktap.
Documentation
- Linux Performance Analysis in 60,000 Milliseconds shows the first ten commands to use in an investigation (video, PDF). Written by myself and the performance engineering team at Netflix (2015).
- My post Performance Tuning Linux Instances on EC2 includes the tunables we're using at Netflix (2015).
- A post on Linux Load Averages: Solving the Mystery, explaining what they are and why they include the uninterruptible sleep state (2017).
- A gdb Debugging Full Example (Tutorial), including the use of some perf/debugging tools (2016).
- Generating flame graphs on Linux using perf & eBPF:
- Posts about eBPF, bcc, and bpftrace (2015-8):
- Linux eBPF (2015)
bcc: Taming Linux 4.3+ Tracing Superpowers
tcpconnect and tcpaccept for Linux (bcc)
Linux eBPF Stack Trace Hack (bcc) (2016)
Linux eBPF Off-CPU Flame Graph (bcc)
Linux Wakeup and Off-Wake Profiling (bcc)
Linux chain graph prototype (bcc)
Linux eBPF/bcc uprobes
Linux BPF/bcc Road Ahead
Ubuntu Xenial bcc/BPF
Linux bcc/BPF Tracing Security Capabilities
Linux MySQL Slow Query Tracing with bcc/BPF
Linux bcc/BPF ext4 Latency Tracing
Linux bcc/BPF Run Queue (Scheduler) Latency
Linux bcc/BPF Node.js USDT Tracing
Linux bcc tcptop
Linux 4.9's Efficient BPF-based Profiler
DTrace for Linux 2016
Linux 4.x Tracing Tools: Using BPF Superpowers
Linux bcc/BPF tcplife: TCP Lifespans
Golang bcc/BPF Function Tracing (2017)
7 BPF tools for performance analysis on Fedora
TCP Tracepoints (2018)
Linux bcc/eBPF tcpdrop
bpftrace (DTrace 2.0) for Linux 2018
- Linux eBPF (2015)
- My lwn.net article Ftrace: The Hidden Light Switch shows a use case for Linux ftrace (Aug, 2014).
- Posts about ftrace-based perf-tools (2014-5):
- Posts about perf-based perf-tools: perf Hacktogram.
- Posts about perf_events (2014-7):
- A page on Working Set Size Estimation for Linux (2018+).
- A post on KPTI/KAISER Meltdown Initial Performance Regressions (2018).
- In The PMCs of EC2: Measuring IPC I showed the new Performance Monitoring Counter (PMC) support in the AWS EC2 cloud (2017).
- CPU Utilization is Wrong: a post explaining the growing problem of memory stall cycles dominating the %CPU metric (2017).
- A post about Linux 4.7 Hist Triggers (2016).
- The blog post strace Wow Much Syscall discusses strace(1) for production use, and compares it to advanced tracing tools (2014).
- USE Method: Linux Performance Checklist; also see the USE Method page for the description of this methodology.
- Off-CPU Analysis Method, where I demonstrate this methodology on Linux.
- Systems Performance: Enterprise and the Cloud (Prentice Hall, 2013) uses Linux distributions as the primary example.


 351
351


 被折叠的 条评论
为什么被折叠?
被折叠的 条评论
为什么被折叠?
 到【灌水乐园】发言


