


Linux 平台上的性能工具有很多,眼花缭乱,长期的摸索和经验发现最好用的还是那些久经考验的、简单的小工具。系统性能专家 Brendan D. Gregg 在最近的 LinuxCon NA 2014 大会上更新了他那个有名的关于 Linux 性能方面的 talk (Linux Performance Tools) 和幻灯片。
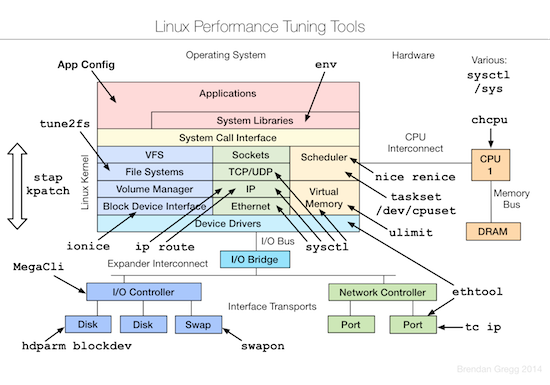
和 Brendan 去年的 talk 比较,今年增加了测试和优化两部分。下面的三张图片分别总结了 Linux 各个子系统以及监控、测试、优化这些子系统所用到的工具。
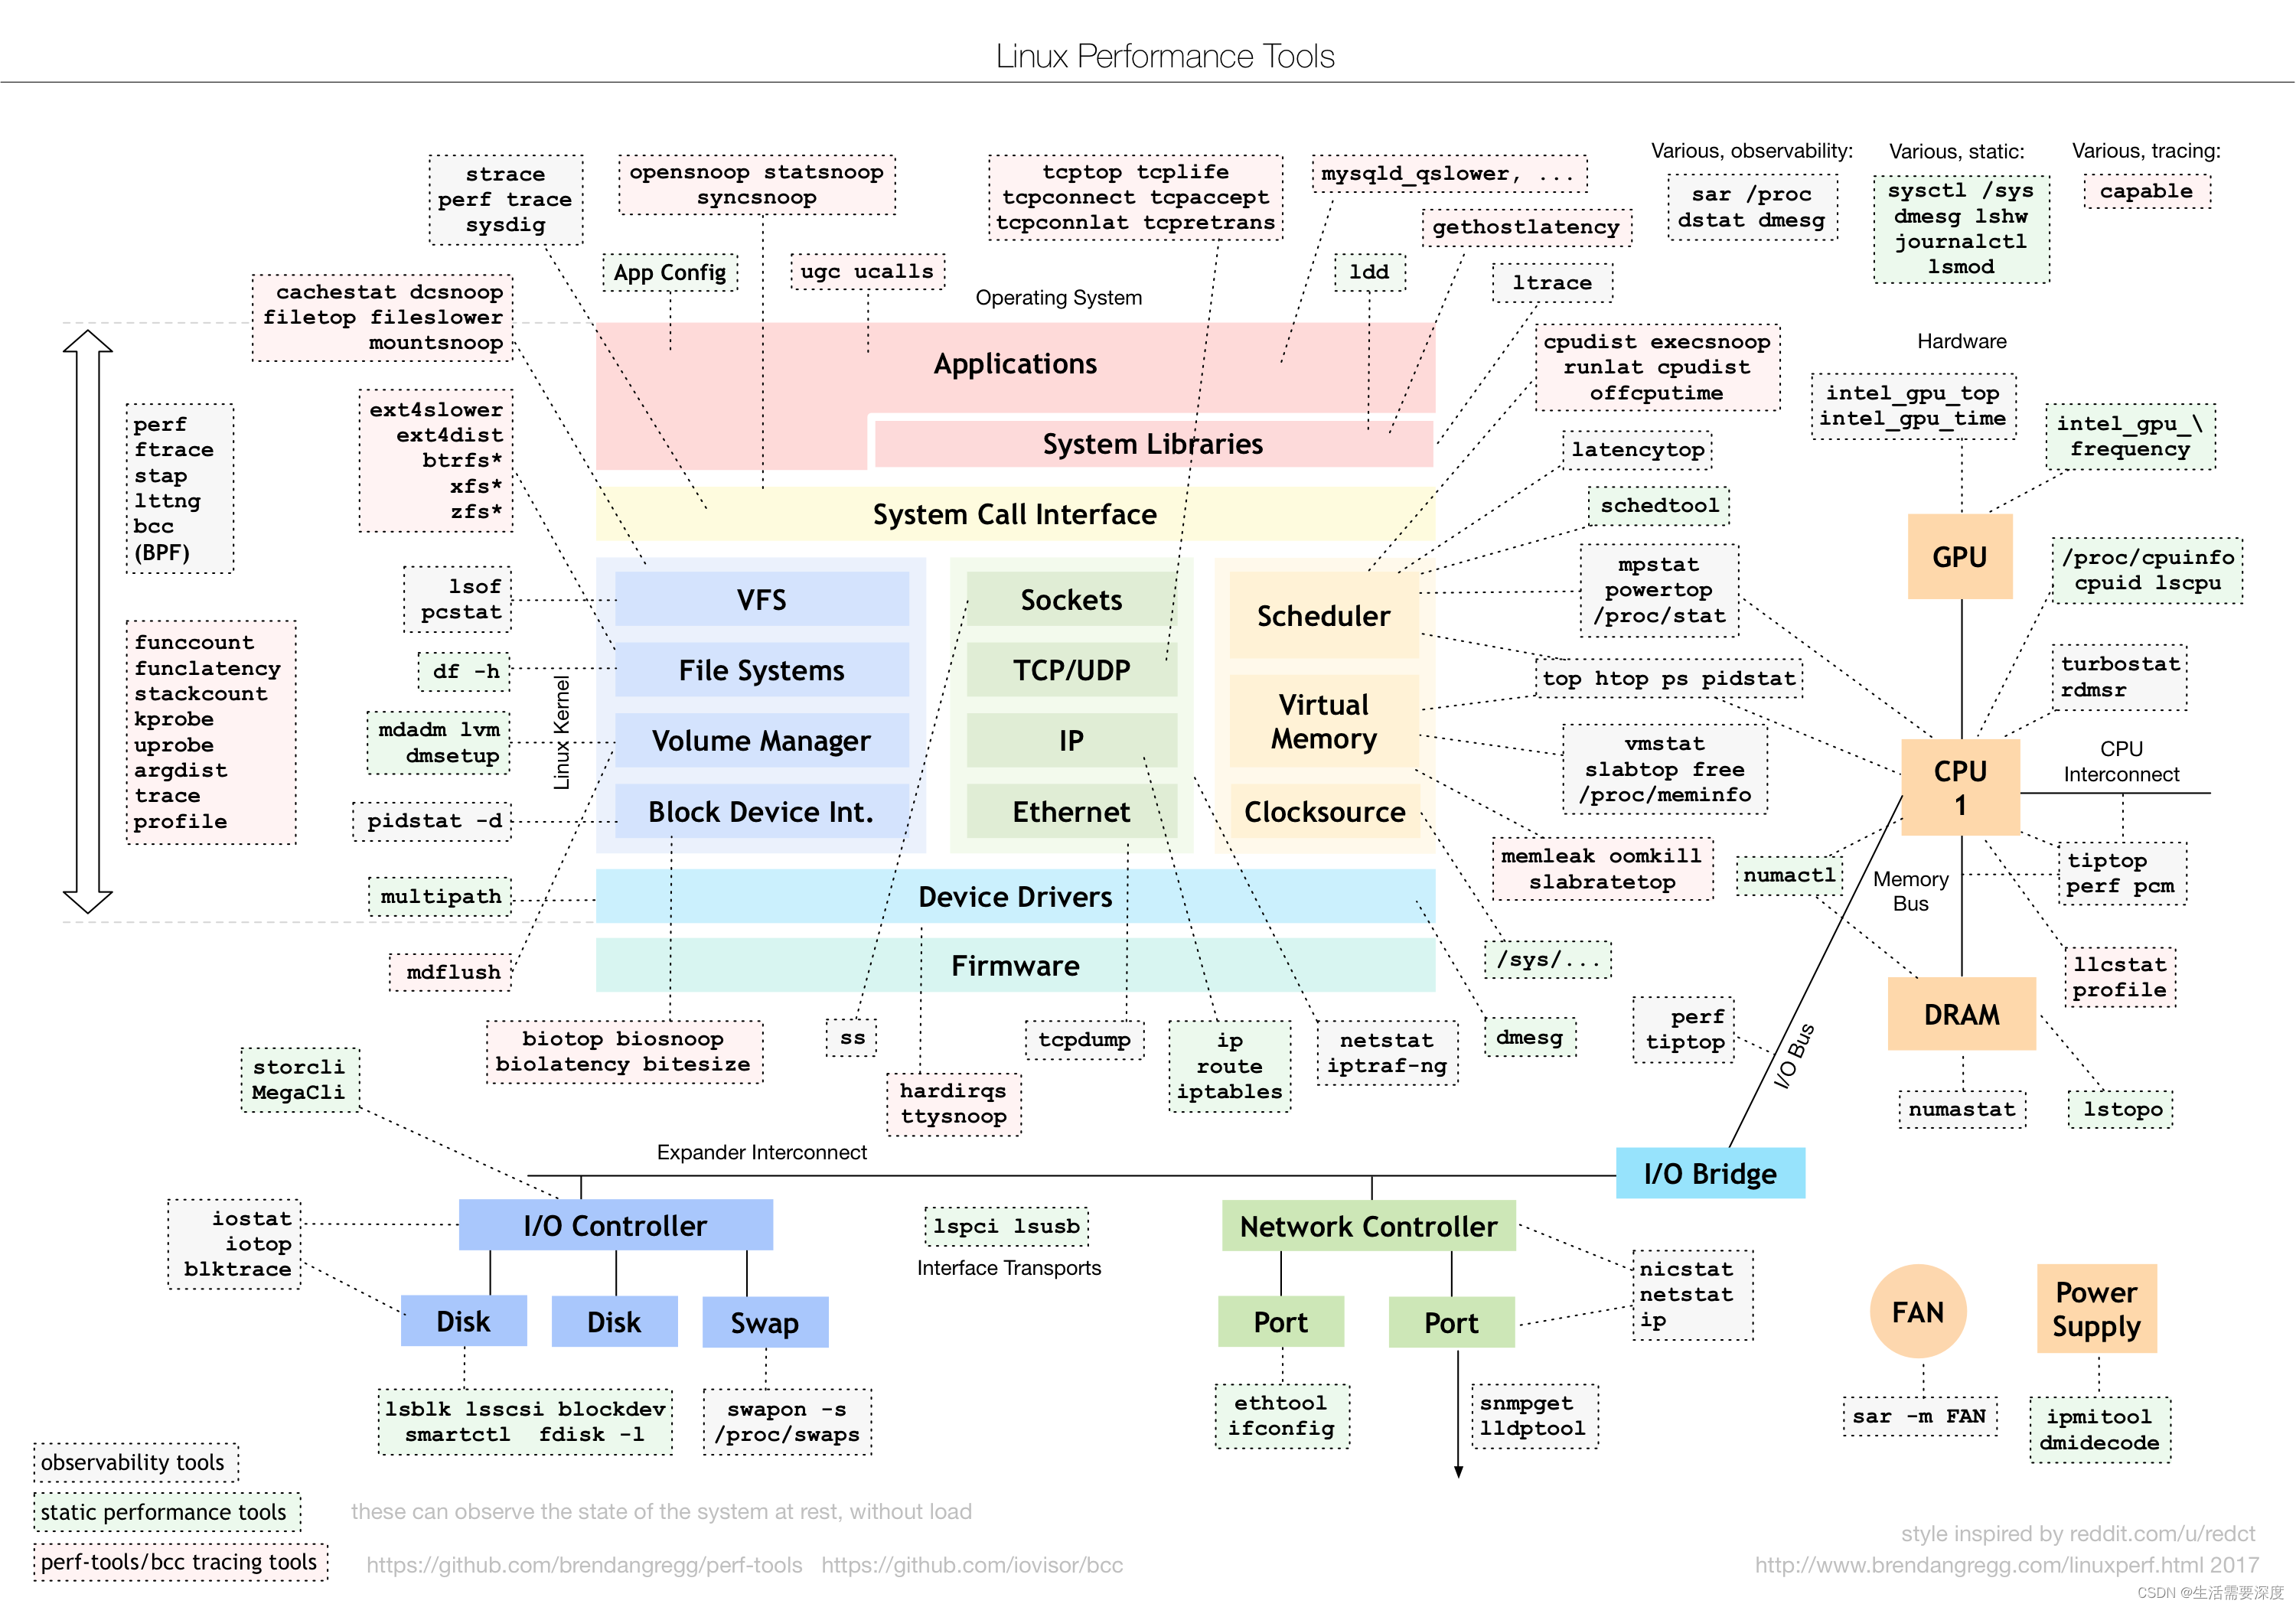
监控
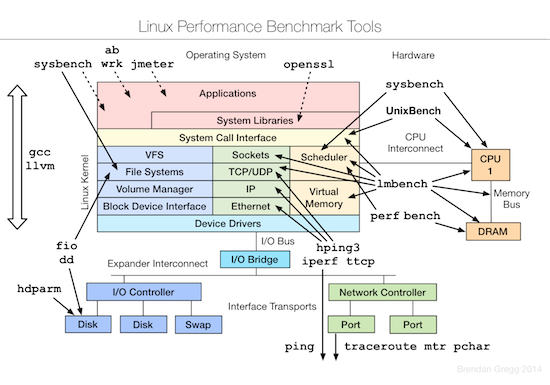
测试

优化
文章知识点与官方知识档案匹配,可进一步学习相关知识
经典链接1:20 Command Line Tools to Monitor Linux Performance
20 Command Line Tools to Monitor Linux Performance
Ravi SaiveAugust 6, 2021 CategoriesLinux Commands, Monitoring Tools 119 Comments
It’s really a very tough job for every System or Network administrator to monitor and debug Linux System Performance problems every day.
After being a Linux Administrator for 10 years in the IT industry, I came to know that how hard is to monitor and keep systems up and running.
For this reason, we’ve compiled the list of Top 20 frequently used command line monitoring tools that might be useful for every Linux/Unix System Administrator.
[ You might also like: 16 Useful Bandwidth Monitoring Tools to Analyze Network Usage in Linux ]
These commands are available under all flavors of Linux and can be useful to monitor and find the actual causes of performance problems. This list of commands shown here is very enough for you to pick the one that is suitable for your monitoring scenario.
Linux Command Line Monitoring
1. Top – Linux Process Monitoring
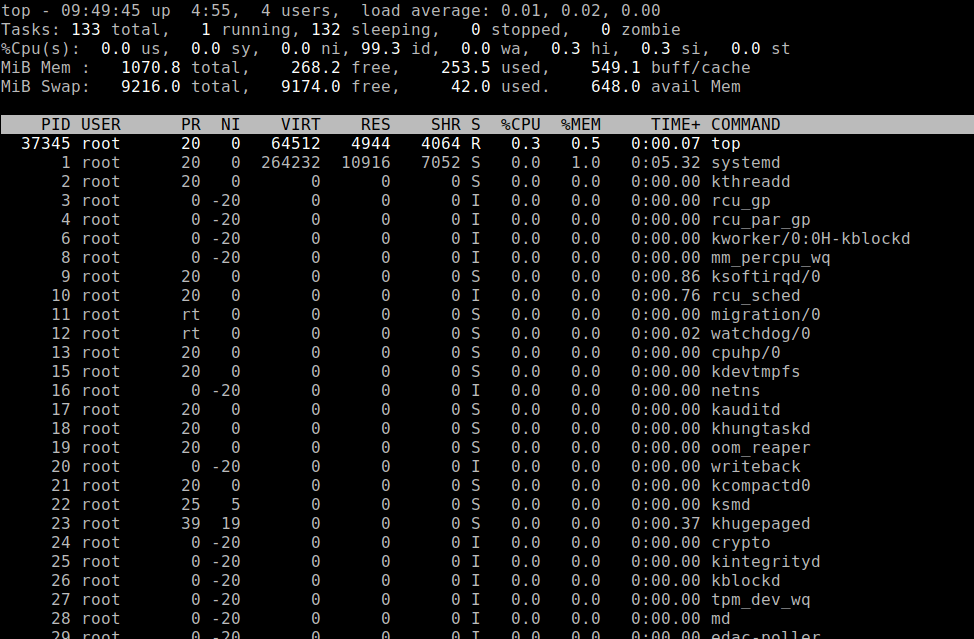
Linux Top command is a performance monitoring program that is used frequently by many system administrators to monitor Linux performance and it is available under many Linux/Unix-like operating systems.
The top command is used to display all the running and active real-time processes in an ordered list and updates it regularly. It displays CPU usage, Memory usage, Swap Memory, Cache Size, Buffer Size, Process PID, User, Commands, and much more.
It also shows high memory and cpu utilization of running processes. The top command is much useful for system administrators to monitor and take corrective action when required. Let’s see the top command in action.
# top
Check Linux Running Processes
For more examples of Top command read: 12 TOP Command Examples in Linux
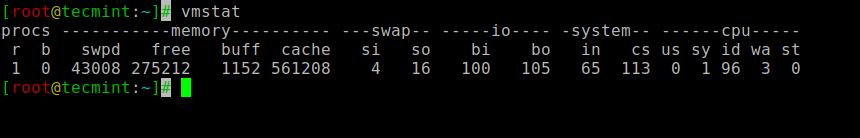
2. VmStat – Virtual Memory Statistics
Linux VmStat command is used to display statistics of virtual memory, kernel threads, disks, system processes, I/O blocks, interrupts, CPU activity, and much more.
Install VmStat in Linux
By default vmstat command is not available under Linux systems you need to install a package called sysstat (a powerful monitoring tool) that includes a vmstat program.
$ sudo yum install sysstat      [On Older CentOS/RHEL & Fedora]
$ sudo dnf install sysstat      [On CentOS/RHEL/Fedora/Rocky Linux & AlmaLinux]
$ sudo apt-get install sysstat  [On Debian/Ubuntu & Mint]
$ sudo pacman -S sysstat        [On Arch Linux]
The common usage of vmstat command format is.
# vmstat

procs -----------memory---------- ---swap-- -----io---- -system-- ------cpu-----
 r  b   swpd   free   buff  cache   si   so    bi    bo   in   cs us sy id wa st
 1  0  43008 275212   1152 561208    4   16   100   105   65  113  0  1 96  3  0
Vmstat System Monitoring Tool
For more usage and examples, read: 6 Vmstat Command Examples in Linux
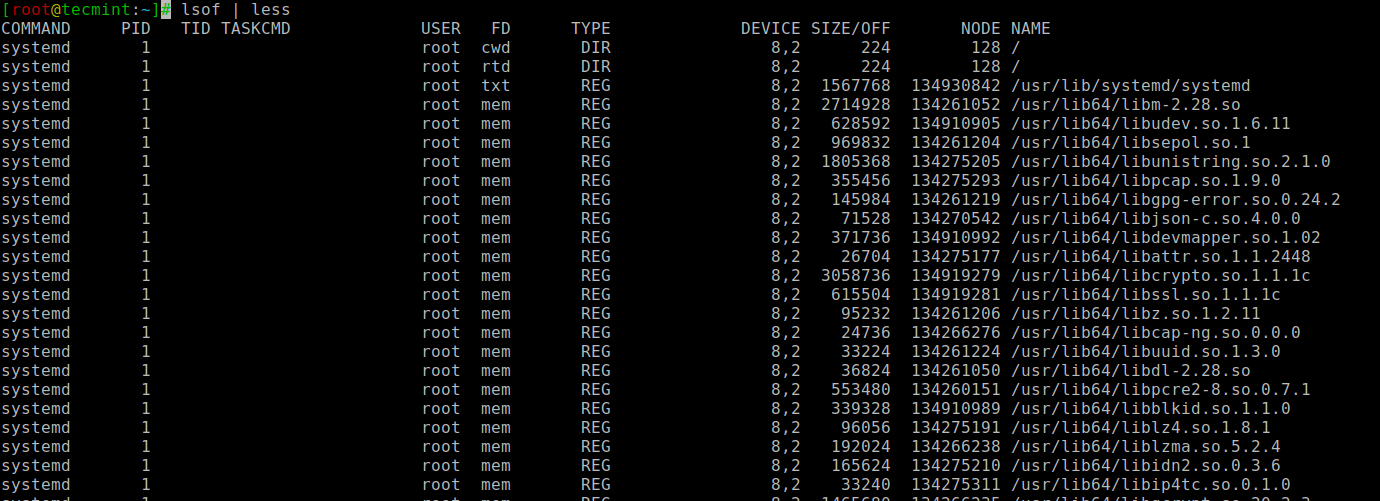
3. Lsof – List Open Files
The lsof command is used in many Linux/Unix-like systems to display a list of all the open files and the processes. The open files included are disk files, network sockets, pipes, devices, and processes.
One of the main reasons for using this command is when a disk cannot be unmounted and displays the error that files are being used or opened. With this command, you can easily identify which files are in use.
The most common format for lsof command is.
# lsof

COMMAND     PID   TID TASKCMD             USER   FD      TYPE             DEVICE SIZE/OFF       NODE NAME
systemd       1                           root  cwd       DIR                8,2      224        128 /
systemd       1                           root  rtd       DIR                8,2      224        128 /
systemd       1                           root  txt       REG                8,2  1567768  134930842 /usr/lib/systemd/systemd
systemd       1                           root  mem       REG                8,2  2714928  134261052 /usr/lib64/libm-2.28.so
systemd       1                           root  mem       REG                8,2   628592  134910905 /usr/lib64/libudev.so.1.6.11
systemd       1                           root  mem       REG                8,2   969832  134261204 /usr/lib64/libsepol.so.1
systemd       1                           root  mem       REG                8,2  1805368  134275205 /usr/lib64/libunistring.so.2.1.0
systemd       1                           root  mem       REG                8,2   355456  134275293 /usr/lib64/libpcap.so.1.9.0
systemd       1                           root  mem       REG                8,2   145984  134261219 /usr/lib64/libgpg-error.so.0.24.2
systemd       1                           root  mem       REG                8,2    71528  134270542 /usr/lib64/libjson-c.so.4.0.0
systemd       1                           root  mem       REG                8,2   371736  134910992 /usr/lib64/libdevmapper.so.1.02
systemd       1                           root  mem       REG                8,2    26704  134275177 /usr/lib64/libattr.so.1.1.2448
systemd       1                           root  mem       REG                8,2  3058736  134919279 /usr/lib64/libcrypto.so.1.1.1c
...
List Open Files in Linux
For more usage and examples, read: 10 lsof Command Examples in Linux
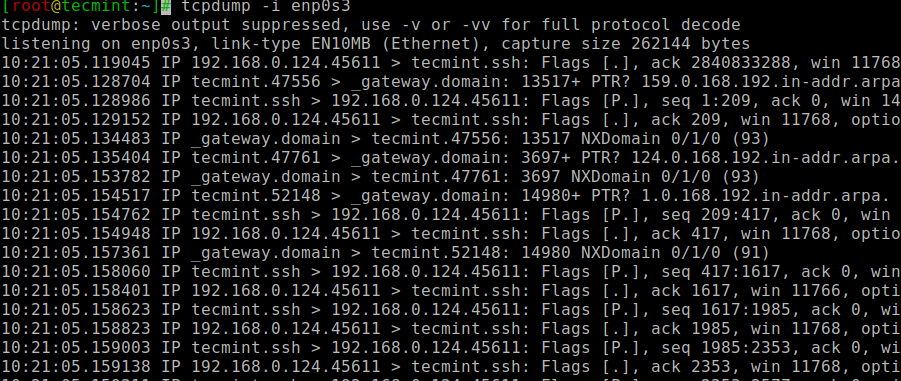
4. Tcpdump – Network Packet Analyzer
The tcpdump command is one of the most widely used command-line network packet analyzer or packets sniffer programs that is used to capture or filters TCP/IP packets that are received or transferred on a specific interface over a network.
It also provides an option to save captured packages in a file for later analysis. tcpdump is almost available in all major Linux distributions.
# tcpdump -i enp0s3

tcpdump: verbose output suppressed, use -v or -vv for full protocol decode
listening on enp0s3, link-type EN10MB (Ethernet), capture size 262144 bytes
10:19:34.635893 IP tecmint.ssh > 192.168.0.124.45611: Flags [P.], seq 2840044824:2840045032, ack 4007244093
10:19:34.636289 IP 192.168.0.124.45611 > tecmint.ssh: Flags [.], ack 208, win 11768, options
10:19:34.873060 IP _gateway.57682 > tecmint.netbios-ns: NBT UDP PACKET(137): QUERY; REQUEST; UNICAST
10:19:34.873104 IP tecmint > _gateway: ICMP tecmint udp port netbios-ns unreachable, length 86
10:19:34.895453 IP _gateway.48953 > tecmint.netbios-ns: NBT UDP PACKET(137): QUERY; REQUEST; UNICAST
10:19:34.895501 IP tecmint > _gateway: ICMP tecmint udp port netbios-ns unreachable, length 86
10:19:34.992693 IP 142.250.4.189.https > 192.168.0.124.38874: UDP, length 45
10:19:35.010127 IP 192.168.0.124.38874 > 142.250.4.189.https: UDP, length 33
10:19:35.135578 IP _gateway.39383 > 192.168.0.124.netbios-ns: NBT UDP PACKET(137): QUERY; REQUEST; UNICAST
10:19:35.135586 IP 192.168.0.124 > _gateway: ICMP 192.168.0.124 udp port netbios-ns unreachable, length 86
10:19:35.155827 IP _gateway.57429 > 192.168.0.124.netbios-ns: NBT UDP PACKET(137): QUERY; REQUEST; UNICAST
10:19:35.155835 IP 192.168.0.124 > _gateway: ICMP 192.168.0.124 udp port netbios-ns unreachable, length 86
...
Tcpdump – Network Packet Analyzer
For more usage and examples, read: 12 Tcpdump Command Examples in Linux
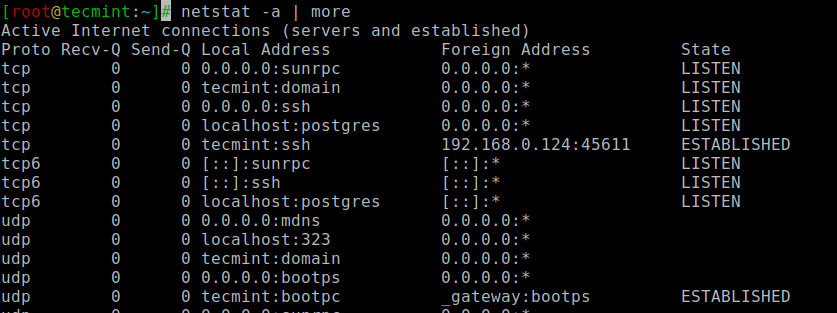
5. Netstat – Network Statistics
The netstat is a command-line tool for monitoring incoming and outgoing network packets statistics as well as interface statistics. It is a very useful tool for every system administrator to monitor network performance and troubleshoot network-related problems.
# netstat -a | more

Active Internet connections (servers and established)
Proto Recv-Q Send-Q Local Address           Foreign Address         State
tcp        0      0 0.0.0.0:sunrpc          0.0.0.0:*               LISTEN
tcp        0      0 tecmint:domain          0.0.0.0:*               LISTEN
tcp        0      0 0.0.0.0:ssh             0.0.0.0:*               LISTEN
tcp        0      0 localhost:postgres      0.0.0.0:*               LISTEN
tcp        0      0 tecmint:ssh             192.168.0.124:45611     ESTABLISHED
tcp6       0      0 [::]:sunrpc             [::]:*                  LISTEN
tcp6       0      0 [::]:ssh                [::]:*                  LISTEN
tcp6       0      0 localhost:postgres      [::]:*                  LISTEN
udp        0      0 0.0.0.0:mdns            0.0.0.0:*
udp        0      0 localhost:323           0.0.0.0:*
udp        0      0 tecmint:domain          0.0.0.0:*
udp        0      0 0.0.0.0:bootps          0.0.0.0:*
udp        0      0 tecmint:bootpc          _gateway:bootps         ESTABLISHED
...
Netstat – Monitor Linux Network Connections
For more usage and examples, read – 20 Netstat Command Examples in Linux.
While in present-day netstat has been deprecated in favor of the ss command, you may still discover netstat in your networking toolkit.
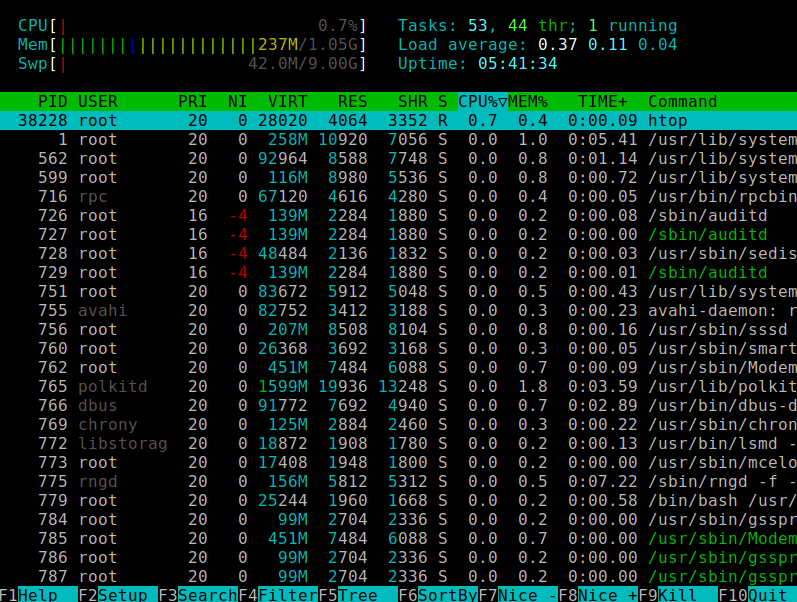
6. Htop – Linux Process Monitoring
htop is a much advanced interactive and real-time Linux process monitoring tool, which is much similar to Linux top command but it has some rich features like a user-friendly interface to manage processes, shortcut keys, vertical and horizontal views of the processes, and much more.
# htop
Htop – Linux System Process Viewer
htop is a third-party tool, which doesn’t come with Linux systems, you need to install it using your system package manager tool. For more information on htop installation read our article – Install Htop (Linux Process Monitoring) in Linux.
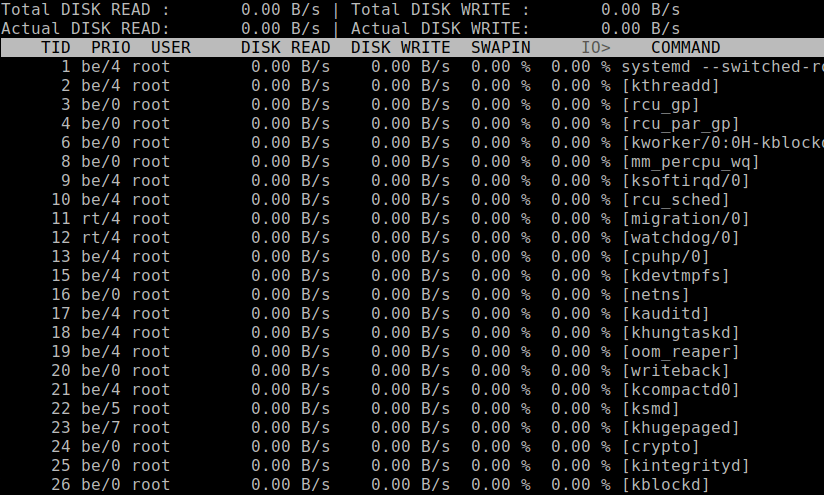
7. Iotop – Monitor Linux Disk I/O
iotop is also much similar to top command and htop program, but it has an accounting function to monitor and display real-time Disk I/O and processes.
iotop tool is much useful for finding the exact process and high used disk read/writes of the processes.
Install Iotop in Linux
By default, the iotop command is not available under Linux and you need to install it as shown.
$ sudo yum install iotop      [On Older CentOS/RHEL & Fedora]
$ sudo dnf install iotop      [On CentOS/RHEL/Fedora/Rocky Linux & AlmaLinux]
$ sudo apt-get install iotop  [On Debian/Ubuntu & Mint]
$ sudo pacman -S iotop        [On Arch Linux]
The common usage of iotop command format is.
# iotop
iotop – Monitor Linux Disk IO Usage
For more usage and examples, read – Iotop – Monitor Linux Disk I/O Activity and Usage Per-Process Basis.
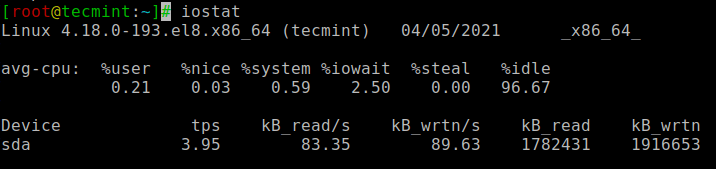
8. Iostat – Input/Output Statistics
iostat is a simple tool that will collect and show system input and output storage device statistics. This tool is often used to trace storage device performance issues including devices, local disks, remote disks such as NFS.
Install Iostat in Linux
To get the iostat command, you need to install a package called sysstat as shown.
$ sudo yum install sysstat      [On Older CentOS/RHEL & Fedora]
$ sudo dnf install sysstat      [On CentOS/RHEL/Fedora/Rocky Linux & AlmaLinux]
$ sudo apt-get install sysstat  [On Debian/Ubuntu & Mint]
$ sudo pacman -S sysstat        [On Arch Linux]
The common usage of iostat command format is.
# iostat

Linux 4.18.0-193.el8.x86_64 (tecmint)   04/05/2021      _x86_64_        (1 CPU)

avg-cpu:  %user   %nice %system %iowait  %steal   %idle
           0.21    0.03    0.59    2.50    0.00   96.67

Device             tps    kB_read/s    kB_wrtn/s    kB_read    kB_wrtn
sda               3.95        83.35        89.63    1782431    1916653
iostat – Monitor Disk IO Statistics
For more usage and examples, read – 6 Iostat Command Examples in Linux.
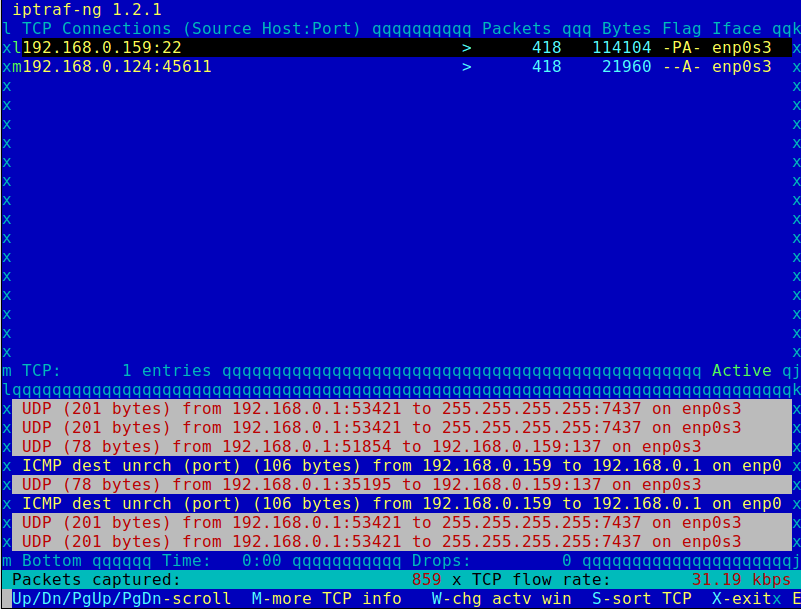
9. IPTraf – Real-Time IP LAN Monitoring
IPTraf is an open-source console-based real-time network (IP LAN) monitoring utility for Linux. It collects a variety of information such as IP traffic monitor that passes over the network, including TCP flag information, ICMP details, TCP/UDP traffic breakdowns, TCP connection packet, and byte counts.
It also gathers information of general and detailed interface statistics of TCP, UDP, IP, ICMP, non-IP, IP checksum errors, interface activity, etc.
IPTraf IP Network Monitor
For more information on installation and usage, read – Real-Time Interactive IP LAN Monitoring with IPTraf Tool.
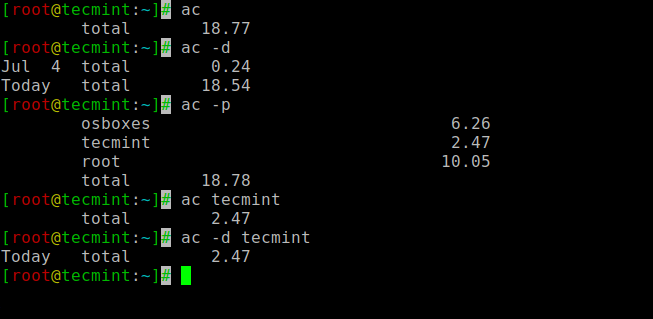
10. Psacct or Acct – Monitor User Activity
psacct or acct tools are very useful for monitoring each user’s activity on the system. Both daemons run in the background and keep a close watch on the overall activity of each user on the system and also what resources are being consumed by them.
These tools are very useful for system administrators to track each user’s activity like what they are doing, what commands they issued, how much resources are used by them, how long they are active on the system etc.
psacct – Monitor Linux User Activities
For installation and example usage of commands read the article on Monitor User Activity with psacct or acct
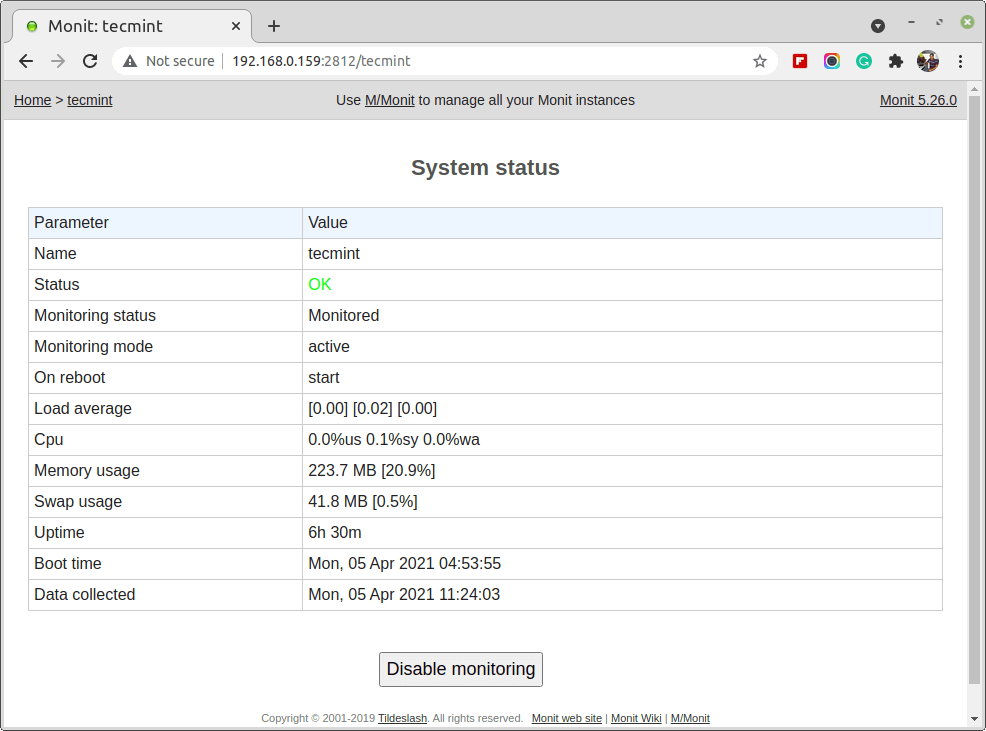
11. Monit – Linux Process and Services Monitoring
Monit is a free open source and web-based process supervision utility that automatically monitors and manages system processes, programs, files, directories, permissions, checksums, and filesystems.
It monitors services like Apache, MySQL, Mail, FTP, ProFTP, Nginx, SSH, and so on. The system status can be viewed from the command line or using its own web interface.
Monit Monitor Linux System
For installation and configuration, read our article – How to Install and Setup Monit (Linux Process and Services Monitoring) Program.
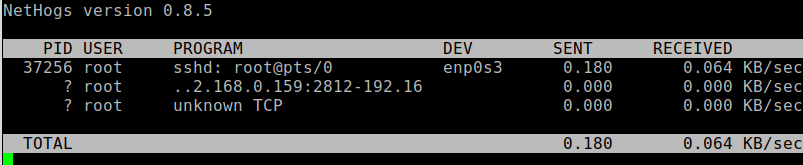
12. NetHogs – Monitor Per Process Network Bandwidth
NetHogs is an open-source nice small program (similar to Linux top command) that keeps a tab on each process network activity on your system. It also keeps a track of real-time network traffic bandwidth used by each program or application.
# nethogs
Nethogs Monitor Network Traffic in Linux
For installation and usage, read our article: Monitor Linux Network Bandwidth Using NetHogs
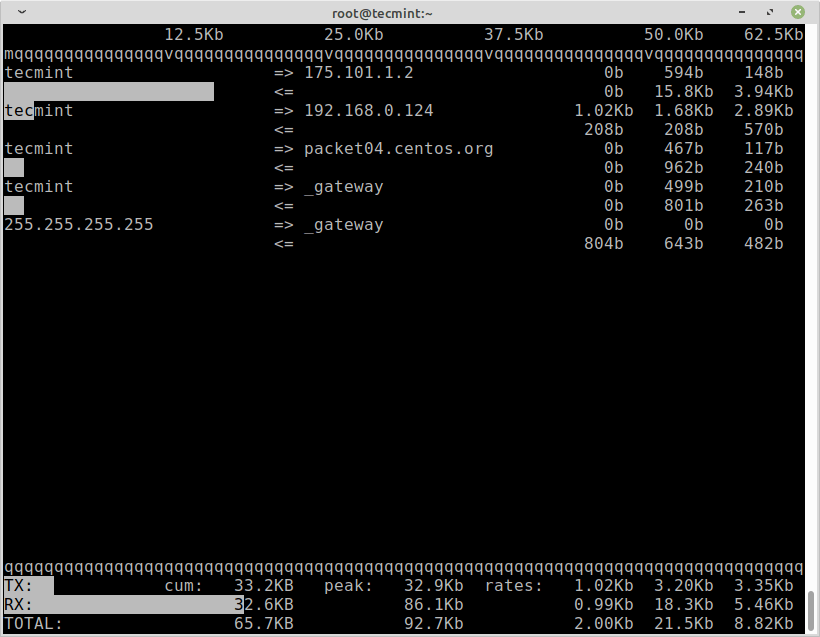
13. iftop – Network Bandwidth Monitoring
iftop is another terminal-based free open source system monitoring utility that displays a frequently updated list of network bandwidth utilization (source and destination hosts) that passing through the network interface on your system.
iftop is considered for network usage, what ‘top‘ does for CPU usage. iftop is a ‘top‘ family tool that monitors a selected interface and displays a current bandwidth usage between two hosts.
# iftop
iftop – Network Bandwidth Monitoring
For installation and usage, read our article: iftop – Monitor Network Bandwidth Utilization
14. Monitorix – System and Network Monitoring
Monitorix is a free lightweight utility that is designed to run and monitor system and network resources as many as possible in Linux/Unix servers.
It has a built-in HTTP web server that regularly collects system and network information and displays them in graphs. It Monitors system load average and usage, memory allocation, disk driver health, system services, network ports, mail statistics (Sendmail, Postfix, Dovecot, etc), MySQL statistics, and many more.
It is designed to monitor overall system performance and helps in detecting failures, bottlenecks, abnormal activities, etc.
Monitorix Monitoring
For installation and usage, read our article: Monitorix a System and Network Monitoring Tool for Linux
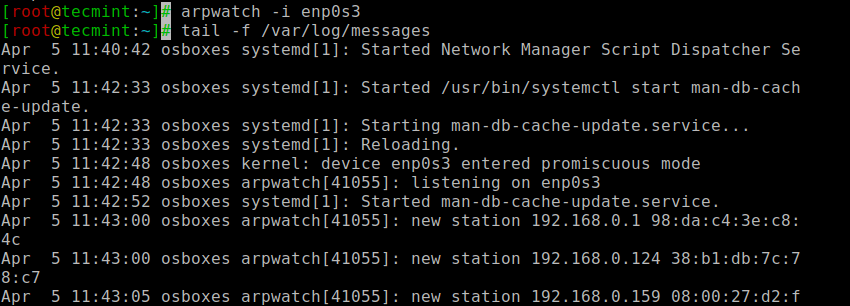
15. Arpwatch – Ethernet Activity Monitor
Arpwatch is a kind of program that is designed to monitor Address Resolution of (MAC and IP address changes) of Ethernet network traffic on a Linux network.
It continuously keeps watch on Ethernet traffic and produces a log of IP and MAC address pair changes along with a timestamp on a network. It also has a feature to send email alerts to administrators, when a pairing is added or changes. It is very useful in detecting ARP spoofing on a network.
Arpwatch – Monitor ARP Traffic
For installation and usage, read our article: Arpwatch to Monitor Ethernet Activity
16. Suricata – Network Security Monitoring
Suricata is a high-performance open-source Network Security and Intrusion Detection and Prevention Monitoring System for Linux, FreeBSD, and Windows.
It was designed and owned by a non-profit foundation OISF (Open Information Security Foundation).
For installation and usage, read our article: Suricata – A Network Intrusion Detection and Prevention System
17. VnStat PHP – Monitoring Network Bandwidth
VnStat PHP is a web-based frontend application for the most popular networking tool called “vnstat“. VnStat PHP monitors network traffic usage in nicely graphical mode.
It displays a total IN and OUT network traffic usage in hourly, daily, monthly, and full summary reports.
For installation and usage, read our article: Monitoring Network Bandwidth Usage
18. Nagios – Network/Server Monitoring
Nagios is a leading open source powerful monitoring system that enables network/system administrators to identify and resolve server-related problems before they affect major business processes.
With the Nagios system, administrators can able to monitor remote Linux, Windows, Switches, Routers, and Printers on a single window. It shows critical warnings and indicates if something went wrong in your network/server which indirectly helps you to begin remediation processes before they occur.
For installation, configuration and usage, read our article – Install Nagios Monitoring System to Monitor Remote Linux/Windows Hosts
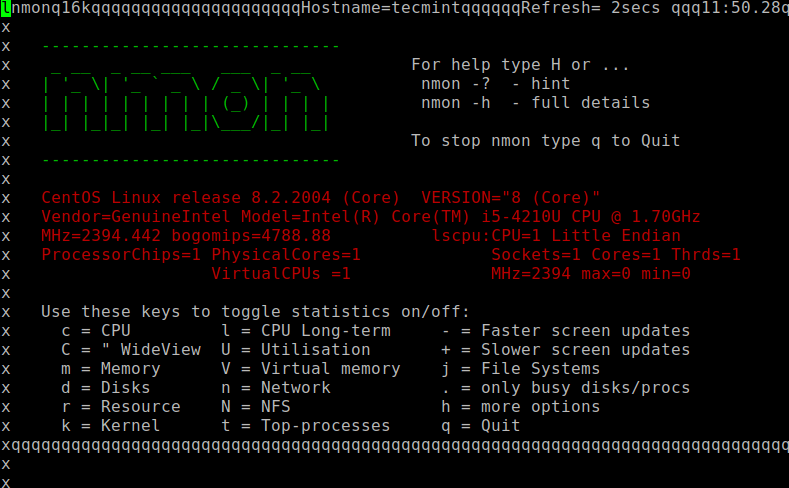
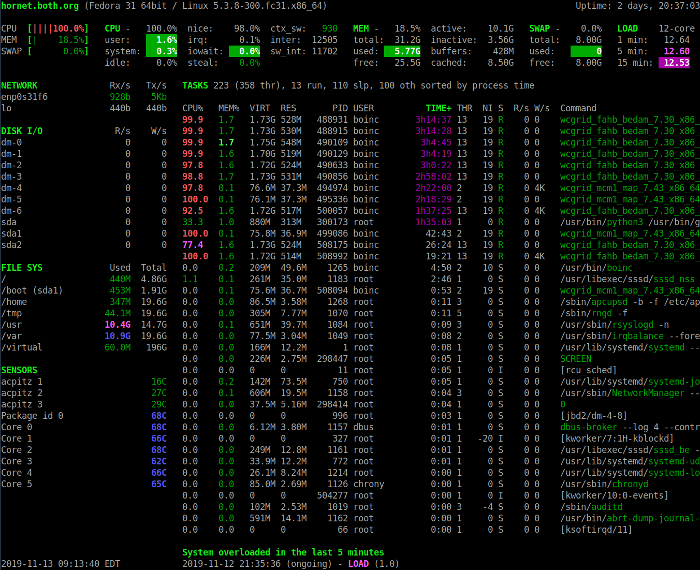
19. Nmon: Monitor Linux Performance
Nmon (stands for Nigel’s performance Monitor) tool, which is used to monitor all Linux resources such as CPU, Memory, Disk Usage, Network, Top processes, NFS, Kernel, and much more. This tool comes in two modes: Online Mode and Capture Mode.
The Online Mode is used for real-time monitoring and Capture Mode is used to store the output in CSV format for later processing.
Nmon – Linux Performance Monitoring tool
For installation and usage, read our article: Install Nmon (Performance Monitoring) Tool in Linux
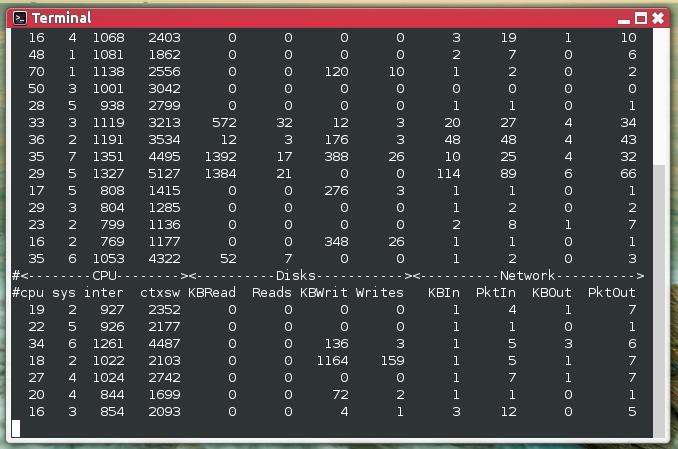
20. Collectl: All-in-One Performance Monitoring Tool
Collectl is yet another powerful and feature-rich command-line-based utility, that can be used to gather information about Linux system resources such as CPU usage, memory, network, inodes, processes, nfs, TCP, sockets, and much more.
Collectl Monitoring
For installation and usage, read our article: Install Collectl (All-in-One Performance Monitoring) Tool in Linux
We would like to know what kind of monitoring programs you use to monitor the performance of your Linux servers? If we’ve missed any important tool that you would like us to include in this list, please inform us via comments, and please don’t forget to share it.
再一个经典的内容14 Useful Performance and Network Monitoring Tools for Linux
14 Useful Performance and Network Monitoring Tools for Linux
Ravi SaiveMay 11, 2022 CategoriesMonitoring Tools 13 Comments
If you’re working as a Linux/Unix system administrator, sure you know that you must have useful monitoring tools to monitor your system performance. As monitoring tools are very important in the job of a system administrator or a server webmaster, it’s the best way to keep an eye on what’s going on inside your system.
[ You might also like: 20 Command Line Tools to Monitor Linux Performance ]
Today we’re going to talk about another 14 Linux monitoring tools that you may use to do the job.
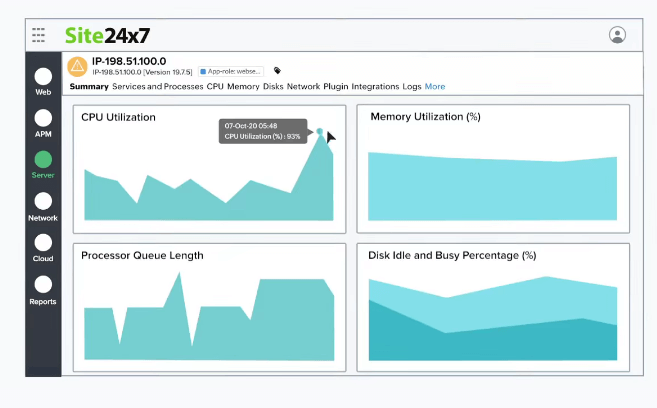
Site24x7’s Linux Monitoring Tool
With Site24x7’s monitoring platform, you can eliminate Linux server outages and performance issues by constantly tracking over 60 key performance metrics, including load average, CPU, memory, disk space, network bandwidth utilization, recent events, and Linux processes.
Configure thresholds for key performance metrics and receive instant alerts via SMS, email, mobile app push notifications, and other ITSM and collaboration tools whenever these thresholds are breached.
Site24x7 lets you automate incident remediation and makes your IT operations more agile and efficient.
Key Features:
- Better visibility into the processes that affect your server health and performance with the exclusive Top Process Chart.
- Services monitoring and Syslog monitoring for Linux servers.
- A single console for MSPs to monitor their customers’ IT infrastructures.
- Monitored metrics pushed via StatsD.
- Support for over 100 plugins, including Redis, MySQL, and NGINX.
Site24X7’s Linux Monitoring Tool
1. Glances – Real-Time Linux System Monitoring
Glances is a monitoring tool built to present as much information as possible in any terminal size, it automatically takes the terminal window size it runs on, in other words, it’s a responsive monitoring tool.
Glances not only show information about CPU and memory usage but also monitor filesystem I/O, network I/O, hardware temperatures, fan speeds, disk usage, and logical volume.
Glances – Linux System Monitoring Tool
Install Glances in Linux
To install the latest stable version of Glances, just enter the following command line:
$ curl -L https://bit.ly/glances | /bin/bash
or
$ wget -O- https://bit.ly/glances | /bin/bash
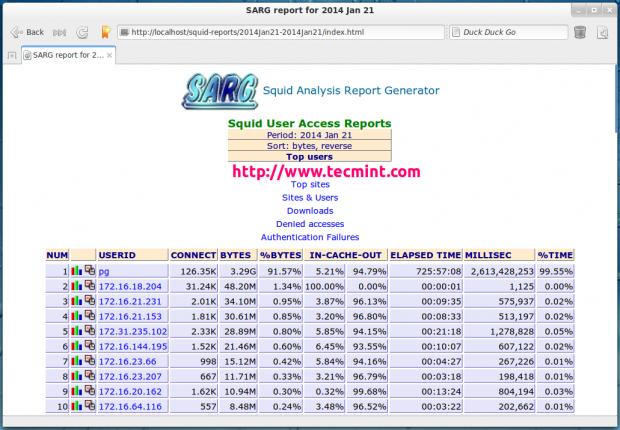
2. Sarg – Squid Bandwidth Monitoring
Sarg (Squid Analysis Report Generator) is a free and open-source tool that acts as a monitoring tool for your Squid proxy server, it creates reports about your Squid proxy server users, IP addresses, the sites they visit, and some other information.
Sarg Monitors Squid Logs
For installation, read our article – Install Sarg “Squid Bandwidth Monitoring” Tool in Linux
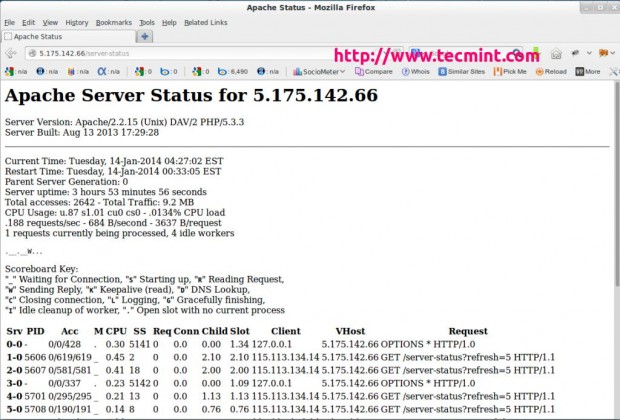
3. Apache Status Monitoring
The mod_status is an Apache server module that allows you to monitor the workers’ status of the Apache server. It generates a report in an easy-to-read HTML format. It shows you the status of all the workers, how much CPU each one using, what requests are currently handled, and the number of working and not working workers.
Apache Status Monitoring
For installation, read our article – How to Monitor Apache Web Server Load and Page Statistics
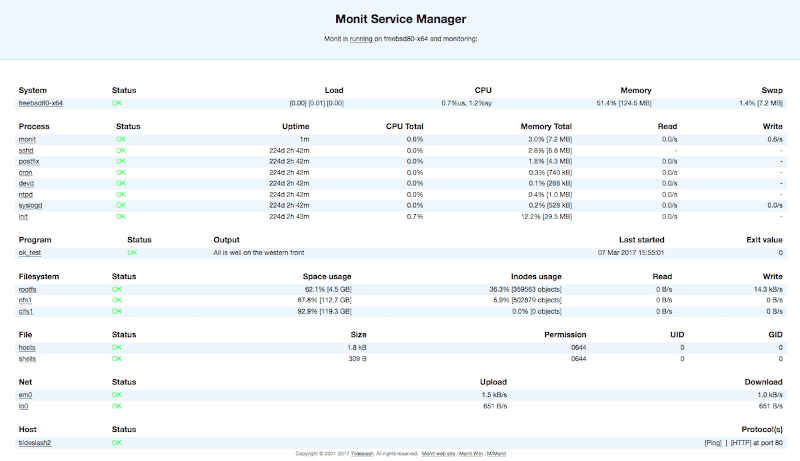
4. Monit – Linux Process and Services Monitoring
Monit is a nice program that monitors your Linux and Unix server, it can monitor everything you have on your server, from the main server (Apache, Nginx..) to files permissions, files hashes, and web services. Plus a lot of things.
Monit – Linux Server Monitoring
Install Monit in Linux
To install the stable version of Monit, just enter the following command line:
$ sudo apt install monit          [On Debian, Ubuntu and Mint]
$ sudo yum install monit          [On RHEL/CentOS/Fedora and Rocky Linux/AlmaLinux]
$ sudo emerge -a app-admin/monit  [On Gentoo Linux]
$ sudo pacman -S monit            [On Arch Linux]
$ sudo zypper install monit       [On OpenSUSE]
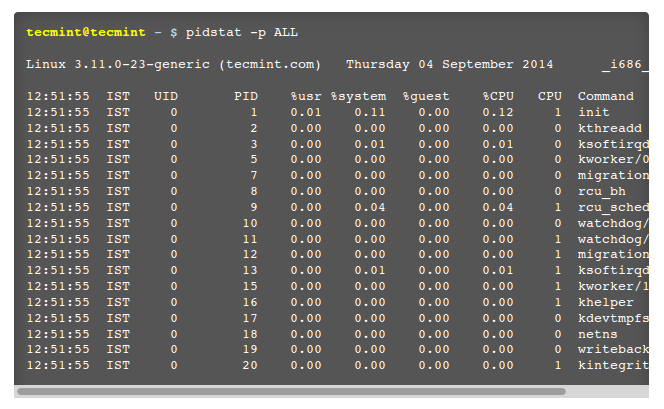
5. Sysstat – All-in-One System Performance Monitoring
Another useful monitoring tool for your Linux system is Sysstat – is not a real command, in fact, it’s just the name of the project, Sysstat, in fact, is a package that includes many performance monitoring tools like iostat, sadf, pidstat beside many other tools which shows you many statistics about your Linux OS.
Sysstat: Linux Statistics Monitoring
Features of Sysstat
- It is available in all modern Linux distribution repositories by default.
- Ability to create statistics about RAM, CPU, and SWAP usage. Besides the ability to monitor Linux kernel activity, NFS server, Sockets, TTY, and filesystems.
- Ability to monitor input & output statistics for devices, tasks.. etc.
- Ability to output reports about network interfaces and devices, with support for IPv6.
- Sysstat can show you the power statistics (usage, devices, the fans’ speed.. etc) as well.
- Many other features…
Install Sysstat in Linux
To install the stable version of Sysstat, just enter the following command line:
$ sudo apt install sysstat          [On Debian, Ubuntu and Mint]
$ sudo yum install sysstat          [On RHEL/CentOS/Fedora and Rocky Linux/AlmaLinux]
$ sudo emerge -a app-admin/sysstat  [On Gentoo Linux]
$ sudo pacman -S sysstat            [On Arch Linux]
$ sudo zypper install sysstat       [On OpenSUSE]
For usage and examples, read our article – 20 Useful Commands of Sysstat
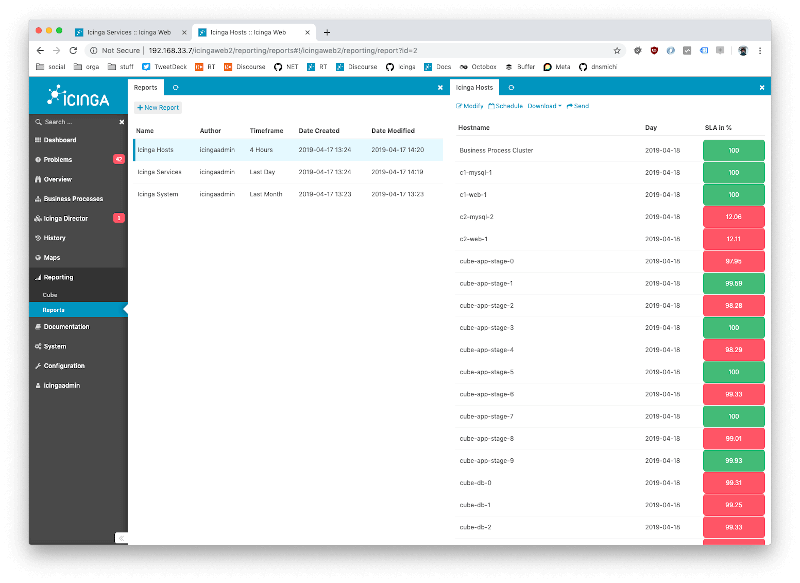
6. Icinga – Next Generation Server Monitoring
Unlike the other tools, Icinga is a network monitoring program, it shows you many options and information about your network connections, devices, and processes, it’s a very good choice for those who are looking for a good tool to monitor networking stuff.
Icinga – Linux Network Monitoring
Features of Icinga
- Icinga is also free and open-source.
- Very functional in monitoring everything you may have in networking.
- Support for MySQL and PostgreSQL is included.
- Real-time monitoring with A nice web interface.
- Very expandable with modules and extensions.
- Icinga supports applying services and actions to hosts.
- A lot more to discover…
For installation, read our article – How to Install Icinga Server Monitoring Tool in Linux
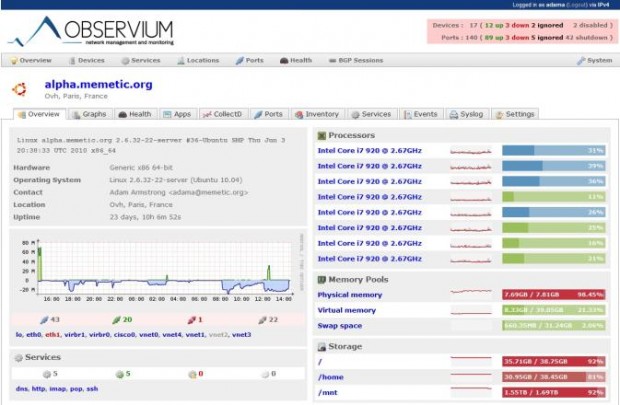
7. Observium – Network Management and Monitoring
Observium is also a network monitoring tool, it was designed to help you manage your network of servers easily, there are 2 versions of it; Community Edition which is free and open-source, and the Commercial version which costs £1,000/year.
Observium: Linux Network Monitoring
Features of Observium
- Written in PHP with MySQL database support.
- Has a nice web interface to output information and data.
- Ability to manage and monitor hundreds of hosts worldwide.
- The community version from it is licensed under the QPL license.
- Works on Windows, Linux, FreeBSD, and more.
For installation, read our article – Install Observium Network Management and Monitoring Tool in Linux
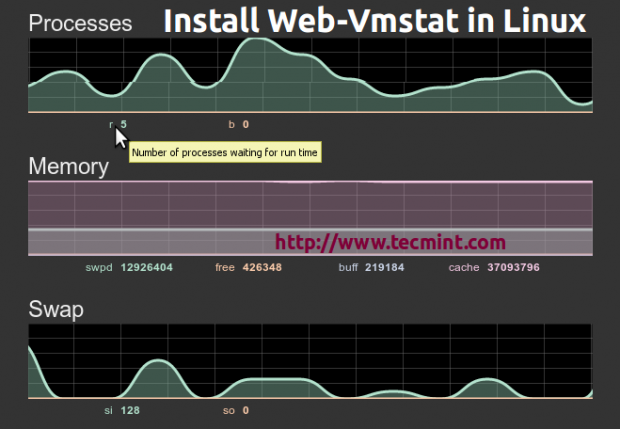
8. Web VMStat – System Statistics Monitoring
Web VMStat is a very simple web application programmer, that provides real-time system information usage, from CPU to RAM, Swap, and input/output information in html format.
Web VMStat Tool for Linux
For installation, read our article – Web VMStat: A Real-Time System Statistics Tool for Linux
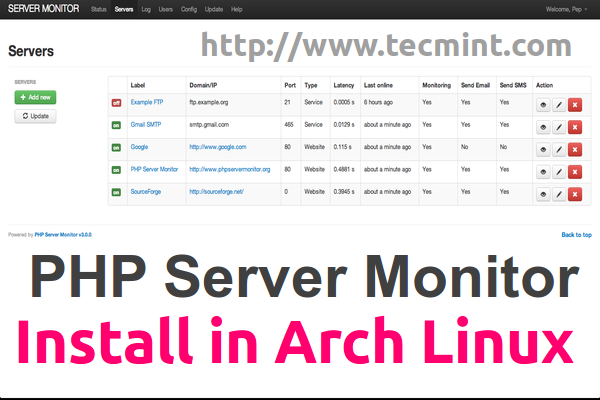
9. PHP Server Monitoring
Unlike the other tools on this list, PHP Server Monitoring is a web script written in PHP that helps you to manage your websites and hosts easily, it supports MySQL database and is released under GPL 3 or later.
PHP Server Monitor
Features
- A nice web interface.
- Ability to send notifications to you via Email & SMS.
- Ability to view the most important information about CPU and RAM.
- A very modern logging system to log connection errors and emails that are sent.
- Support for cronjob services to help you monitor your servers and websites automatically.
For installation, read our article – Install PHP Server Monitoring Tool in Linux
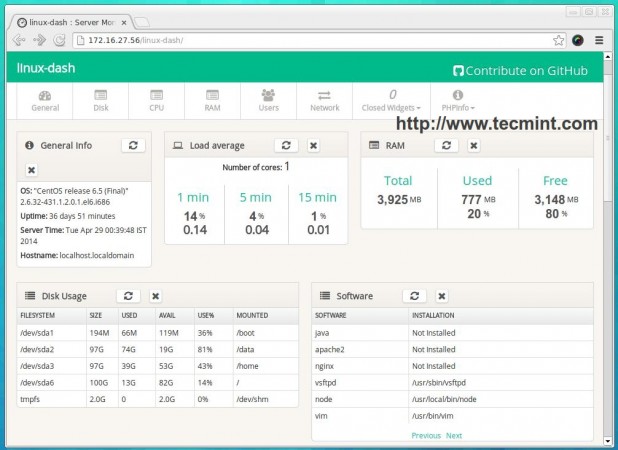
10. Linux Dash – Linux Server Performance Monitoring
From its name, “Linux Dash” is a web dashboard that shows you the most important information about your Linux systems such as RAM, CPU, file system, running processes, users, and bandwidth usage in real-time, it has a nice GUI and it’s free & open-source.
Linux Dash Tool
For installation, read our article – Install Linux Dash (Linux Performance Monitoring) Tool in Linux
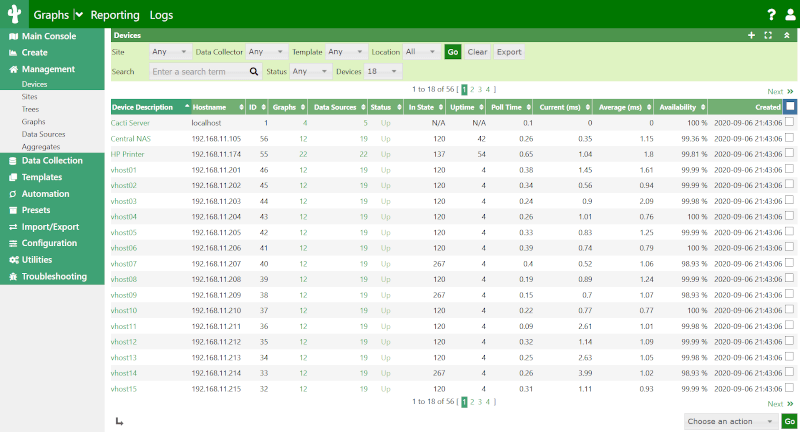
11. Cacti – Network and System Monitoring
Cacti is nothing more than a free & open-source web interface for RRDtool, it is used often to monitor the bandwidth using SNMP (Simple Network Management Protocol), and it can be used also to monitor CPU usage.
Cacti Network Monitoring
For installation, read our article – Install Cacti Network and System Monitoring Tool in Linux
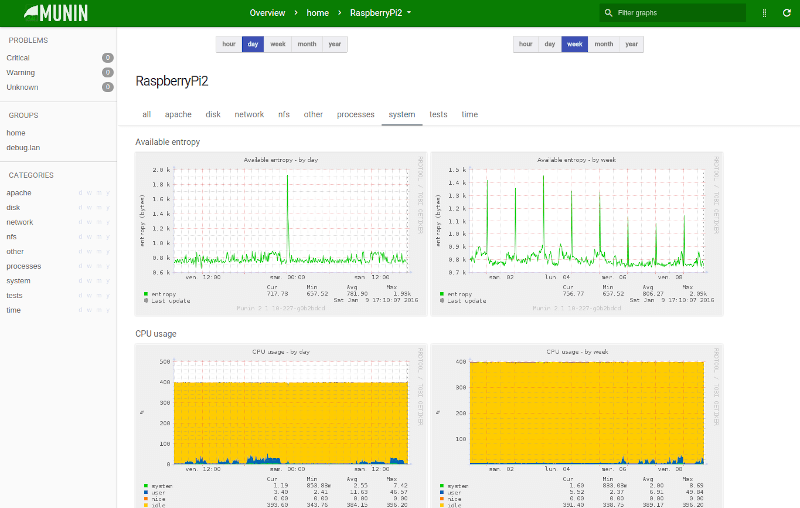
12. Munin – Network Monitoring
Munin is also a web interface GUI for RRDtool, it was written in Perl and licensed under GPL, Munin is a good tool to monitor systems, networks, applications, and services.
It works on all Unix-like operating systems and has a nice plugin system; there are 500+ different plugins available to monitor anything you want on your machine. A notifications system is available to send messages to the administrator when there’s an error or when the error is resolved.
Munin Network Monitoring
For installation, read our article – Install Munin Network Monitoring Tool in Linux
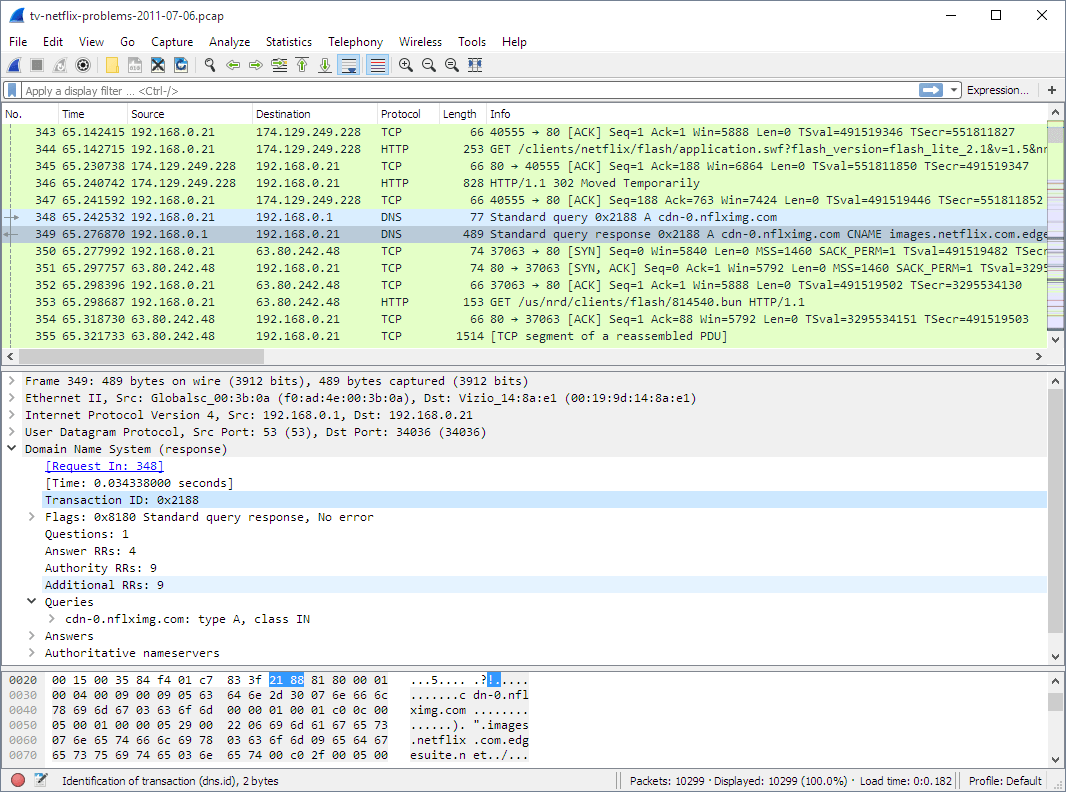
13. Wireshark – Network Protocol Analyzer
Also, unlike all the other tools on our list, Wireshark is an analyzer desktop program that is used to analyze network packets and monitor network connections. It’s written in C with the GTK+ library and released under the GPL license.
Wireshark Network Analyzer
Features
- Cross-platform: it works on Linux, BSD, Mac OS X, and Windows.
- Command-line support: there’s a command-line-based version from Wireshark to analyze data.
- Ability to capture VoIP calls, USB traffic, and network data easily to analyze it.
- Available in most Linux distribution repositories.
For installation, read our article – Install Wireshark – Network Protocol Analyzer Tool in Linux
These were the most important tools to monitor your Linux/Unix machines, of course, there are many other tools, but these are the most famous. Share your thoughts with us in the comments: What tools & programs do you use to monitor your systems? Have you used any of the tools on this list? What do you think about them?


 302
302


 被折叠的 条评论
为什么被折叠?
被折叠的 条评论
为什么被折叠?
 到【灌水乐园】发言


