


本文作者Pierre是一名有10多年经验的高级系统架构师,他的主要专业领域是Java EE、中间件和JVM技术。根据他多年的工作实践经验,他发现许多性能问题都是由Java堆容量不足和调优引起的。下面他将和大家分享非常实用的5个Java堆优化技巧。
1.JVM:对难以理解的东西产生恐惧感
千万不要以为,通过配置,调优,就可以排除那些你所不明白的问题。有些人认为Java程序员不需要知道内部JVM内存管理。毫无疑问,这种观点明显是错误的,如果想拓宽知识面和提升排除故障能力,你就必须要了解和学习一下JVM内存管理。
对于Java或者是Java EE新手来说,Java Heap调优和故障排除是一项非常有挑战的工作。下面会提供一些典型的案例场景:
客户端环境面临着有规律的OutOfMemoryError错误并且对业务造成了很大的影响。
你的开发团队要在如此大的压力下去解决这个问题,通常会怎么做?
- 用谷歌搜索引擎找到类似的问题并且你会相信(或假设)你也面临同样的问题。
- 你会抓住JVM-Xms和存在OutOfMemoryError异常这几个关键字的例子,然后希望通过这样的案例来快速解决客户端问题。
- 最后你会在你环境中使用相同的调优方法。两天后,问题仍然发生(甚至更糟或者稍微好点)……
到底是哪里错了呢?
首先,没有摸清问题根源所在?对开发环境没有正确地进行深层面(规格、负载情况等)理解。网络搜索是一个非常优秀的学习方法和知识分享工具,但是你必须结合自己的实际项目,从根本上进行分析解决。
可能缺乏基本的JVM和JVM内存管理技能,阻止你把所有的点给连接起来。
今天讲的第一条技巧是帮助你理解基本的JVM原则及其与众不同的内存空间。这些知识都是相当重要的,它可以帮助你做出有效的调优策略、更加正确合理的预测将来会产生的影响、提前知道未来需要做哪些调优工作。下面来看一下JVM参考指南:
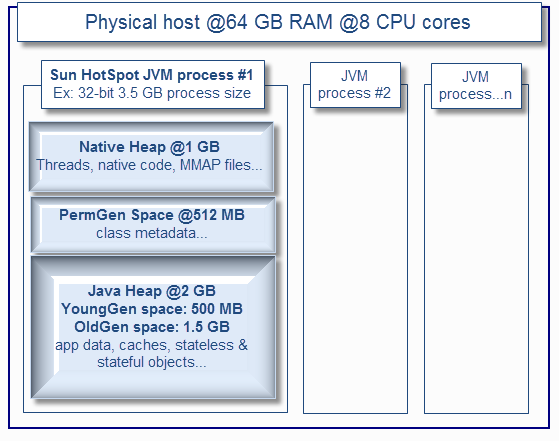
JVM内存分为3个内存空间
- Java Heap:适用于所有的JVM厂商,通常用来拆分YoungGen(幼苗)和OldGen(终身享用)空间。
- PermGen(永久代):适用于Sun HotSpot VM((PermGen空间在Java7或者Java8更新中将会被删除)
- Native Heap(C-Heap):适用于所有的JVM厂商。
建议把下面的文章都能看一遍,最好把Sun的Java内存管理白皮书和OpenJDKS实现下载下来并仔细阅读。
- Sun HotSpot VM
- IBM VM
- Oracle JRockit VM
- Sun(Oracle)–Java memory management white paper
- OpenJDK–Open-source Java implementation
正如你所看到的,JVM内存管理比使用Xmx设置最大值更为复杂。你需要查看每个角度,包括本地和PermGen需求以及从主机上查看物理内存可用性(CPU core)。
在较大的Java Heap和较小的本地Heap比赛中,32位虚拟机可能会变得相当棘手。试图在一个32位VM如2.5GB+上设置一个大型堆,根据应用程序占用和线程数量等因素会增加OutOfMemoryError这个异常抛出。64位JVM可以解决这个问题,但物理资源可用性和垃圾回收成本仍然是有限制的(成本主要集中在GC大小收集上)。最大并不表示是最好的,所以请不要假设在一个16GB的64位虚拟机上可以运行20个Java EE应用程序。
2.数据和应用程序为王:回顾静态占用需求
应用程序以及相关数据将决定Java堆空间占用需求。通过静态内存,可“预测”下面的内存需求:
- 确定将会有多少不同的应用程序部署到预先计划的一个单独的JVM进程上,例如有多少个ear文件、war文件、jar文件等。在一个JVM上部署的应用程序越多,对本机堆的需求就越多。
- 确定有多少个类需要在运行时加载:包括第三方API。越多的类加载器和类在运行时被加载,在HotSpot VM PermGen空间和内部JIT相关优化对象上的需求就越高。
- 确定数据缓存占用,如应用程序加载内部缓存数据结构(和第三方API),例如数据库中的数据缓存,从文件中读取数据等。数据缓存使用越多,Java Heap OldGen空间需求就越高。
- 确定允许建立的中间件线程数量。这是非常重要的,因为Java线程需要足够的本机内存,否则会抛OutOfMemoryError异常。
在JVM进程上部署的应用程序越多,对本地内存和PermGen空间的要求就越高。数据缓存并不是序列化为一个磁盘或数据库,它将从OldGen空间里面需要额外的内存。

设法对静态内存占用进行合理的评估,在真正进行数据测试之前,设置一些JVM能力起点是非常有用的。对于32位JVM,通常不推荐一个Java堆大小超过2 GB(-Xms2048m,-Xmx2048m),对于Java EE应用程序和线程来说这样将需要足够的内存和本机堆PermGen。
这个评估是非常重要因为太多的应用程序部署在一个32位JVM进程上很容易导致本机堆耗尽;尤其是在多重线程环境。
对于64位JVM, 一个3GB或者4GB的Java堆/JVM进程是推荐的起点。
3.业务流量设置规则:审查动态内存占用需求
业务流量通常会决定动态内存占用。通过观察各种监控工具可以发现并发用户与请求生成的JVM GC“心跳”,这是由于频繁的创建和垃圾回收短期或者长期对象。
一个典型的32位JVM,Java堆大小设置在2 GB(使用分代&并发收集器)通常为500 MB YoungGen分配空间和1.5 GB的OldGen空间。
最大限度地减少重大GC收集的频率是获得最佳性能的关键因素,所以在高峰的时候理解和评估需要多少内存是非常重要的。
再次声明,应用程序类型和数据将决定内存需求。购物车的应用程序类型(长期居住的对象)涉及大型和非序列化会话数据,这个通常需要大型Java堆和很多OldGen空间。无状态和XML处理(很多短命的对象)繁重的应用程序需要适当YoungGen空间,以尽量减少频率主要集合。
例如:
你有5个ear应用程序(2000多个Java类)要部署(包含中间件代码)
- 本地堆需求估计为1GB(必须足够大以处理线程创建等等。)PermGen空间大约是512 MB。
- 内部静态缓存大约500MB
- 在高峰时间,总预测流量是5000个并发用户
- 每个用户的会话数据大约500K
- 在高峰期间,总流量会话要求是2.5GB。
正如你所看到的一样,在如此情况下,32位JVM进程就无法满足。一个典型的解决方案是进行流量拆分,在几个JVM进程或物理主机(假设有足够的硬件和CPU core可用)上。
大多数时候,业务流量将推动内存占用。除非你需要大量的数据缓存来实现适当的性能,典型的门户应用网站(媒体)繁重的应用程序需求。数据缓存太多的时候应该用一个黄色的标志标注一下,最好早点去重新审视一下一些设计元素。
4.量体裁衣
这一条,你应该做到:
- 理解基本的JVM原则和内存空间。
- 对所有应用程序有深入的了解及其它们的特点(大小、类型、动态流量、无状态对象VS有状态对象、内部内存缓存等)。
- 对预测业务流量(并发用户)给每一个应用程序能提出很好的观点—如果你需要一个64位的虚拟内存,那么将设置哪个作为开始。
如果需要多个JVM(中间件)过程。
等一下,这样做并不足够。虽然上面的信息是至关重要的,并且关于Java堆的设置进行了“最佳猜测”,对应用程序的行为进行模拟并且进行适当的分析、负载和性能测试来验证Java堆内存要求。
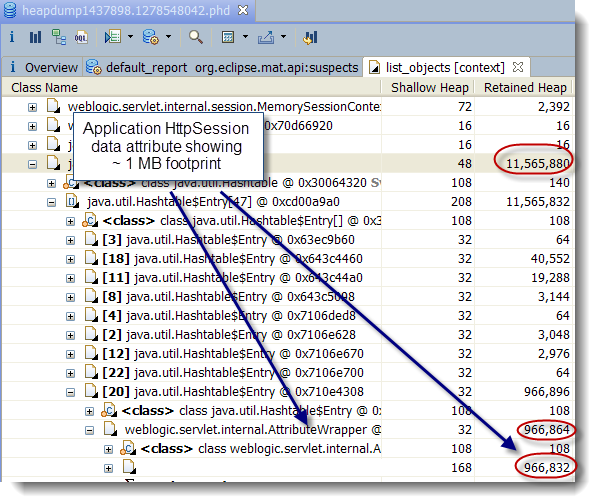
推荐Jprofiler工具给大家,学习如何使用一个分析器的最好方法是正确理解应用程序的内存占用。另一个方法是使用Eclipse MAT工具根据现有的环境进行堆转储分析。堆转储非常强大,它可以允许你查看和理解Java堆的整个内存占用,包含类加载器相关数据和在内存占用分析中必须要做的,特别是内存泄漏。
Java分析器和堆转储分析工具允许你理解和验证应用程序内存足迹,包含内存泄漏的检测和解决方案。负载测试和性能测试是必不可少的,通过模拟并发用户来验证早期评估是否正确,它也会把应用程序瓶颈暴露出来并且允许你进行微调。推荐一个非常容易上手的工具:Apache Jmeter。
最后将看一下这样的情况,应用程序在Java EE环境非常正常,直到有一天完全正常的设备启动失败,例如硬件问题。突然的环境运行能力下降和整体环境下降,到底发生了什么?
引起“多米诺效应”的原因有很多,但缺少JVM调优和处理故障转移的能力(短期额外负荷)是很常见的。如果JVM进程运行在80% + OldGen空间容量和频繁的垃圾收集,你如何预期故障转移场景?
前面模拟的负载和性能测试应该模拟这样的场景,调整你的调优设置使您的Java堆有足够的缓冲来处理额外的负载(额外的对象)在短期内。这主要适用于动态内存占用,由于故障转移意味着将重定向一些固定的并发用户给可利用的JVM进程(中间件实例)。
5.分而治之
这一条的前提是你已经完成了几十个负载测试。JVM已经不存在泄露,你的应用程序内存不能再进行任何减少。你已经尝试了几个调优策略,例如使用一个64位的Java堆空间在10GB以上。多个GC策略,尽管这样,仍然没有找到合适的可以接受的性能水平?
与当前的JVM规范相比,适当的垂直和水平伸缩,包括在每个物理主机和跨多个主机上建立JVM进程来满足整个吞吐量和容量。如果在几个逻辑仓、自身的JVM进程、线程和调优值里打破应用程序列表那么IT环境的容错能力将更强大。
“分而治之”策略包括拆分应用程序流量到多个JVM进程,下面提供一些拆分技巧:
- 减少每个JVM进程的Java堆大小(静态和动态的占用)
- 降低JVM调优复杂度。
- 减少GC流失和暂停每个JVM进程
- 增加冗余和故障切换功能
- 排列最新的Cloud和IT虚拟化战略
当你发现已经花费了大量的时间在64位JVM进程调优上,是时候该好好审视一下你的中间件和JVM部署策略并且利用垂直和水平缩放。这条策略的实现需要更多的硬件支持,但是从长远角度来看,是非常有效和有益的。(张红月/编译)
原文链接:5 Tips for Proper Java Heap Size
This article will provide you with 5 tips that can help you determine optimal Java Heap size, as a starting point, for your current or new production environment. Some of these tips are also very useful regarding the prevention and resolution of java.lang.OutOfMemoryError problems; including memory leaks.
Please note that these tips are intended to “help you” determine proper Java Heap size. Since each IT environment is unique, you are actually in the best position to determine precisely the required Java Heap specifications of your client’s environment. Some of these tips may also not be applicable in the context of a very small Java standalone application but I still recommend you to read the entire article.
Future articles will include tips on how to choose the proper Java VM garbage collector type for your environment and applications.
#1 – JVM: you always fear what you don't understand
How can you expect to configure, tune and troubleshoot something that you don’t understand? You may never have the chance to write and improve Java VM specifications but you are still free to learn its foundation in order to improve your knowledge and troubleshooting skills. Some may disagree, but from my perspective, the thinking that Java programmers are not required to know the internal JVM memory management is an illusion.
Java Heap tuning and troubleshooting can especially be a challenge for Java & Java EE beginners. Find below a typical scenario:
- Your client production environment is facing OutOfMemoryError on a regular basis and causing lot of business impact. Your support team is under pressure to resolve this problem- A quick Google search allows you to find examples of similar problems and you now believe (and assume) that you are facing the same problem- You then grab JVM -Xms and -Xmx values from another person OutOfMemoryError problem case, hoping to quickly resolve your client’s problem- You then proceed and implement the same tuning to your environment. 2 days later you realize problem is still happening (even worse or little better)…the struggle continues…
What went wrong?
- You failed to first acquire proper understanding of the root cause of your problem- You may also have failed to properly understand your production environment at a deeper level (specifications, load situation etc.). Web searches is a great way to learn and share knowledge but you have to perform your own due diligence and root cause analysis- You may also be lacking some basic knowledge of the JVM and its internal memory management, preventing you to connect all the dots together
My #1 tip and recommendation to you is to learn and understand the basic JVM principles along with its different memory spaces. Such knowledge is critical as it will allow you to make valid recommendations to your clients and properly understand the possible impact and risk associated with future tuning considerations. Now find below a quick high level reference guide for the Java VM:
The Java VM memory is split up to 3 memory spaces:
- The Java Heap. Applicable for all JVM vendors, usually split between YoungGen (nursery) & OldGen (tenured) spaces.
- The PermGen (permanent generation). Applicable to the Sun HotSpot VM only (PermGen space will be removed in future Java 7 or Java 8 updates)
- The Native Heap (C-Heap). Applicable for all JVM vendors.
I recommend that you review each article below, including Sun white paper on the HotSpot Java memory management. I also encourage you to download and look at the OpenJDK implementation.
## Sun HotSpot VM http://javaeesupportpatterns.blogspot.com/2011/08/java-heap-space-hotspot-vm.html
## IBM VM http://javaeesupportpatterns.blogspot.com/2012/02/java-heap-space-ibm-vm.html
## Oracle JRockit VM http://javaeesupportpatterns.blogspot.com/2012/02/java-heap-space-jrockit-vm.html
## Sun (Oracle) – Java memory management white paper http://java.sun.com/j2se/reference/whitepapers/memorymanagement_whitepaper.pdf
## OpenJDK – Open-source Java implementation http://openjdk.java.net/
As you can see, the Java VM memory management is more complex than just setting up the biggest value possible via –Xmx. You have to look at all angles, including your native and PermGen space requirement along with physical memory availability (and # of CPU cores) from your physical host(s).
It can get especially tricky for 32-bit JVM since the Java Heap and native Heap are in a race. The bigger your Java Heap, smaller the native Heap. Attempting to setup a large Heap for a 32-bit VM e.g .2.5 GB+ increases risk of native OutOfMemoryError depending of your application(s) footprint, number of Threads etc. 64-bit JVM resolves this problem but you are still limited to physical resources availability and garbage collection overhead (cost of major GC collections go up with size). The bottom line is that the bigger is not always the better so please do not assume that you can run all your 20 Java EE applications on a single 16 GB 64-bit JVM process.
#2 – Data and application is king: review your static footprint requirement
Your application(s) along with its associated data will dictate the Java Heap footprint requirement. By static memory, I mean “predictable” memory requirements as per below.
- Determine how many different applications you are planning to deploy to a single JVM process e.g. number of EAR files, WAR files, jar files etc. The more applications you deploy to a single JVM, higher demand on native Heap- Determine how many Java classes will be potentially loaded at runtime; including third part API’s. The more class loaders and classes that you load at runtime, higher demand on the HotSpot VM PermGen space and internal JIT related optimization objects- Determine data cache footprint e.g. internal cache data structures loaded by your application (and third party API’s) such as cached data from a database, data read from a file etc. The more data caching that you use, higher demand on the Java Heap OldGen space- Determine the number of Threads that your middleware is allowed to create. This is very important since Java threads require enough native memory or OutOfMemoryError will be thrown
For example, you will need much more native memory and PermGen space if you are planning to deploy 10 separate EAR applications on a single JVM process vs. only 2 or 3. Data caching not serialized to a disk or database will require extra memory from the OldGen space.
Try to come up with reasonable estimates of the static memory footprint requirement. This will be very useful to setup some starting point JVM capacity figures before your true measurement exercise (e.g. tip #4). For 32-bit JVM, I usually do not recommend a Java Heap size high than 2 GB (-Xms2048m, -Xmx2048m) since you need enough memory for PermGen and native Heap for your Java EE applications and threads.
This assessment is especially important since too many applications deployed in a single 32-bit JVM process can easily lead to native Heap depletion; especially in a multi threads environment.
For a 64-bit JVM, a Java Heap size of 3 GB or 4 GB per JVM process is usually my recommended starting point.
#3 – Business traffic set the rules: review your dynamic footprint requirement
Your business traffic will typically dictate your dynamic memory footprint. Concurrent users & requests generate the JVM GC “heartbeat” that you can observe from various monitoring tools due to very frequent creation and garbage collections of short & long lived objects. As you saw from the above JVM diagram, a typical ratio of YoungGen vs. OldGen is 1:3 or 33%.
For a typical 32-bit JVM, a Java Heap size setup at 2 GB (using generational & concurrent collector) will typically allocate 500 MB for YoungGen space and 1.5 GB for the OldGen space.
Minimizing the frequency of major GC collections is a key aspect for optimal performance so it is very important that you understand and estimate how much memory you need during your peak volume.
Again, your type of application and data will dictate how much memory you need. Shopping cart type of applications (long lived objects) involving large and non-serialized session data typically need large Java Heap and lot of OldGen space. Stateless and XML processing heavy applications (lot of short lived objects) require proper YoungGen space in order to minimize frequency of major collections.
Example:
- You have 5 EAR applications (~2 thousands of Java classes) to deploy (which include middleware code as well…)- Your native heap requirement is estimated at 1 GB (has to be large enough to handle Threads creation etc.)- Your PermGen space is estimated at 512 MB- Your internal static data caching is estimated at 500 MB- Your total forecast traffic is 5000 concurrent users at peak hours- Each user session data footprint is estimated at 500 K- Total footprint requirement for session data alone is 2.5 GB under peak volume
As you can see, with such requirement, there is no way you can have all this traffic sent to a single JVM 32-bit process. A typical solution involves splitting (tip #5) traffic across a few JVM processes and / or physical host (assuming you have enough hardware and CPU cores available).
However, for this example, given the high demand on static memory and to ensure a scalable environment in the long run, I would also recommend 64-bit VM but with a smaller Java Heap as a starting point such as 3 GB to minimize the GC cost. You definitely want to have extra buffer for the OldGen space so I typically recommend up to 50% memory footprint post major collection in order to keep the frequency of Full GC low and enough buffer for fail-over scenarios.
Most of the time, your business traffic will drive most of your memory footprint, unless you need significant amount of data caching to achieve proper performance which is typical for portal (media) heavy applications. Too much data caching should raise a yellow flag that you may need to revisit some design elements sooner than later.
#4 – Don’t guess it, measure it!
At this point you should:
- Understand the basic JVM principles and memory spaces- Have a deep view and understanding of all applications along with their characteristics (size, type, dynamic traffic, stateless vs. stateful objects, internal memory caches etc.)- Have a very good view or forecast on the business traffic (# of concurrent users etc.) and for each application- Some ideas if you need a 64-bit VM or not and which JVM settings to start with- Some ideas if you need more than one JVM (middleware) processes
But wait, your work is not done yet. While this above information is crucial and great for you to come up with “best guess” Java Heap settings, it is always best and recommended to simulate your application(s) behaviour and validate the Java Heap memory requirement via proper profiling, load & performance testing.
You can learn and take advantage of tools such as JProfiler (future articles will include tutorials on JProfiler). From my perspective, learning how to use a profiler is the best way to properly understand your application memory footprint. Another approach I use for existing production environments is heap dump analysis using the Eclipse MAT tool. Heap Dump analysis is very powerful and allow you to view and understand the entire memory footprint of the Java Heap, including class loader related data and is a must do exercise in any memory footprint analysis; especially memory leaks.
Java profilers and heap dump analysis tools allow you to understand and validate your application memory footprint, including detection and resolution of memory leaks. Load and performance testing is also a must since this will allow you to validate your earlier estimates by simulating your forecast concurrent users. It will also expose your application bottlenecks and allow you to further fine tune your JVM settings. You can use tools such as Apache JMeter which is very easy to learn and use or explore other commercial products.
Finally, I have seen quite often Java EE environments running perfectly fine until the day where one piece of the infrastructure start to fail e.g. hardware failure. Suddenly the environment is running at reduced capacity (reduced # of JVM processes) and the whole environment goes down. What happened?
There are many scenarios that can lead to domino effects but lack of JVM tuning and capacity to handle fail-over (short term extra load) is very common. If your JVM processes are running at 80%+ OldGen space capacity with frequent garbage collections, how can you expect to handle any fail-over scenario?
Your load and performance testing exercise performed earlier should simulate such scenario and you should adjust your tuning settings properly so your Java Heap has enough buffer to handle extra load (extra objects) at short term. This is mainly applicable for the dynamic memory footprint since fail-over means redirecting a certain % of your concurrent users to the available JVM processes (middleware instances).
#5 – Divide and conquer
At this point you have performed dozens of load testing iterations. You know that your JVM is not leaking memory. Your application memory footprint cannot be reduced any further. You tried several tuning strategies such as using a large 64-bit Java Heap space of 10 GB+, multiple GC policies but still not finding your performance level acceptable?
In my experience I found that, with current JVM specifications, proper vertical and horizontal scaling which involved creating a few JVM processes per physical host and across several hosts will give you the throughput and capacity that you are looking for. Your IT environment will also more fault tolerant if you break your application list in a few logical silos, with their own JVM process, Threads and tuning values.
This “divide and conquer” strategy involves splitting your application(s) traffic to multiple JVM processes and will provide you with:
- Reduced Java Heap size per JVM process (both static & dynamic footprint)- Reduced complexity of JVM tuning- Reduced GC elapsed and pause time per JVM process- Increased redundancy and fail-over capabilities- Aligned with latest Cloud and IT virtualization strategies
The bottom line is that when you find yourself spending too much time in tuning that single elephant 64-bit JVM process, it is time to revisit your middleware and JVM deployment strategy and take advantage of vertical & horizontal scaling. This implementation strategy is more taxing for the hardware but will really pay off in the long run.
Please provide any comment and share your experience on JVM Heap sizing and tuning.


 583
583

 被折叠的 条评论
为什么被折叠?
被折叠的 条评论
为什么被折叠?
 到【灌水乐园】发言


