


第四章 D3饼图、环图、玫瑰图和弦图
第一节 D3绘制饼图
圆弧使用4个参数,然后使用d3.svg.arc()创建弧生成器。
案例:弧线
<!DOCTYPE html>
<html lang="en">
    <head>
        <meta charset="utf-8">
        <title>D3.j绘制圆弧</title>
        <!--
        <script src="https://d3js.org/d3.v5.min.js"></script>
        -->
        <script type="text/javascript" src="../D3/d3.v3.min.js" charset="UTF-8"></script>
    </head>

    <body>
        <script type="text/javascript">
            //设置窗口和尺寸
            var w =(window.innerWidth
            || document.documentElement.clientWidth
            || document.body.clientWidth)*0.98;
            var h =(window.innerHeight
            || document.documentElement.clientHeight
            || document.body.clientHeight)*0.9;

            var svg = d3.select("body")    //选择body
                         .append("svg")    //在body中添加svg
                         .attr("width",w)  //设置svg宽度
                         .attr("height",h) //设置svg高度

            var dataset = { startAngle:0 ,endAngle: Math.PI * 1.25 }; //创建一个弧形生成器

            //设置半径
            var arcPath = d3.svg.arc()
                            .innerRadius(50)
                            .outerRadius(100);

            svg.append("path")                  //添加路径
               .attr("d",arcPath(dataset))      //路径数据参数设置
               .attr("transform","translate(250,250)")
               .attr("stroke","black")
               .attr("stroke-width","3px")
               .attr("fill","blue");

        </script>
    </body>
</html>
案例:饼图
<!DOCTYPE html>
<html lang="en">
    <head>
        <meta charset="utf-8">
        <title>D3.j_利用圆弧绘制饼状图</title>
        <!--
        <script src="https://d3js.org/d3.v5.min.js"></script>
        -->
        <script type="text/javascript" src="../D3/d3.v3.min.js" charset="UTF-8"></script>
    </head>

    <body>
        <script type="text/javascript">
            //设置窗口和尺寸
            var w =(window.innerWidth
            || document.documentElement.clientWidth
            || document.body.clientWidth)*0.98;
            var h =(window.innerHeight
            || document.documentElement.clientHeight
            || document.body.clientHeight)*0.9;

            var svg = d3.select("body")    //选择body
                         .append("svg")    //在body中添加svg
                         .attr("width",w)  //设置svg宽度
                         .attr("height",h) //设置svg高度

            //创建一个弧形生成器
            var dataset = [{ startAngle: 0 , endAngle: Math.PI * 0.3 },
                           { startAngle: Math.PI * 0.3 , endAngle: Math.PI },
                           { startAngle: Math.PI  , endAngle: Math.PI * 1.5 },
                           { startAngle: Math.PI * 1.5, endAngle: Math.PI * 2 }];

            //设置半径
            var arcPath = d3.svg.arc()
                            .innerRadius(60)
                            .outerRadius(100);

            //设置颜色
            var color = d3.scale.category20();

            //添加路径
             svg.selectAll("path")
                .data(dataset)
                .enter()
                .append("path")
                .attr("d",function(d){ return arcPath(d); })
                .attr("transform","translate("+w/2+","+h/2+")")
                .attr("stroke","black")
                .attr("stroke-width","2px")
                .attr("fill",function(d,i){ return color(i); });

            //添加文字
            svg.selectAll("text")
                .data(dataset)
                .enter()
                .append("text")
                .attr("transform",function(d){
                    return "translate("+w/2+","+h/2+")" +
                            "translate(" + arcPath.centroid(d) + ")";
                })
                .attr("text-anchor","middle")
                .attr("fill","white")
                .attr("font-size","18px")
                .text(function(d){ return Math.floor((d.endAngle - d.startAngle)*180/Math.PI) + "°"; });

        </script>
    </body>
</html>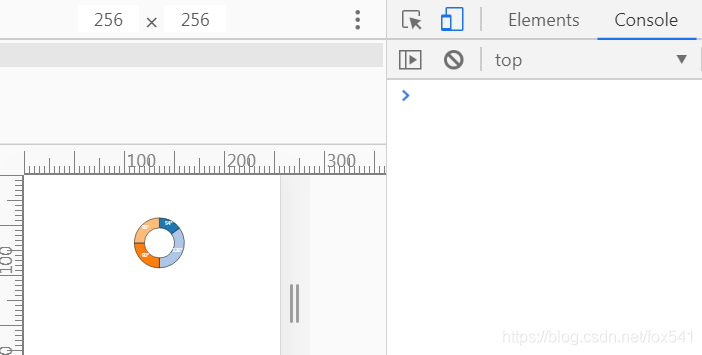
第二节 从原生数据到绘制D3饼图
操作流程:原生数据-->D3.pie转为起止角度-->D3.arc转为<path>坐标-->SVG绘制
案例:绘制带有弧外文字饼图
<!DOCTYPE html>
<html lang="en">
    <head>
        <meta charset="utf-8">
        <title>D3.j_绘制原生数据饼图</title>
        <!--
        <script src="https://d3js.org/d3.v5.min.js"></script>
        -->
        <script type="text/javascript" src="../D3/d3.v4.min.js" charset="UTF-8"></script>
    </head>

    <body>
        <script type="text/javascript">
            //设置窗口和尺寸
            var w =(window.innerWidth
            || document.documentElement.clientWidth
            || document.body.clientWidth)*0.98;
            var h =(window.innerHeight
            || document.documentElement.clientHeight
            || document.body.clientHeight)*0.9;

           //创建一个弧形生成器
            var dataset = [["Chrome",39.49],["IE",29.06],["QQ",4.84],["2345",4.28],["搜狗高速",4.19],["猎豹",2.24],["其他",15.91]];

            //转化数据为适合生成饼图的对象数组
            var pie = d3.pie()
                        .value(function(d){return d[1];});

            var svg = d3.select("body")    //选择body
                         .append("svg")    //在body中添加svg
                         .attr("width",w)  //设置svg宽度
                         .attr("height",h) //设置svg高度

            var piedata = pie(dataset);
            var outerRadius = 150;  //外半径
            var innerRadius = 0;  //内半径,为0则中间没有空白

            //用svg的path绘制弧形的内置方法
            var arc = d3.arc()
                        .innerRadius(innerRadius)   //设置内半径
                        .outerRadius(outerRadius);

            //创建序数比例尺和包括10中颜色的输出范围
            var color = d3.scaleOrdinal(d3.schemeCategory10);

            //准备分组,把每个分组移到图表中心
             var arcs = svg.selectAll("g")    //在svg添加与数据相同的组元素g,存放一段弧的相关元素
                            .data(piedata)
                            .enter()
                            .append("g")   //移到图表中心
                            .attr("transform","translate("+ (w/2) +","+ (h/2) +")");  //translate(a,b)a表示横坐标起点,b表示纵坐标起点

            //为组中每个元素绘制弧形路路径
            arcs.append("path")//每个g元素都追加一个path元素,用g的数据d生成路径
                .attr("fill",function(d,i){ return color(i); })
                .attr("d",function(d){ return arc(d); });//将角度转为弧度(d3使用弧度绘制)

            //为组中每个元素添加文本
            arcs.append("text")
                .attr("transform",function(d){
                    var x = arc.centroid(d)[0] * 1.1;
                    var y = arc.centroid(d)[1] * 1.1;
                    return "translate(" + x + "," + y + ")";
                })
                .attr("text-anchor","middle")
                .attr("font-size",function(d) {
                    return d.data[1] + "px";
                })
                .text(function(d){
                    return d.value + "%";
                })
                .on("mouseover",function(d,i){
                    if(d.data[1]<10){
                        d3.select(this)
                        .attr("font-size",30);
                    }
                })
                .on("mouseout",function(d,i){
                    if(d.data[1]<10){
                        d3.select(this)
                        .attr("font-size",function(d) {
                            return d.value + "px";
                        });
                    }
                });

            //添加连接弧外文字的直线元素
            arcs.append("line")
               .attr("stroke","black")
               .attr("x1",function(d){ return arc.centroid(d)[0] * 2; })
               .attr("y1",function(d){ return arc.centroid(d)[1] * 2; })
               .attr("x2",function(d){ return arc.centroid(d)[0] * 2.2; })
               .attr("y2",function(d){ return arc.centroid(d)[1] * 2.2; });

            //添加弧外的文字元素
            arcs.append("text")
                   .attr("transform",function(d){
                        var x = arc.centroid(d)[0] * 2.5;
                        var y = arc.centroid(d)[1] * 2.5;
                        return "translate("+ x + "," + y + ")";
                   })
                   .attr("text-anchor","middle")
                   .attr("font-size",12)
                   .text(function(d){
                    return d.data[0];
                   });
            console.log(dataset);
            console.log(piedata);

        </script>

    </body>
</html>
案例:空心圆弧
<!DOCTYPE html>
<html lang="en">
    <head>
        <meta charset="utf-8">
        <title>D3.j_绘制空心弧形数据饼图</title>
        <!--
        <script src="https://d3js.org/d3.v5.min.js"></script>
        -->
        <script type="text/javascript" src="../D3/d3.v4.min.js" charset="UTF-8"></script>
    </head>

    <body>
        <script type="text/javascript">
            //设置窗口和尺寸
            var w =(window.innerWidth
            || document.documentElement.clientWidth
            || document.body.clientWidth)*0.98;
            var h =(window.innerHeight
            || document.documentElement.clientHeight
            || document.body.clientHeight)*0.9;

        //创建一个弧形生成器
        var dataset = [["Chrome",39.49],["IE",29.06],["QQ",4.84],["2345",4.28],["搜狗高速",4.19],["猎豹",2.24],["其他",15.91]];

        //转化数据为适合生成饼图的对象数组
        var pie = d3.pie()
                    .value(function(d){return d[1];});

        var svg=d3.select("body")
                .append("svg")
                .attr("width",w)
                .attr("height",h);

        var piedata = pie(dataset);
        var outerRadius = 300;  //外半径
        var innerRadius = 200;  //内半径,为0则中间没有空白

        //用svg的path绘制弧形的内置方法
        var arc=d3.arc()//设置弧度的内外径,等待传入的数据生成弧度
            .outerRadius(outerRadius)
            .innerRadius(innerRadius);

        var color = d3.scaleOrdinal(d3.schemeCategory10);//创建序数比例尺和包括10中颜色的输出范围

        //准备分组,把每个分组移到图表中心
        var arcs=svg.selectAll("g")
            .data(pie(dataset))
            .enter()
            .append("g")      //移到图表中心
            .attr("transform", "translate(" + w / 2 + "," + h / 2 + ")");//translate(a,b)a表示横坐标起点,b表示纵坐标起点

        //为组中每个元素绘制弧形路路径
        arcs.append("path")//每个g元素都追加一个path元素用绑定到这个g的数据d生成路径信息
            .attr("fill",function(d,i){//填充颜色
                return color(i);
            })
            .attr("d",arc)//将角度转为弧度(d3使用弧度绘制
            .on('mouseover',function(d,i){
                d3.select(this)
                .attr("fill", d3.rgb(color(i)).brighter());
                svg.append("text")
                   .attr("id","info")
                   .attr("x",w/2)
                   .attr("y",h/2-25)
                   .attr("text-anchor","middle")
                   .attr("font-size",36)
                   .text(d.data[0]);
                svg.append("text")
                   .attr("id","value")
                   .attr("x",w/2)
                   .attr("y",h/2+25)
                   .attr("text-anchor","middle")
                   .attr("font-size",36)
                   .text(d.value+"%");
            })
            .on('mouseout',function(d,i){
                d3.select(this)
                .attr("fill",color(i));
                d3.select("#info")
                .remove();
                d3.select("#value")
                .remove();
            });

        //为组中每个元素添加文本
        arcs.append("text")//每个g元素都追加一个path元素用绑定到这个g的数据d生成路径信息
            .attr("transform",function(d){
                return "translate("+arc.centroid(d)+")";//计算每个弧形的中心点(几何中心)
            })
            .attr("text-anchor","middle")
            .attr("font-size",12)
            .text(function(d){
                return d.value;//这里已经转为对象了
            });

        </script>
    </body>
</html>
案例:玫瑰图
<!DOCTYPE html>
<html lang="en">
    <head>
        <meta charset="utf-8">
        <title>D3.j_绘制玫瑰图</title>
        <!--
        <script src="https://d3js.org/d3.v5.min.js"></script>
        -->
        <script type="text/javascript" src="../D3/d3.v4.min.js" charset="UTF-8"></script>
    </head>

    <body>
        <script type="text/javascript">
            //设置窗口和尺寸
            var w =(window.innerWidth
            || document.documentElement.clientWidth
            || document.body.clientWidth)*0.98;
            var h =(window.innerHeight
            || document.documentElement.clientHeight
            || document.body.clientHeight)*0.9;

        //创建一个弧形生成器
        var dataset = [["Chrome",39.49],["IE",29.06],["QQ",4.84],["2345",4.28],["搜狗高速",4.19],["猎豹",2.24],["其他",15.91]];

        //转化数据为适合生成饼图的对象数组
        var pie = d3.pie()
                    .value(function(d){return d[1];});

        var svg=d3.select("body")
                  .append("svg")
                  .attr("width",w)
                  .attr("height",h);

        innerRadius = 50;  //圆环内半径

        //用svg的path绘制弧形的内置方法
        var arc=d3.arc()//设置弧度的内外径,等待传入的数据生成弧度
                  .innerRadius(innerRadius)
                  .outerRadius(function (d) {
                        var value=d.value;
                        return value*5+ innerRadius;
                    });

        var color = d3.scaleOrdinal(d3.schemeCategory20c);//创建序数比例尺和包括10中颜色的输出范围

        //准备分组,把每个分组移到图表中心
        var arcs=svg.selectAll("g")
            .data(pie(dataset))
            .enter()
            .append("g")      //移到图表中心
            .attr("transform", "translate(" + w / 2 + "," + h / 2 + ")");//translate(a,b)a表示横坐标起点,b表示纵坐标起点

        //为组中每个元素绘制弧形路路径
        arcs.append("path")//每个g元素都追加一个path元素用绑定到这个g的数据d生成路径信息
            .attr("fill",function(d,i){//填充颜色
                return color(i);
            })
            .attr("d",arc)//将角度转为弧度(d3使用弧度绘制
            .on('mouseover',function(d,i){
                d3.select(this)
                .attr("fill", d3.rgb(color(i)).brighter());
                svg.append("text")
                   .attr("id","info")
                   .attr("x",w/2)
                   .attr("y",h/2-25)
                   .attr("text-anchor","middle")
                   .attr("font-size",36)
                   .text(d.data[0]);
                svg.append("text")
                   .attr("id","value")
                   .attr("x",w/2)
                   .attr("y",h/2+25)
                   .attr("text-anchor","middle")
                   .attr("font-size",36)
                   .text(d.value+"%");
            })
            .on('mouseout',function(d,i){
                d3.select(this)
                .attr("fill",color(i));
                d3.select("#info")
                .remove();
                d3.select("#value")
                .remove();
            });

        //为组中每个元素添加文本
        arcs.append("text")//每个g元素都追加一个path元素用绑定到这个g的数据d生成路径信息
            .attr("transform",function(d){
                return "translate("+arc.centroid(d)+")";//计算每个弧形的中心点(几何中心)
            })
            .attr("text-anchor","middle")
            .attr("font-size",12)
            .text(function(d){
                return d.value;//这里已经转为对象了
            });

        </script>
    </body>
</html>
第三节 弦图
一 弦生成器
D3的弦生成器类似于弧生成器,它的要求是两段弧。
基本原理:用弦生成器创建一个chord,这个chord具有弦的属性和方法,把dataset传入,它会对应与弧数据dataset的一组path的参数,用于绘图。
案例:一个简单的弦
<!DOCTYPE html>
<html lang="en">
    <head>
        <meta charset="utf-8">
        <title>D3.j_绘制弦图</title>
        <!--
        <script src="https://d3js.org/d3.v5.min.js"></script>
        -->
        <script type="text/javascript" src="../D3/d3.v3.min.js" charset="UTF-8"></script>
    </head>

    <body>
        <script type="text/javascript">
            //设置窗口和尺寸
            var w =(window.innerWidth
            || document.documentElement.clientWidth
            || document.body.clientWidth)*0.98;
            var h =(window.innerHeight
            || document.documentElement.clientHeight
            || document.body.clientHeight)*0.9;

       //在body中添加svg,并设置宽高属性
            var svg = d3.select("body")         //选择<body>
                        .append("svg")          //在<body>中添加<svg>
                        .attr("width", w)   //设定<svg>的宽度属性
                        .attr("height", h);//设定<svg>的高度属性

        //数据集
        var dataset = {
            source:{ startAngle: 0.2 , endAngle: Math.PI * 0.3 , radius: 200 },
            target:{ startAngle: Math.PI * 1.0 , endAngle: Math.PI * 1.6 , radius:100}
        };

        //创建一个弦生成器
      var chord = d3.svg.chord();

      //添加路径
         svg.append("path")
            .attr("d",chord(dataset)  )
            .attr("transform","translate("+w/2+","+h/2+")")
            .attr("fill","yellow")
            .attr("stroke","black")
            .attr("stroke-w",3);

        svg.append("circle")
            .attr("r",100)
            .attr("transform","translate("+w/2+","+h/2+")")
            .attr("fill","none")
            .attr("stroke","blue")
            .attr("stroke-w",1);

        svg.append("circle")
            .attr("r",200)
            .attr("transform","translate("+w/2+","+h/2+")")
            .attr("fill","none")
            .attr("stroke","blue")
            .attr("stroke-w",1);

        </script>
    </body>
</html>
案例:交互式弦图
弦图表示数据之间的交叉数量关系。
完整的弦图=一组弧(d3.svg.chord)+一组弦(d3.svg.arc)
相关研究:MizBee、Circos
数据来源:
五大洲人口组成表
| 亚洲 | 欧洲 | 非洲 | 美洲 | 大洋洲 | |
| 亚洲 | 9000 | 870 | 3000 | 1000 | 5200 |
| 欧洲 | |||||
| 非洲 | |||||
| 美洲 | |||||
| 大洋洲 |
数据清理,设置为一个州变量和易eg人口二维数组
var continent = [ "亚洲" , "欧洲" , "非洲" , "美洲" , "大洋洲" ];
var population = [
[ 9000, 870 , 3000 , 1000 , 5200 ],
[ 3400, 8000 , 2300 , 4922 , 374 ],
[ 2000, 2000 , 7700 , 4881 , 1050 ],
[ 3000, 8012 , 5531 , 500 , 400 ],
[ 3540, 4310 , 1500 , 1900 , 300 ]
];
代码:
<!DOCTYPE html>
<html lang="en">
    <head>
        <meta charset="utf-8">
        <title>D3.j_交互式弦图</title>
        <!--
        <script src="https://d3js.org/d3.v5.min.js"></script>
        -->
        <script type="text/javascript" src="../D3/d3.v4.min.js" charset="UTF-8"></script>
        <style>
          .outerPath{
            stroke: black;
          }

          .outerText{
            text-anchor: middle;
            font-size: 16;
          }

          .innerPath{
            stroke: black;
          }
      </style>
    </head>


    <body>
        <script type="text/javascript">
            //设置窗口和尺寸
            var w =(window.innerWidth
            || document.documentElement.clientWidth
            || document.body.clientWidth)*0.98;
            var h =(window.innerHeight
            || document.documentElement.clientHeight
            || document.body.clientHeight)*0.9;

            //在body中添加svg,并设置宽高属性
            var svg=d3.select("body")
                     .append("svg")
                     .attr("width",w)
                     .attr("height",h);

            //初始数据
            var continent = [ "亚洲" , "欧洲" , "非洲" , "美洲" , "大洋洲"  ];
            var population = [
              [ 9000,  870  , 3000 , 1000 , 5200 ],
              [ 3400,  8000 , 2300 , 4922 , 374  ],
              [ 2000,  2000 , 7700 , 4881 , 1050 ],
              [ 3000,  8012  , 5531  , 500  , 400  ],
              [ 3540,  4310 , 1500  , 1900 , 300 ]
            ];

            //创建弦图生成器
            var chord = d3.chord()
                           .padAngle(0.03)
                           .sortSubgroups(d3.ascending);

            //绘制并绑定数据
            //弦图的<g>元素
            var gChord = svg.append("g")
                            .attr("transform","translate(" + w/2 + "," + h/2 + ")")
                            .datum(chord(population));

            //节点的<g>元素
            var gOuter = gChord.append("g");
            //弦的<g>元素
            var gInner = gChord.append("g");

            //颜色比例尺
            var color20 = d3.scaleOrdinal(d3.schemeCategory10);

            //圆环内外半径
            var innerRadius = w/2 * 0.5;
            var outerRadius = innerRadius * 1.1;

            //弧生成器
            var arcOuter =  d3.arc()
                         .innerRadius(innerRadius)
                         .outerRadius(outerRadius);

            gOuter.selectAll(".outerPath")
                .data(function(chords) {
                    console.log(chords.groups);
                    return chords.groups;    //绑定节点数组
                })
                .enter()
                .append("path")
                .attr("class","outerPath")
                .style("fill", function(d) { return color20(d.index); })
                .attr("d", arcOuter );

            gOuter.selectAll(".outerText")
                .data(function(chords) {
                    return chords.groups;
                })
                .enter()
                .append("text")
                .each( function(d,i) {    //为被绑定的数据添加变量
                    d.angle = (d.startAngle + d.endAngle)/2;    //弧的中心角度
                    d.name = continent[i];    //节点名称
                })
                .attr("class","outerText")
                .attr("dy",".35em")
                .attr("transform", function(d){    //设定平移属性的值

            //先旋转d.angle(将该值转换为角度)
            var result = "rotate(" + ( d.angle * 180 / Math.PI ) + ")";

            //平移到外半径之外
            result += "translate(0,"+ -1.0 * ( outerRadius + 10 ) +")" ;

            //对于弦图下方的文字,翻转180度(防止其是倒着的)
            if( d.angle > Math.PI * 3 / 4 &&  d.angle < Math.PI * 5 / 4 )
                result += "rotate(180)";
                return result;
                })
                .text(function(d){
                    return d.name;
                });

            //绘制弦
            var arcInner =  d3.ribbon()
                              .radius(innerRadius);
            gInner.selectAll(".innerPath")
                .data(function(chords) {
                    console.log(chords);
                    return chords;
                })
                .enter()
                .append("path")
                .attr("class","innerPath")
                .attr("d", arcInner )
                .style("fill", function(d) { return color20(d.source.index); });


            //添加鼠标交互
            gOuter.selectAll(".outerPath")
                .on("mouseover",fade(0.0))      //鼠标放到节点上
                .on("mouseout",fade(1.0));      //鼠标从节点上移开

            function fade(opacity){
                //返回一个function(g, i)
                return function(g,i){

                    gInner.selectAll(".innerPath")  //选择所有的弦
                            .filter( function(d) {  //过滤器
                                //没有连接到鼠标所在节点的弦才能通过
                                return d.source.index != i && d.target.index != i;
                            })
                            .transition()   //过渡
                            .style("opacity", opacity); //透明度
                                    }
                                }
        </script>
    </body>
</html>
案例:circos自带的example
安装与配置教程:Circos手把手极简教程
官方样本:
# 测试作图
PS D:\asm\circos\circos\example> ..\bin\circos -conf .\etc\circos.conf

# 会出现一大串状态信息,这里显示最后一行信息
debuggroup summary,timer 34.17s image took more than 30 s to generate. 
2015-2019世界人口测试
数据样本:
# Small tab-delimited table with different row and column labels
data Asia Europe Africa Ameraica Atalantic
2015 9000 870 3000 1000 5200
2016 3400 8000 2300 4922 374
2017 2000 2000 7700 4881 1050
2018 3000 8012 5531 500 400
2019 3540 4310 1500 1900 300
效果图


 被折叠的 条评论
为什么被折叠?
被折叠的 条评论
为什么被折叠?
 到【灌水乐园】发言


