


通用可视化
聚类
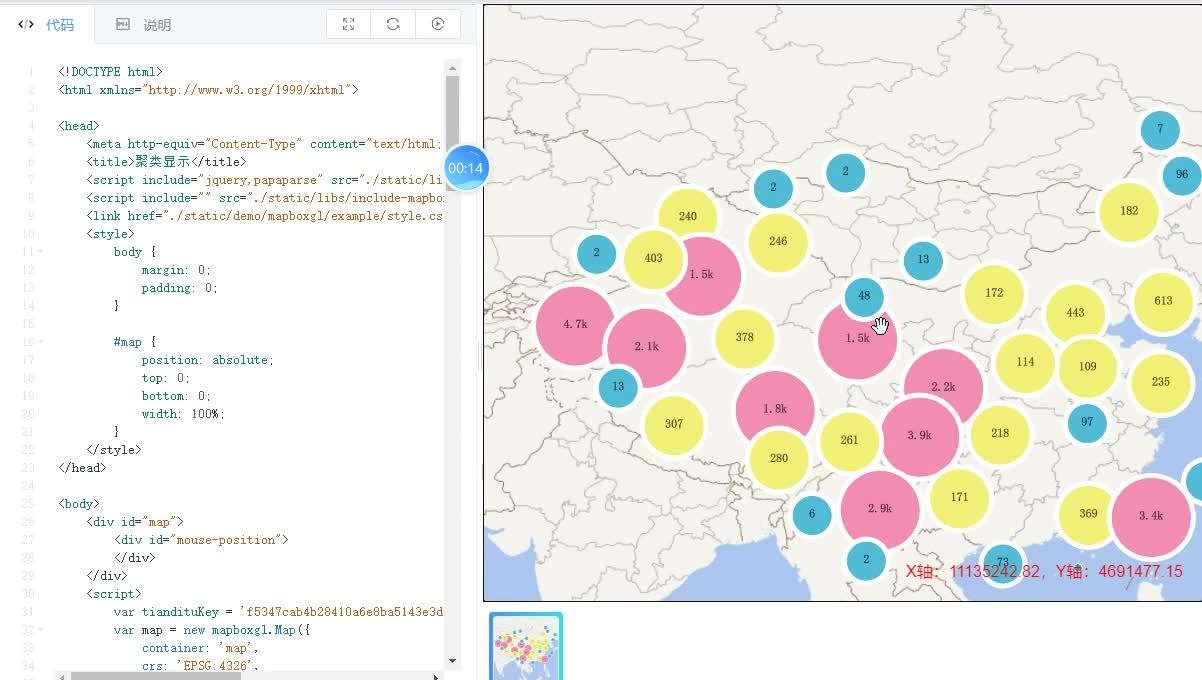
代码展示
<!DOCTYPE html>
<html xmlns="http://www.w3.org/1999/xhtml">
<head>
<meta http-equiv="Content-Type" content="text/html; charset=utf-8" />
<title>聚类显示</title>
<script include="jquery,papaparse" src="./static/libs/include-lib-local.js"></script>
<script include="" src="./static/libs/include-mapboxgl-local.js"></script>
<link href="./static/demo/mapboxgl/example/style.css" rel="stylesheet" type="text/css" />
<style>
body {
margin: 0;
padding: 0;
}
#map {
position: absolute;
top: 0;
bottom: 0;
width: 100%;
}
</style>
</head>
<body>
<div id="map">
<div id="mouse-position">
</div>
</div>
<script>
var tiandituKey = 'f5347cab4b28410a6e8ba5143e3d5a35';
var map = new mapboxgl.Map({
container: 'map',
crs: 'EPSG:4326',
maxBounds: [[-180, -90], [180, 90]],
style: {
version: 8,
sources: {
'tianditu-3857-image': {
//来源类型为栅格瓦片
type: 'raster',
tiles: [
//来源请求地址,请求天地图提供的全球矢量地图WMTS服务
'http://t' +
Math.round(Math.random() * 7) +
'.tianditu.gov.cn/vec_c/wmts?SERVICE=WMTS&REQUEST=GetTile&VERSION=1.0.0' +
'&LAYER=vec&STYLE=default&TILEMATRIXSET=c&FORMAT=tiles' +
'&TILECOL={x}&TILEROW={y}&TILEMATRIX={z}' +
'&tk=' +
tiandituKey
],
//栅格瓦片的分辨率
tileSize: 256
}
},
layers: [
{
id: 'tianditu-3857-image',
type: 'raster',
source: 'tianditu-3857-image',
minzoom: 0,
maxzoom: 22
}
],
glyphs: 'http://develop.smaryun.com:6163/igs/rest/mrms/vtiles/fonts/{fontstack}/{range}.pbf'
},
center: [108.95, 34.25],
zoom: 3
});
//注册鼠标移动事件
map.on('mousemove', function (e) {
//经纬度坐标转web墨卡托
const earthRad = 6378137.0;
const x = e.lngLat.lng * Math.PI / 180 * earthRad;
const a = e.lngLat.lat * Math.PI / 180;
const y = earthRad / 2 * Math.log((1.0 + Math.sin(a)) / (1.0 - Math.sin(a)));
document.getElementById('mouse-position').innerHTML = "X轴:" + x.toFixed(2) + ",Y轴:" + y.toFixed(2);
});
map.on('load', () => {
$.get('../../static/data/geojson/chinaEarthquake.csv', function (response) {
var dataObj = Papa.parse(response, {
skipEmptyLines: true,
header: true
});
var data = dataObj.data;
var geojson = {
type: 'FeatureCollection',
features: []
};
for (var i = 0; i < data.length; i++) {
var item = data[i];
var date = new Date(item.date);
var year = date.getFullYear();
//2w+地震数据
if (year > 2000 && year < 2015) {
var feature = {
type: 'feature',
geometry: {
type: 'Point',
coordinates: []
},
properties: {
value: parseFloat(item.level)
}
};
feature.geometry.coordinates = [parseFloat(item.X), parseFloat(item.Y)];
geojson.features.push(feature);
}
}
addCluster(geojson);
});
});
function addCluster(geojson) {
// map.add
map.addSource('earthquakes', {
type: 'geojson',
data: geojson,
cluster: true,
clusterMaxZoom: 14, // 聚合最大级别
clusterRadius: 50 // 聚合半径
});
map.addLayer({
id: 'clusters',
type: 'circle',
source: 'earthquakes',
filter: ['has', 'point_count'],
paint: {
'circle-color': ['step', ['get', 'point_count'], '#51bbd6', 100, '#f1f075', 750, '#f28cb1'],
'circle-radius': ['step', ['get', 'point_count'], 20, 100, 30, 750, 40],
'circle-stroke-color': '#FFFFFF',
'circle-stroke-width': 5
}
});
map.addLayer({
id: 'cluster-count',
type: 'symbol',
source: 'earthquakes',
filter: ['has', 'point_count'],
layout: {
'text-field': '{point_count_abbreviated}',
'text-font': ['宋体', '宋体'],
'text-size': 12
}
});
map.addLayer({
id: 'unclustered-point',
type: 'circle',
source: 'earthquakes',
filter: ['!', ['has', 'point_count']],
paint: {
'circle-color': '#11b4da',
'circle-radius': 4,
'circle-stroke-width': 1,
'circle-stroke-color': '#fff'
}
});
}
</script>
</body>
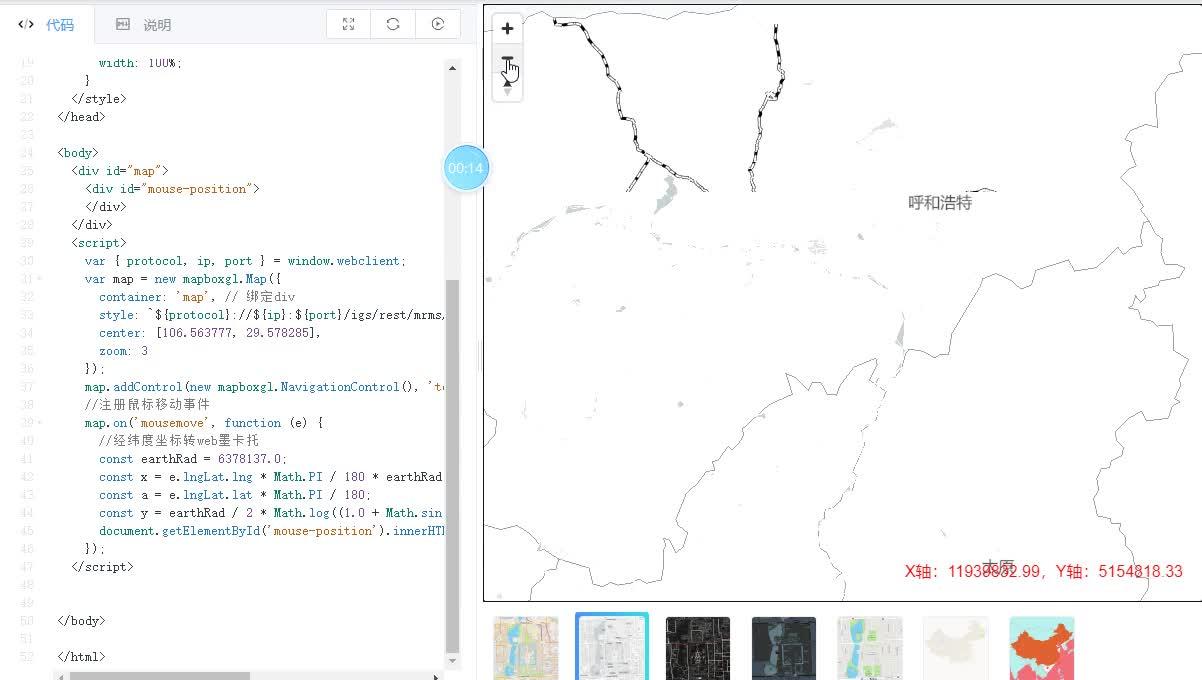
</html>客户端可视化矢量瓦片
上传样式
步骤说明
例功能
使用MapGIS IGServer配置矢量瓦片的显示样式,配置的样式信息保存为xxx.json文件,上传文件到MapGIS IGServer服务器,客户端通过接口即可访问定制样式的矢量瓦片。本示例通过MapGIS IGServer矢量瓦片配置界面,使用默认矢量瓦片地图样式。
示例实现
本示例需要使用【include-mapboxgl-local.js】开发库实现,通过关键接口mapboxgl.Map()实现MapGIS矢量瓦片的加载。
开发库使用请参见首页-概述-原生JS调用内容
1.MapGIS桌面工具裁剪矢量瓦片
(1)准备矢量地图文档

(2)矢量瓦片裁剪:设置输入瓦片索引区要素类,其他选项使用默认值

(3)矢量瓦片裁剪:选择一个空文件夹用来存放生成的矢量瓦片文件,高级设置中将最小显示块级别修改为0,其他选项使用默认值


(4)矢量瓦片裁剪:附加裁剪项设置使用默认值

(5)矢量瓦片裁剪:瓦片裁剪的过程,瓦片裁剪级别越高需要的生成时间越久

(6)矢量瓦片裁剪:裁剪的结果文件展示

2.矢量瓦片的服务发布与样式管理
(1)矢量瓦片服务发布:打开MapGIS Server Manager,找到矢量瓦片发布选项

(2)矢量瓦片服务发布:选择矢量瓦片发布的格式为目录格式,选中矢量瓦片发布的数据路径

(3)矢量瓦片服务发布:点击发布的矢量瓦片的左边的预览按钮,进入对应的编辑界面
![]()
(4)矢量瓦片样式管理:按照个性化需求进行样式配色等操作

(5)矢量瓦片样式管理:样式配置完毕后, 点击左上方的保存按钮保存对应的样式json文件到当前计算机

(6)矢量瓦片样式管理:将第5步保存的文件上传到对应的服务器上, 该按钮在第3步的最右边有个绿色上传箭
![]()
(7)矢量瓦片样式管理:上传完成的提示如下

(7)矢量瓦片样式管理:以上步骤完成后得到矢量瓦片样式URL:http://localhost:6163/igs/rest/mrms/vtiles/styles/hubei-id.json,在步骤实现中通过该URL即可访问矢量瓦片地图服务
实现步骤
Step 1.引用开发库:
本示例通过本地离线【include-mapboxgl-local.js】脚本引入开发库;
Step 2. 创建布局:
创建id="map"的div作为地图容器,并设置其样式;
Step 3. 创建地图对象:
设置地图的必要参数,如地图div容器、缩放层级、中心点等,具体操作参考互联网地图目录下的天地图墨卡托示例;
Step 4. 加载矢量瓦片:
通过矢量瓦片样式URL加载MapGIS矢量瓦片地图服务;
- Example:var map = new mapboxgl.Map({ container: 'map', // 绑定div style: 'http://develop.smaryun.com:6163/igs/rest/mrms/vtiles/styles/黑暗样式.json', center: [106.563777, 29.578285], zoom: 3 }); map.addControl(new mapboxgl.NavigationControl(), 'top-left');
Step 5. 数据展示:
浏览矢量瓦片地图服务。
代码展示
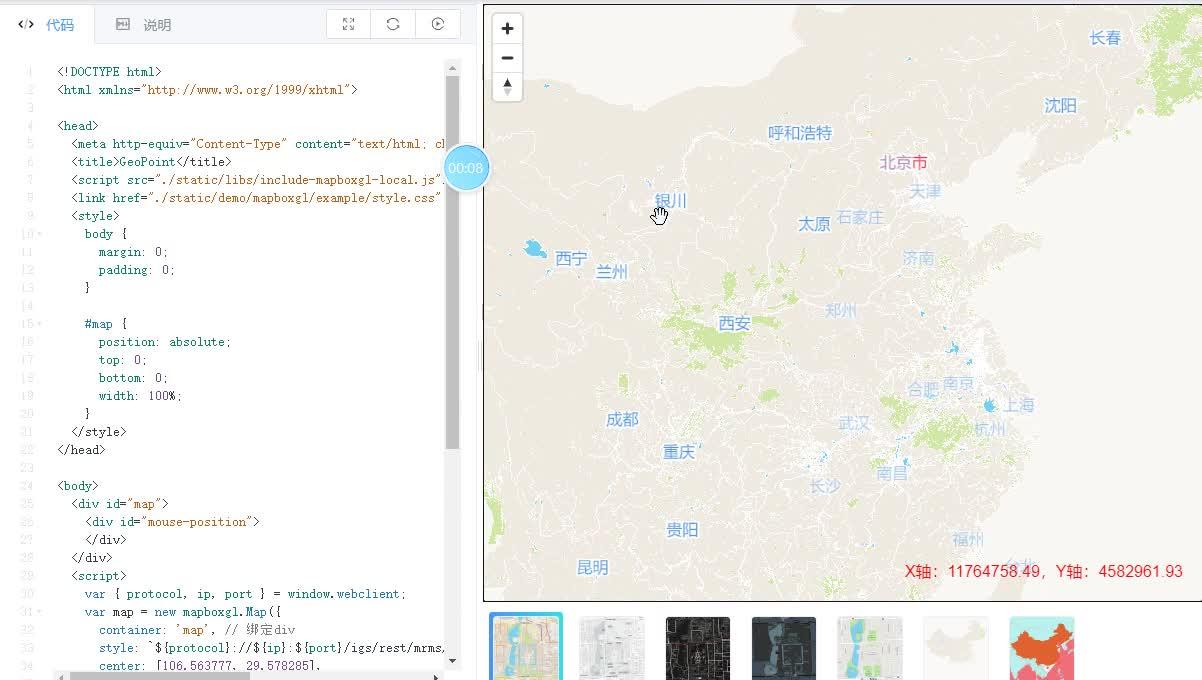
<!DOCTYPE html>
<html xmlns="http://www.w3.org/1999/xhtml">

<head>
  <meta http-equiv="Content-Type" content="text/html; charset=utf-8" />
  <title>GeoPoint</title>
  <script src="./static/libs/include-mapboxgl-local.js"></script>
  <link href="./static/demo/mapboxgl/example/style.css" rel="stylesheet" type="text/css" />
  <style>
    body {
      margin: 0;
      padding: 0;
    }

    #map {
      position: absolute;
      top: 0;
      bottom: 0;
      width: 100%;
    }
  </style>
</head>

<body>
  <div id="map">
    <div id="mouse-position">
    </div>
  </div>
  <script>
    var { protocol, ip, port } = window.webclient;
    var map = new mapboxgl.Map({
      container: 'map', // 绑定div
      style: `${protocol}://${ip}:${port}/igs/rest/mrms/vtiles/styles/街道-墨卡托.json`,
      center: [106.563777, 29.578285],
      zoom: 3
    });
    map.addControl(new mapboxgl.NavigationControl(), 'top-left');
    //注册鼠标移动事件
    map.on('mousemove', function (e) {
      //经纬度坐标转web墨卡托
      const earthRad = 6378137.0;
      const x = e.lngLat.lng * Math.PI / 180 * earthRad;
      const a = e.lngLat.lat * Math.PI / 180;
      const y = earthRad / 2 * Math.log((1.0 + Math.sin(a)) / (1.0 - Math.sin(a)));
      document.getElementById('mouse-position').innerHTML = "X轴:" + x.toFixed(2) + ",Y轴:" + y.toFixed(2);
    });
  </script>


</body>

</html>
浅色样式
示例功能
使用MapGIS IGServer配置矢量瓦片的显示样式,配置的样式信息保存为xxx.json文件,上传文件到MapGIS IGServer服务器,客户端通过接口即可访问定制样式的矢量瓦片。本示例通过MapGIS IGServer矢量瓦片配置界面,配置矢量瓦片浅色地图样式。
示例实现
本示例需要使用【include-mapboxgl-local.js】开发库实现,通过关键接口mapboxgl.Map()实现MapGIS矢量瓦片的加载。
开发库使用请参见 首页- 概述- 原生JS调用内容
1.MapGIS桌面工具裁剪矢量瓦片
(1)准备矢量地图文档
(2)矢量瓦片裁剪:设置输入瓦片索引区要素类,其他选项使用默认值

(3)矢量瓦片裁剪:选择一个空文件夹用来存放生成的矢量瓦片文件,高级设置中将最小显示块级别修改为0,其他选项使用默认值
(4)矢量瓦片裁剪:附加裁剪项设置使用默认值
(5)矢量瓦片裁剪:瓦片裁剪的过程,瓦片裁剪级别越高需要的生成时间越久
(6)矢量瓦片裁剪:裁剪的结果文件展示
2.矢量瓦片的服务发布与样式管理
(1)矢量瓦片服务发布:打开MapGIS Server Manager,找到矢量瓦片发布选项
(2)矢量瓦片服务发布:选择矢量瓦片发布的格式为目录格式,选中矢量瓦片发布的数据路径
(3)矢量瓦片服务发布:点击发布的矢量瓦片的左边的预览按钮,进入对应的编辑界面
![]()
(4)矢量瓦片样式管理:按照个性化需求进行样式配色等操作
(5)矢量瓦片样式管理:样式配置完毕后, 点击左上方的保存按钮保存对应的样式json文件到当前计算机
(6)矢量瓦片样式管理:将第5步保存的文件上传到对应的服务器上, 该按钮在第3步的最右边有个绿色上传箭
![]()
(7)矢量瓦片样式管理:上传完成的提示如下
(7)矢量瓦片样式管理:以上步骤完成后得到矢量瓦片样式URL:http://localhost:6163/igs/rest/mrms/vtiles/styles/hubei-id.json,在步骤实现中通过该URL即可访问矢量瓦片地图服务
实现步骤
Step 1.引用开发库:
本示例通过本地离线【include-mapboxgl-local.js】脚本引入开发库;
Step 2. 创建布局:
创建id="map"的div作为地图容器,并设置其样式;
Step 3. 创建地图对象:
设置地图的必要参数,如地图div容器、缩放层级、中心点等,具体操作参考互联网地图目录下的天地图墨卡托示例;
Step 4. 加载矢量瓦片:
通过矢量瓦片样式URL加载MapGIS矢量瓦片地图服务;
- Example:var map = new mapboxgl.Map({ container: 'map', // 绑定div style: 'http://develop.smaryun.com:6163/igs/rest/mrms/vtiles/styles/黑暗样式.json', center: [106.563777, 29.578285], zoom: 3 }); map.addControl(new mapboxgl.NavigationControl(), 'top-left');
Step 5. 数据展示:
浏览矢量瓦片地图服务;
代码展示
<!DOCTYPE html>
<html xmlns="http://www.w3.org/1999/xhtml">

<head>
  <meta http-equiv="Content-Type" content="text/html; charset=utf-8" />
  <title>GeoPoint</title>
  <script src="./static/libs/include-mapboxgl-local.js"></script>
  <link href="./static/demo/mapboxgl/example/style.css" rel="stylesheet" type="text/css" />
  <style>
    body {
      margin: 0;
      padding: 0;
    }

    #map {
      position: absolute;
      top: 0;
      bottom: 0;
      width: 100%;
    }
  </style>
</head>

<body>
  <div id="map">
    <div id="mouse-position">
    </div>
  </div>
  <script>
    var { protocol, ip, port } = window.webclient;
    var map = new mapboxgl.Map({
      container: 'map', // 绑定div
      style: `${protocol}://${ip}:${port}/igs/rest/mrms/vtiles/styles/浅色-墨卡托.json`,
      center: [106.563777, 29.578285],
      zoom: 3
    });
    map.addControl(new mapboxgl.NavigationControl(), 'top-left');
    //注册鼠标移动事件
    map.on('mousemove', function (e) {
      //经纬度坐标转web墨卡托
      const earthRad = 6378137.0;
      const x = e.lngLat.lng * Math.PI / 180 * earthRad;
      const a = e.lngLat.lat * Math.PI / 180;
      const y = earthRad / 2 * Math.log((1.0 + Math.sin(a)) / (1.0 - Math.sin(a)));
      document.getElementById('mouse-position').innerHTML = "X轴:" + x.toFixed(2) + ",Y轴:" + y.toFixed(2);
    });
  </script>


</body>

</html>
持续更新中


 3474
3474

 被折叠的 条评论
为什么被折叠?
被折叠的 条评论
为什么被折叠?
 到【灌水乐园】发言


