


提示:文章写完后,目录可以自动生成,如何生成可参考右边的帮助文档
文章目录
CentOS7安装部署ELK7.14(单节点)
架构:Beats+Kafka+Logstash+Elasticsearch+Kibana
版本:7.14.0
下载地址:https://mirrors.tuna.tsinghua.edu.cn/elasticstack/7.x/yum/7.14.0/
兼容性:
https://www.elastic.co/cn/support/matrix#matrix_compatibility
一、升级Java
见另一篇文
https://blog.csdn.net/gjjhyd/article/details/120522850
二、安装部署Elasticsearch
1、安装
[root@elktest ~]# rpm -ivh /localdata/tools/elk/elasticsearch-7.14.0-x86_64.rpm
2、配置
[root@elktest ~]# mkdir /localdata/esdata/
[root@elktest ~]# chown elasticsearch /localdata/esdata/
[root@elktest ~]# vim /etc/elasticsearch/elasticsearch.yml
cluster.name: elktest
node.name: elktest
path.data: /localdata/esdata //数据存放目录
path.logs: /var/log/elasticsearch
bootstrap.memory_lock: true //禁用swap,swap对性能和节点稳定性非常不利,应该不惜一切代价加以避免。它会导致垃圾回收持续几分钟而不是几毫秒,并且会导致节点响应缓慢,甚至与集群断开连接
network.host: 192.168.1.10 //es服务器IP
http.port: 9200 //es服务器端口
discovery.seed_hosts: [“elktest”] //es服务器发现主机初始列表
cluster.initial_master_nodes: [“elktest”]
action.auto_create_index: true //自动创建index
[root@elktest ~]# cd /etc/elasticsearch/
[root@elktest elasticsearch]# vim jvm.options
-Xms30g // Set Xmx and Xms to no more than 50% of your physical RAM
-Xmx30g
-XX:HeapDumpPath=/localdata/esdata //在内存不足异常时将堆转储到该目录
3、系统配置
[root@elktest ~]# vim /etc/security/limits.conf //永久生效
-
soft nofile 65535 //打开文件的最大数量 -
hard nofile 65535 -
soft nproc 4096 //创建的线程数至少为4096 -
hard nproc 8192
[root@elktest ~]# ulimit -n 65535 //临时设置打开文件的最大数量
[root@elktest ~]# ulimit –a //查看是否生效
注:如果是systemd而非systemctl,则需要通过以下方式修改限制
查看系统使用的Sysv是init or systemd
[root@elktest ~]# ps -p 1
PID TTY TIME CMD
1 ? 00:00:49 systemd
[root@elktest ~]# systemctl edit elasticsearch //
[Service]
LimitMEMLOCK=infinity
[root@elktest ~]# sysctl -w vm.max_map_count=524288 //临时修改mmap限制
[root@elktest ~]# vim /etc/sysctl.conf //永久修改mmap限制
vm.max_map_count=524288
重启服务器之后查看是否生效:
[root@elktest elasticsearch]# sysctl vm.max_map_count
vm.max_map_count = 524288
4、开启服务
[root@elktest ~]# systemctl daemon-reload
[root@elktest ~]# systemctl enable elasticsearch.service
[root@elktest ~]# systemctl start elasticsearch.service

三、安装部署Kibana
1、安装
[root@elktest ~]# rpm -ivh /localdata/tools/elk/kibana-7.14.0-x86_64.rpm
2、修改配置文件
[root@elktest ~]# vim /etc/kibana/kibana.yml
server.port: 5601
server.host: “0.0.0.0”
server.maxPayloadBytes: 1048576
server.name: “elktest”
elasticsearch.hosts: [“http://elktest:9200”]
kibana.index: “.kibana”
elasticsearch.requestTimeout: 30000
ops.interval: 5000
3、开启服务
[root@elktest ~]# systemctl daemon-reload
[root@elktest ~]# systemctl enable kibana.service
[root@elktest ~]# systemctl start kibana.service
web访问http:elktest:5601,如果启动后web无法打开,需将elasticsearch重启再启动kibana


4、修改最大分片数
更改最大分片数,默认1000
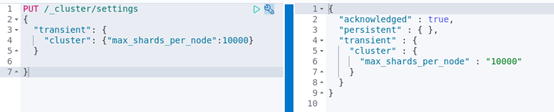
通过Kibana界面查看文件数限制是否生效

四、安装部署Logstash
1、安装
[root@elktest ~]# yum install logstash
2、配置
[root@elktest ~]# cat /etc/logstash/logstash.yml
node.name: elktest
path.data: /var/lib/logstash
pipeline.workers: 8
pipeline.batch.size: 1000
pipeline.batch.delay: 50
pipeline.ordered: auto
log.level: info
path.logs: /var/log/logstash
[root@elktest ~]# vim /etc/logstash/jvm.options
-Xms4g
-Xmx4g
3、测试标准输入和输出
[root@elktest ~]# cd /usr/share/logstash/bin/
./logstash -e ‘input { stdin {}} output { stdout {codec => rubydebug}}’
输入123456
输出:
{
“host” => “elktest”,
“@timestamp” => 2021-09-02T08:49:42.391Z,
“message” => “123456”,
“@version” => “1”
}
4、测试输出到文件
[root@elktest ~]# cat /etc/logstash/conf.d/logstash-sample.conf
input {
stdin {}
}
output {
file {
path => “/tmp/test20210902.log”
}
}
[root@elktest bin]# ./logstash -f /etc/logstash/conf.d/logstash-sample.conf //开启服务
5、文件输入,输出到es
[root@elktest ~]# cat /etc/logstash/conf.d/logstash-sample.conf
input {
file {
path => “/var/log/messages”
type => “syslog”
}
}
output {
elasticsearch {
hosts => [“http://elktest:9200”]
index => “test”
}
}
6、验证
[root@elktest elasticsearch]# cd /usr/share/logstash/bin/
[root@elktest bin]# ./logstash -f /etc/logstash/conf.d/logstash-sample.conf --config.test_and_exit
7、开启服务
[root@elktest ~]# systemctl daemon-reload
[root@elktest ~]# systemctl enable logstash.service
[root@elktest bin]# systemctl start logstash
8、查看es索引
[root@elktest ~]# curl -XGET http://elktest:9200/_cat/indices | grep test
% Total % Received % Xferd Average Speed Time Time Time Current
Dload Upload Total Spent Left Speed
100 980 100 980 0 0 158k 0 --:–:-- --:–:-- --:–:-- 191k
yellow open test NcA8FzVjQ2yC-YbsPcAWXw 1 1 10539 0 1.1mb 1.1mb
五、安装部署Filebeat
1、安装
[root@elktest modules.d]# yum install filebeat
2、Enable Module
[root@elktest ~]# cd /etc/filebeat/modules.d/
[root@elktest modules.d]# filebeat modules list
[root@elktest modules.d]# filebeat modules enable system //启动监测system模块
3、配置
[root@elktest modules.d]# vim /etc/filebeat/modules.d/system.yml
- module: system
syslog:
enabled: true
var.paths: ["/var/log/messages"] //收集messages日志
include_lines: [’^ERR’, ‘^WARN’] //可以依据需求过滤文件内容,例如包含ERR或WARN开头的行
exclude_lines: [’^DBG’] //例如:不包含DBG开头的行
auth:
enabled: true
var.paths: ["/var/log/secure"] 收集secure日志
[root@elktest modules.d]# vim /etc/filebeat/filebeat.yml
filebeat.inputs: - type: log
enabled: false
setup.kibana:
host: “elktest:5601”
output.logstash:
hosts: [“elktest:5044”]
4、启动服务
[root@elktest ~]# systemctl daemon-reload
[root@elktest ~]# systemctl enable filebeat.service
[root@elktest ~]# systemctl start filebeat.service
5、修改logstash配置文件
将filebeat收集到的数据输入到elasticsearch,index为test-filebeat
[root@elktest ~]# cat /etc/logstash/conf.d/logstash-sample.conf
input {
beats {
port => 5044
}
output {
elasticsearch {
hosts => [“http://elktest:9200”]
index => “test-filebeat”
}
}
6、重启logstash并验证index
[root@elktest ~]# systemctl restart logstash.service
[root@elktest ~]# curl -XGET http://elktest:9200/_cat/indices | grep test-filebeat
六、安装部署Kafka
1、下载安装
This Beat output works with all Kafka versions in between 0.11 and 2.2.2.
2.2.0版本的下载地址:https://archive.apache.org/dist/kafka/2.2.0/kafka_2.12-2.2.0.tgz
[root@elktest ~]# tar -zxvf kafka_2.12-2.2.0.tgz -C /opt/
[root@elktest ~]# cd kafka_2.12-2.2.0
2、修改配置文件
[root@elktest kafka_2.12-2.2.0]# vim config/zookeeper.properties
dataDir=/localdata/zookeeper
[root@elktest kafka_2.12-2.2.0]# vim config/server.properties
log.dirs=/var/log/kafka-logs
3、启动服务
[root@elktest ~]# cd /opt/kafka_2.12-2.2.0
[root@elktest kafka_2.12-2.2.0]# nohup bin/zookeeper-server-start.sh config/zookeeper.properties > /tmp/kafka.log 2>&1 &
[root@elktest kafka_2.12-2.2.0]# nohup bin/kafka-server-start.sh config/server.properties > /tmp/kafka.log 2>&1 &
4、Create a topic
[root@elktest kafka_2.12-2.2.0]# bin/kafka-topics.sh --create --bootstrap-server localhost:9092 --replication-factor 1 --partitions 1 --topic test //测试
[root@elktest kafka_2.12-2.2.0]# bin/kafka-topics.sh --list --bootstrap-server localhost:9092
Test
5、Send some messages
[root@elktest kafka_2.12-2.2.0]# bin/kafka-console-producer.sh --broker-list localhost:9092 --topic test
This is a message
This is another message
在另一个termanel查看输出
[root@elktest kafka_2.12-2.2.0]# bin/kafka-console-consumer.sh --bootstrap-server localhost:9092 --topic test --from-beginning
This is a message
This is another message
6、Filebeat将logs发送到Kafka
将之前的output配置注释掉,增加以下行
[root@elktest ~]# vim /etc/filebeat/filebeat.yml
output.kafka:
#initial brokers for reading cluster metadata
hosts: [“elktest:9092”]
#message topic selection + partitioning
topic: ‘messages’
partition.round_robin:
reachable_only: false
required_acks: 1
compression: gzip
max_message_bytes: 1000000
[root@elktest ~]# systemctl restart filebeat
7、Logstash将Kafka消息发送到ES
[root@elktest ~]# vim /etc/logstash/conf.d/logstash.conf
input {
kafka {
bootstrap_servers => “elktest:9092”
topics => [“messages”]
#consumer_threads => 5
#decorate_events => basic
auto_offset_reset => “earliest”
codec => “json”
}
}
output {
elasticsearch {
hosts => [“http://elktest:9200”]
index => “index => “%{[@metadata][beat]}-%{[@metadata][version]}-%{+YYYY.MM.dd}””
}
}
[root@elktest ~]# systemctl restart logstash
8、验证
[root@elktest ~]# curl -XGET http://elktest:9200/_cat/indices //查看是否写入
yellow open filebeat-7.14.0-2021.09.19.0 w1k2a9IPTiK5-nBiIEWo3g 1 1 18279 0 8.6mb 8.6mb
七、Kibana展示
web访问http://elktest:5601,点击左上角展开列表,可以看到有哪些功能

1、Create Index
点击列表中stack management,然后点击kibana 中的index patterns添加es的index到kibana中

点击create index pattern,此时列出系统中有那些index,填写filebeat-*即可将所有filebeat开头的的index添加,点击next step,选择@timestamp,create index pattern


2、查找数据
点击discover

Select fields,选择时间,查找需要的log

3、Create visualization
点击visualize


选择类型,例如创建表格,选择Lens,下一界面中选择table,将左边的列拖到中间即可

也可以重命名显示的名字,例如将Top vaules of hostname重命名为hostname

点击右上角save保存到library
4、创建dashboard

点击Add from library添加刚创建的visualization或者新建visualization
 点击右上角Save dashboard


 1086
1086


 被折叠的 条评论
为什么被折叠?
被折叠的 条评论
为什么被折叠?
 到【灌水乐园】发言


