错误:Consider defining a bean of type ‘*.UserService‘ in your configuration

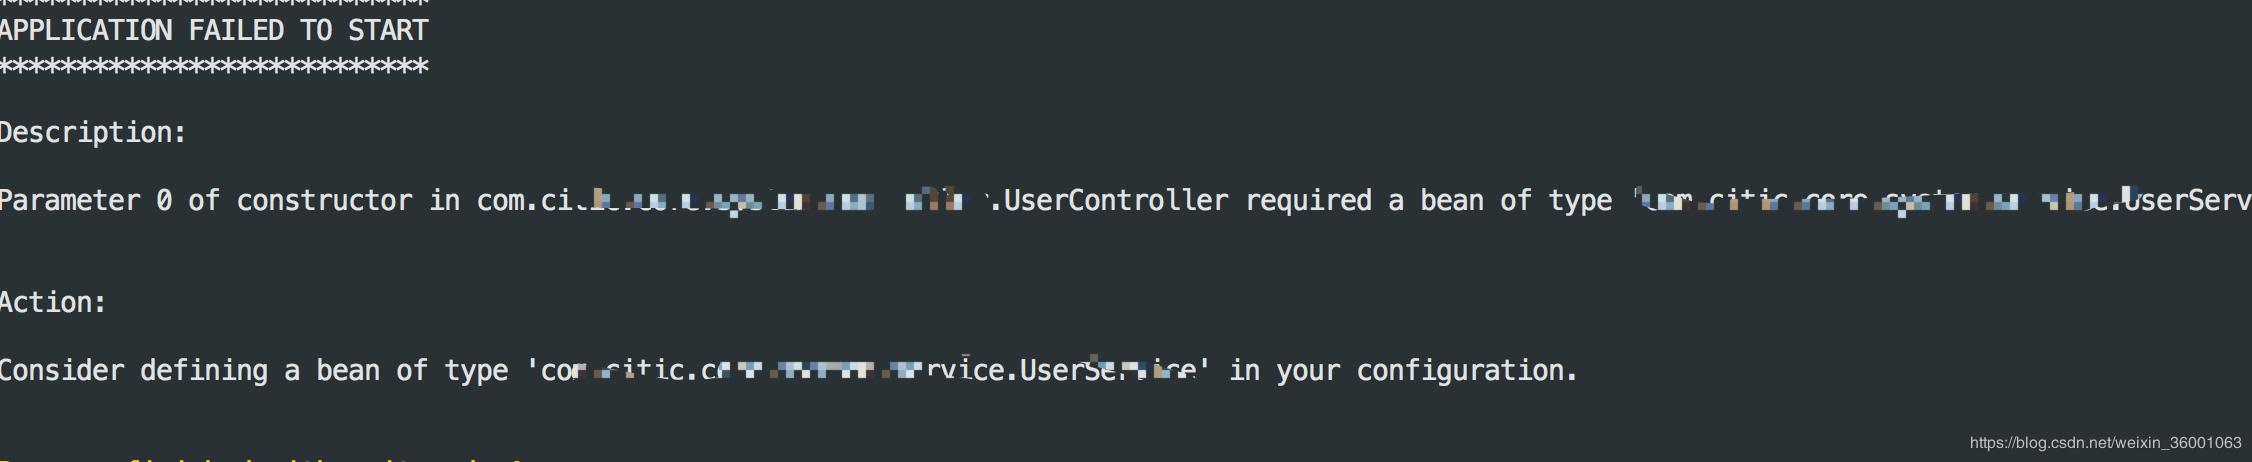
启动springboot项目遇到一个问题:Consider defining a bean of type

截图

原因描述:

项目已被分解为不同的模块,需要指定独立模块要扫描的类或包
  • 1

解决方案:

在对应的类标签上加上

@SpringBootApplication
@ComponentScan("com.citic.core")
  • 1
    点赞
  • 1
    收藏
    觉得还不错? 一键收藏
  • 2
    评论
This book explores the concept of a map as a fundamental data type. It defines maps at three levels. The first is an abstract level, in which mathematic concepts are leveraged to precisely explain maps and operational semantics. The second is at a discrete level, in which graph theory is used to create a data model with the goal of implementation in computer systems. Finally, maps are examined at an implementation level, in which the authors discuss the implementation of a fundamental map data type in database systems. The map data type presented in this book creates new mechanisms for the storage, analysis, and computation of map data objects in any field that represents data in a map form. The authors develop a model that includes a map data type capable of representing thematic and geometric attributes in a single data object. The book provides a complete example of mathematically defining a data type, ensuring closure properties of those operations, and then translating that type into a state that is suited for implementation in a particular context. The book is designed for researchers and professionals working in geography or computer science in a range of fields including navigation, reasoning, robotics, geospatial analysis, data management, and information retrieval. Table of Contents Chapter 1 Concepts of Maps Chapter 2 A Formal Model of Maps as a Fundamental Type Chapter 3 PLR Partitions: Extending Maps to Include Point and Line Features Chapter 4 Foundational Operations for Maps Chapter 5 Constructing Map Operations Using the Fundamental Map Operations Chapter 6 Extended Operations Over Maps Chapter 7 Topological Relationships Between Maps Chapter 8 A Discrete Model of Maps Chapter 9 Implementing Maps: Map2D
D3.js 4.x Data Visualization - Third Edition by Andrew Rininsland English | 28 Apr. 2017 | ASIN: B01MG90SSJ | 308 Pages | AZW3 | 6.6 MB Key Features Build interactive and rich graphics and visualization using JavaScript`s powerful library D3.js Learn D3 from the ground up, using the all-new version 4 of the library Gain insight into producing high-quality, extensible charts and visualizations using best practices such as writing testable, extensible code and strong typing Book Description Want to get started with impressive interactive visualizations and implement them in your daily tasks? This book offers the perfect solution-D3.js. It has emerged as the most popular tool for data visualization. This book will teach you how to implement the features of the latest version of D3 while writing JavaScript using the newest tools and technique You will start by setting up the D3 environment and making your first basic bar chart. You will then build stunning SVG and Canvas-based data visualizations while writing testable, extensible code,as accurate and informative as it is visually stimulating. Step-by-step examples walk you through creating, integrating, and debugging different types of visualization and will have you building basic visualizations (such as bar, line, and scatter graphs) in no time. By the end of this book, you will have mastered the techniques necessary to successfully visualize data and will be ready to use D3 to transform any data into an engaging and sophisticated visualization. What you will learn Map data to visual elements using D3's scales Draw SVG elements using D3's shape generators Transform data using D3's collection methods Use D3's various layout patterns to quickly generate various common types of chart Write modern JavaScript using ES2017 and Babel Explore the basics of unit testing D3 visualizations using Mocha and Chai Write and deploy a simple Node.js web service to render charts via HTML Canvas Understand what makes a good data visualization and how to use the tools at your disposal to create accurate charts About the Author Andrew Rininsland is a developer and journalist who has spent much of the last half a decade building interactive content for newspapers such as The Financial Times, The Times, Sunday Times, The Economist, and The Guardian. During his 3 years at The Times and Sunday Times, he worked on all kinds of editorial projects, ranging from obituaries of figures such as Nelson Mandela to high-profile, data-driven investigations such as The Doping Scandal the largest leak of sporting blood test data in history. He is currently a senior developer with the interactive graphics team at the Financial Times. Swizec Teller, author of Data Visualization with d3.js, is a geek with a hat. He founded his first start-up at the age of 21 years and is now looking for the next big idea as a full-stack Web generalist focusing on freelancing for early-stage start-up companies. When he isn't coding, he's usually blogging, writing books, or giving talks at various non-conference events in Slovenia and nearby countries. He is still looking for a chance to speak at a big international conference. In November 2012, he started writing Why Programmers Work At Night, and set out on a quest to improve the lives of developers everywhere. Table of Contents Getting Started with D3, ES2017, and Node.js A Primer on DOM, SVG, and CSS Shape Primitives of D3 Making Data Useful Defining the User Experience - Animation and Interaction Hierarchical Layouts of D3 The Other Layouts D3 on the Server with Canvas, Koa 2, and Node.js Having Confidence in Your Visualizations Designing Good Data Visualizations

“相关推荐”对你有帮助么?

  • 非常没帮助
  • 没帮助
  • 一般
  • 有帮助
  • 非常有帮助
提交
评论 2
添加红包

请填写红包祝福语或标题

红包个数最小为10个

红包金额最低5元

当前余额3.43前往充值 >
需支付:10.00
成就一亿技术人!
领取后你会自动成为博主和红包主的粉丝 规则
hope_wisdom
发出的红包
实付
使用余额支付
点击重新获取
扫码支付
钱包余额 0

抵扣说明:

1.余额是钱包充值的虚拟货币,按照1:1的比例进行支付金额的抵扣。
2.余额无法直接购买下载,可以购买VIP、付费专栏及课程。

余额充值