


因为我使用的是远程桌面截取的运行环境里面的界面,截图没法看到鼠标悬停内容,所以就手机拍了一张,有点不清晰,无非就是一个效果图,大家将就着看吧。
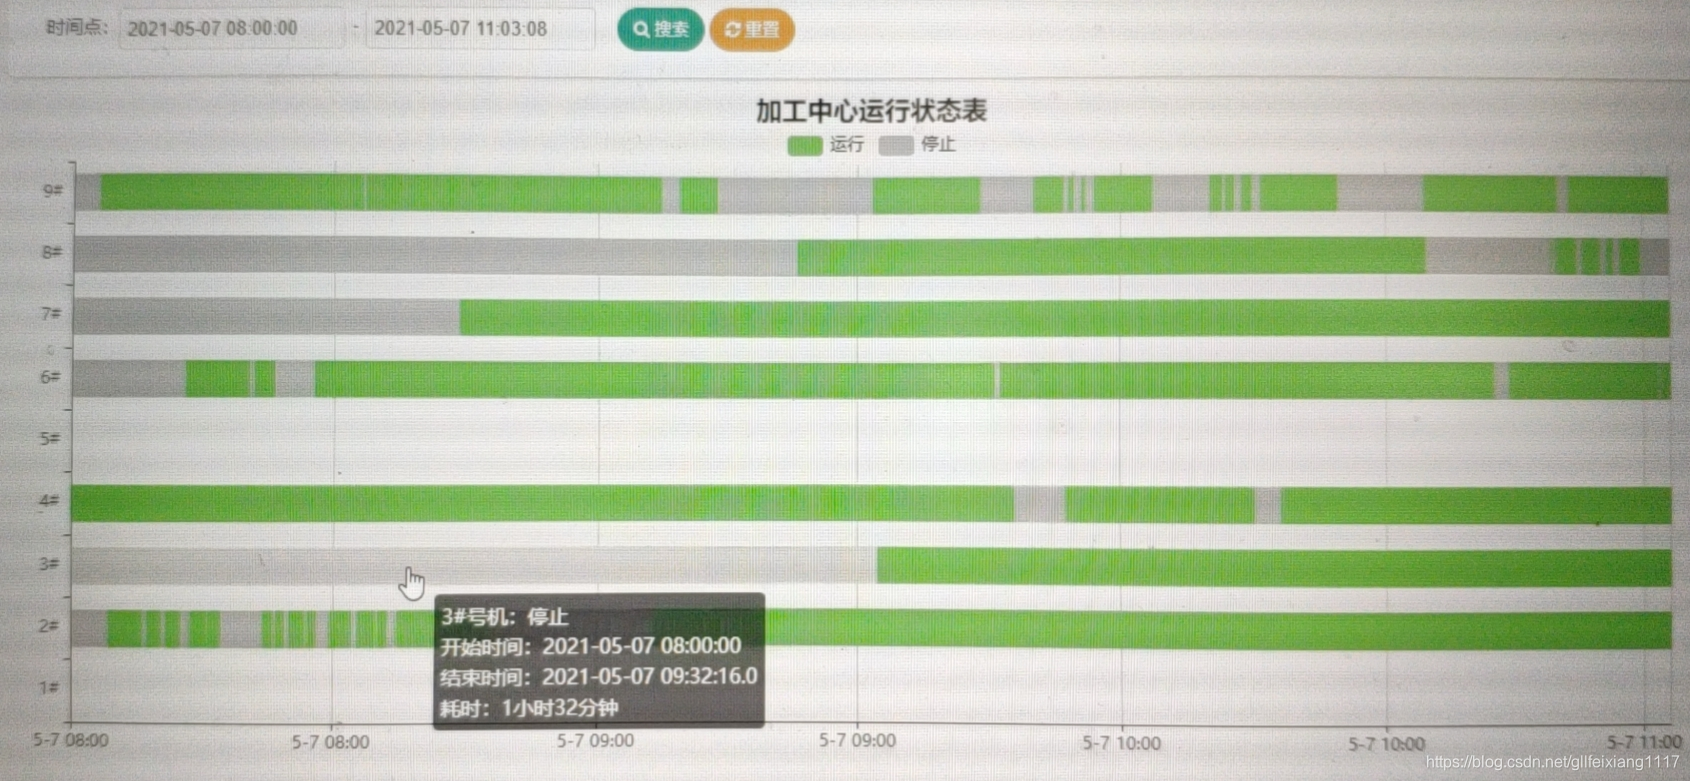
有9台机床,系统监听机床的运行状态,将运行状态记录在系统里,使用echart的图表来显示出来,包括开始时间、结束时间、耗时等,下面是代码,默认显示当天的内容。生产环境的针对项目做了接口,下面的是一个可运行的demo,大家可以自己尝试制作接口,如有问题请留言
<!DOCTYPE html>
<html style="height: 100%">
   <head>
       <meta charset="utf-8">
   </head>
   <body style="height: 100%; margin: 0">
       <div id="container" style="height: 100%"></div>
       <script type="text/javascript" src="https://cdn.jsdelivr.net/npm/echarts@4/dist/echarts.min.js"></script>
       <script type="text/javascript" src="https://cdn.jsdelivr.net/npm/echarts@4/dist/extension/dataTool.min.js"></script>
       <script type="text/javascript" src="https://cdn.jsdelivr.net/npm/echarts@4/map/js/china.js"></script>
       <script type="text/javascript" src="https://cdn.jsdelivr.net/npm/echarts@4/map/js/world.js"></script>
       <script type="text/javascript" src="https://cdn.jsdelivr.net/npm/echarts@4/dist/extension/bmap.min.js"></script>
       <script type="text/javascript">
var dom = document.getElementById("container");
var myChart = echarts.init(dom);
var app = {};


    var colors = ['#75d874', '#c0c0c0']; //三种状态的颜色
    var state = ['运行', '停止']; //三种状态

    // echart配置
    var option = {
		title: {
			text: '车床运行状态表',
			left: 'center',
			top:'1%'
		},
        color: colors,
        tooltip: {//提示框
            formatter: function (params) {
                return params.name + ':<br/>' + params.value[1] + '~' + params.value[2] + '<br/>' + params.value[3];
            }//数据的值
        },
        legend: {//图例
            data: state,
            top: '5%',
            selectedMode: false, // 图例设为不可点击
            textStyle: {
                color: '#000'
            }
        },
        grid: {//绘图网格
            left: '3%',
            right: '3%',
            top: '10%',
            bottom: '10%',
            containLabel: false
        },
        xAxis: {
            type: 'time',
			scale:true,
			//interval: 3600  * 2000,   //以一个小时递增
            //interval: 3600  * 1000,   //以一个小时递增
            min:'2009-6-1 1:00', //将data里最小时间的整点时间设为min,否则min会以data里面的min为开始进行整点递增
            axisLabel: {formatter: function (value) {
                var date = new Date(value); return getzf(date.getHours()) + ':00';
                function getzf(num) {
                	if (parseInt(num) < 10) {  num = '0' + num; }
                	return num;
                }
              },
            }
        },
        yAxis: {
            data: ['1#', '2#', '3#','4#','5#','6#','7#','8#','9#']
        },
        series: [

            { name: state[0], type: 'bar', data: [] },
            { name: state[1], type: 'bar', data: [] },// 用空bar来显示三个图例
            {
                type: 'custom',
                renderItem: function (params, api) {//开发者自定义的图形元素渲染逻辑,是通过书写 renderItem 函数实现的
                    var categoryIndex = api.value(0);//这里使用 api.value(0) 取出当前 dataItem 中第一个维度的数值。
                    var start = api.coord([api.value(1), categoryIndex]); // 这里使用 api.coord(...) 将数值在当前坐标系中转换成为屏幕上的点的像素值。
                    var end = api.coord([api.value(2), categoryIndex]);
                    var height = api.size([0, 1])[1] * 0.6;

                    return {
                        type: 'rect',// 表示这个图形元素是矩形。还可以是 'circle', 'sector', 'polygon' 等等。
                        shape: echarts.graphic.clipRectByRect({ // 矩形的位置和大小。
                            x: start[0],
							y: start[1] - height / 2,
							width: end[0] - start[0],
							height: height
                        }, { // 当前坐标系的包围盒。
                            x: params.coordSys.x,
                            y: params.coordSys.y,
                            width: params.coordSys.width,
                            height: params.coordSys.height
                        }),
                        style: api.style()
                    };
                },
                encode: {
                    x: [1, 2], // data 中『维度1』和『维度2』对应到 X 轴
                    y: 0// data 中『维度0』对应到 Y 轴
                },
                data: [ // 维度0 维度1 维度2
                  {
                      itemStyle: { normal: { color: colors[0] } },//条形颜色
                      name: '1#',
                      value: [0, '2009-06-01 1:00', '2009-06-01 5:00',0]//0,1,2代表y轴的索引,后两位代表x轴数据开始和结束
                  },{
                        itemStyle: { normal: { color: colors[1] } },
                        name: '1#',
                        value: [0, '2009-06-01 5:00', '2009-06-01 6:13',0]
                    },
                    {
                        itemStyle: { normal: { color: colors[0] } },
                        name: '1#',
                        value: [0, '2009-06-01 6:13', '2009-06-01 8:22',0]
                    },
                   {
                       itemStyle: { normal: { color: colors[1] } },
                       name: '2#',
                       value: [1, '2009-06-01 5:00', '2009-06-01 6:13',0]
                   },
                    {
                        itemStyle: { normal: { color: colors[1] } },
                        name: '2#',
                        value: [1, '2009-06-01 8:22', '2009-06-01 9:10',0]
                    },
                    {
                        itemStyle: { normal: { color: colors[1] } },
                        name: '2#',
                        value: [1, '2009-06-01 12:47', '2009-06-01 14:52',0]
                    },
                  {
                      itemStyle: { normal: { color: colors[0] } },
                      name: '3#',
                      value: [2, '2009-06-01 9:10', '2009-06-01 12:47',0]
                  },
                {
                    itemStyle: { normal: { color: colors[0] } },
                    name: '3#',
                    value: [2, '2009-06-01 14:52', '2009-06-01 17:00',0]
                },
					{
					"name":"3#",
					"itemStyle":{"normal":{"color":"#C0C0C0"}},
					"value":[2,"2009-06-01 00:00:00","2009-06-01 03:27:39.0","3\u5C0F\u65F627\u5206\u949F",0]},
					{"name":"3#",
					"itemStyle":{"normal":{"color":"#75d874"}},
					"value":[2,"2009-06-01 03:27:39.0","2009-06-01 23:59:59","20\u5C0F\u65F632\u5206\u949F",1]},
                ]
            }
        ]
    };


if (option && typeof option === "object") {
    myChart.setOption(option, true);
}
       </script>
   </body>
</html>


 529
529

 被折叠的 条评论
为什么被折叠?
被折叠的 条评论
为什么被折叠?
 到【灌水乐园】发言


