


jfreechart详细设置 http://gavinshaw.iteye.com/blog/468956
package CreateChart;
import graph.readXmlFile.ReadXmlFileToObject;
import graph.xmlModel.Chart;
import java.util.ArrayList;
import java.util.Collections;
import java.util.List;
import java.awt.Color;
import java.awt.Font;
import java.awt.Paint;
import java.io.FileNotFoundException;
import java.io.FileOutputStream;
import java.io.IOException;
import org.jfree.chart.ChartFactory;
import org.jfree.chart.ChartUtilities;
import org.jfree.chart.JFreeChart;
import org.jfree.chart.axis.AxisLocation;
import org.jfree.chart.axis.CategoryAxis;
import org.jfree.chart.axis.CategoryLabelPositions;
import org.jfree.chart.axis.NumberAxis;
import org.jfree.chart.axis.NumberTickUnit;
import org.jfree.chart.axis.ValueAxis;
import org.jfree.chart.plot.CategoryPlot;
import org.jfree.chart.plot.PlotOrientation;
import org.jfree.chart.plot.XYPlot;
import org.jfree.chart.renderer.category.LineAndShapeRenderer;
import org.jfree.chart.renderer.category.LineRenderer3D;
import org.jfree.chart.title.LegendTitle;
import org.jfree.chart.title.TextTitle;
import org.jfree.data.category.CategoryDataset;
import org.jfree.data.category.DefaultCategoryDataset;
import org.jfree.data.time.Month;
import org.jfree.data.time.TimeSeries;
import org.jfree.data.time.TimeSeriesCollection;
import org.jfree.data.xy.XYDataset;
public class CreateChart {
//图片宽高
private static int width= 0;
private static int height = 0;
//图片横向、纵向扩展倍数
private static int XExtendNum = 20;
private static int YExtendNum = 10;
//y轴最小值、最大值
private static double yMinValue= 0.0;
private static double yMaxValue= 0.0;
//y轴刻度间隔值
private static final double YDISTANCE = 0.5d;
//定义一个集合xmlMoneyList,存放xml_money已得到最大最小值
private static List<Double> xmlMoneyList = new ArrayList<Double>();
//定义标题、横轴、纵轴、图例名称
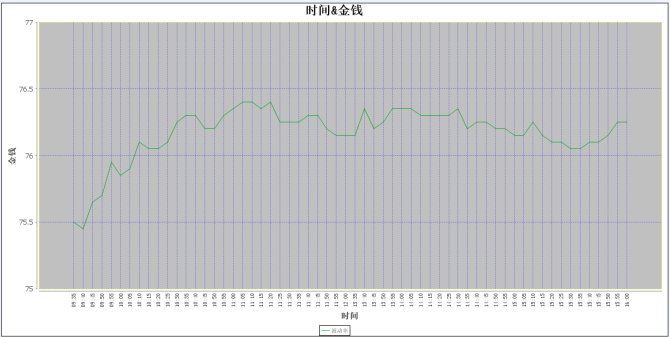
private static String titleName = "时间&金钱";
private static String XName = "时间";
private static String YName = "金钱";
private static String TLName = "波动率";
//图片生成到的路径
private static String picOutPath = "e:/money.jpg";
//设置背景颜色
private static Paint backColor = Color.LIGHT_GRAY;
//设置背景 横向网格线条的颜色
private static Paint backXColor = Color.blue;
//设置背景 纵向网格线条的颜色
private static Paint backYColor = Color.blue;
//设置波动率 线条的颜色,alpha
private static Color lineColor = new Color(9,171,40);
//控制波动率图线的alpha值,alpha值在0.0-1.0之间
private static float alpha = 1.0f;
//设置图表边框的颜色
private static Paint borderColor = Color.yellow;
//设置标题字体、加粗类型、大小
private static Font titleFont = new Font("宋体", Font.BOLD, 22);
//设置横轴、刻度(字体、加粗类型、大小)
private static Font XFont = new Font("宋体" , Font.BOLD , 15);
private static Font XKDFont = new Font("宋体" , Font.PLAIN , 10);
//设置纵轴、刻度(字体、加粗类型、大小)
private static Font YFont = new Font("宋体" , Font.BOLD , 15);
//设置图例、刻度(字体、加粗类型、大小)
private static Font TLFont = new Font("宋体" , Font.PLAIN , 10);
//设置横轴数据 倾斜方向
private static CategoryLabelPositions xplable = CategoryLabelPositions.UP_90;
/**
* 生成图表
* @param args
* @throws IOException
*/
public static void main(String[] args) throws IOException
{
//获取Xml文件路径,当然,这里路径是写死的
String Path = System.getProperty("user.dir")+"\\sourceXmlFile\\klineServlet.xml";
ReadXmlFileToObject r = ReadXmlFileToObject.getInstance();
Chart chartObject = r.insertDataToChart(Path);
//定义JFreeChart
JFreeChart chart = ChartFactory.createLineChart(
titleName, // 标题
XName, // 横坐标
YName, // 纵坐标
(CategoryDataset) getDataSet(chartObject),//获取数据
PlotOrientation.VERTICAL, // 竖直图表
true, // 是否显示legend
false, // 是否显示tooltip
false // 是否使用url链接
);
//处理标题、x、y轴中英文字体,避免中文乱码、图表样式
doHandleWord(chart);
//输出图片
outPutPic(chart);
}
//处理标题、x、y轴中英文字体,避免中文乱码、图表样式
private static void doHandleWord(JFreeChart chart) {
//start标题处理
TextTitle textTitle = chart.getTitle();
textTitle.setFont(titleFont);
//nd标题处理
//设置图的高级属性
CategoryPlot plot = (CategoryPlot)chart.getPlot();
LineAndShapeRenderer lineandshaperenderer = (LineAndShapeRenderer) plot.getRenderer();
//start横轴处理
//取得横轴
CategoryAxis categoryAxis = plot.getDomainAxis();
//设置横轴显示标签的字体
categoryAxis.setLabelFont(XFont);
//分类标签以90度角倾斜
categoryAxis.setCategoryLabelPositions(xplable);
categoryAxis.setTickLabelFont(XKDFont);
//end横轴处理
//start纵轴处理
NumberAxis numberAxis = (NumberAxis)plot.getRangeAxis();
//设置纵轴显示标签的字体
numberAxis.setLabelFont(YFont);
//设置纵轴刻度 非自动处理
numberAxis.setAutoTickUnitSelection(false);
//设置增值 为10各单位 ,太小了图片会很模糊
NumberTickUnit nt= new NumberTickUnit(YDISTANCE);
numberAxis.setTickUnit(nt);
//设置纵坐标的起始值
numberAxis.setLowerBound(yMinValue);
numberAxis.setUpperBound(yMaxValue);
//end纵轴处理
//底部图例中文设置
chart.getLegend().setItemFont(TLFont);
//设置网格竖线颜色
plot.setDomainGridlinePaint(backYColor);
plot.setDomainGridlinesVisible(true);
//设置网格横线颜色
plot.setRangeGridlinePaint(backXColor);
plot.setRangeGridlinesVisible(true);
//图片背景色
plot.setBackgroundPaint(backColor);
plot.setOutlineVisible(true);
//图边框颜色
plot.setOutlinePaint(borderColor);
//控制波动率图线的alpha值,alpha值在0.0-1.0之间
plot.setForegroundAlpha(alpha);
//设置波动率图线的颜色
lineandshaperenderer.setSeriesPaint(0, lineColor);
}
//输出图片
private static void outPutPic(JFreeChart chart) {
FileOutputStream fos = null;
try {
fos = new FileOutputStream(picOutPath);
ChartUtilities.writeChartAsPNG(fos, chart, width, height);
} catch (IOException e) {
e.printStackTrace();
}finally{
try {
fos.close();
} catch (IOException e) {
e.printStackTrace();
}
}
}
//返回一个CategoryDataset实例
private static CategoryDataset getDataSet(Chart chartObject)
{
//关键1.定义你要使用的图形类型实例
DefaultCategoryDataset dataset = new DefaultCategoryDataset();
//根据取到的数据多少,决定图片大小,规则自己定义(图片的长=横轴显示的个数*20 宽=横轴显示的个数*10 动态扩展)
List<String> stringList = disposeString(chartObject);
width = stringList.size() * XExtendNum;
height = stringList.size() * YExtendNum;
for(int i = 0 ;i < stringList.size() ; i++)
{
String ptValue = stringList.get(i);
String[] rs=ptValue.split("%");
String time = rs[0];
String xml_money =rs[1];
//你们让取的最后一个值,我不知道要用到什么地方,就先把值传到这里吧,
String index_number = rs[2];
//把所有的xml_money都放放入集合xmlMoneyList
xmlMoneyList.add(Double.parseDouble(xml_money));
//关键2.将你取到的数据,添加到实例dataset中去,参数1:y轴数据、参数2:图例名称、参数3:x轴数据
dataset.addValue(Double.parseDouble(xml_money),TLName, time);
}
//对xmlMoneyList排序,默认为升序
Collections.sort(xmlMoneyList);
/**取到最大、最小值,因为我们得到的最大值最小值可能处于75.45-76.4之间,
这样在步伐增值为0.5的时候就会丢失一些不必要的数据,所以我们采用
最小值向下取最小整数(75),最大值向上取最小整数 77
*/
yMinValue = Math.floor(xmlMoneyList.get(0));
yMaxValue = Math.round(xmlMoneyList.get(xmlMoneyList.size() - 1) + 0.5);
//关键3:返回数据
return dataset;
}
/**
* 处理XML文件中PT标签中的值,得到我需要得到的即可,我只需要得到第2、6、7个数据
*/
private static List<String> disposeString(Chart chartObject)
{
//因为一条数据里面有好几种,所以考虑用list嵌套
List<String> ptValue = new ArrayList<String>();
//获得pt的个数
int pt_num = chartObject.getPts().getPtList().size();
for(int i = 0 ;i < pt_num ; i++)
{
//遍历数据
String data = chartObject.getPts().getPtList().get(i).getValue();
/*
* 因为数据格式是:20110624;09:35;75.75;75.6;75.75;75.5;706000;53407200.000;0;0
* 我暂时不考虑其他情况,默认为数据都是这样的数据
*/
String[] datas = data.split(";");
//按照您们的要求去取2、6、7、的数据
String time = datas[1];
String money = datas[5];
String index_number = datas[6];
String rs = time+"%"+money+"%"+index_number;
//然后把数据放到集合中
ptValue.add(rs);
}
return ptValue;
}
}


 2万+
2万+

 被折叠的 条评论
为什么被折叠?
被折叠的 条评论
为什么被折叠?
 到【灌水乐园】发言


