学习使用echats实现双刻度echarts双Y轴,左右Y轴数据的方法
代码
<!DOCTYPE html>
<html lang="en" style="height: 100%">
<head>
<meta charset="utf-8">
</head>
<body style="height: 100%; margin: 0">
<div id="qipa_container" style="height: 100%"></div>
<script type="text/javascript" src="https://registry.npmmirror.com/echarts/5.4.3/files/dist/echarts.min.js"></script>
<script type="text/javascript">
function calMax(arr) {
let max = 0;
arr.forEach((el) => {
el.forEach((el1) => {
if (!(el1 === undefined || el1 === '')) {
if (max < el1) {
max = el1;
}
}
})
})
let maxint = Math.ceil(max / 9.5);
let maxval = maxint * 10;
return maxval;
}
function calMin(arr) {
let min = 0;
arr.forEach((el) => {
el.forEach((el1) => {
if (!(el1 === undefined || el1 === '')) {
if (min > el1) {
min = el1;
}
}
})
})
let minint = Math.floor(min / 10);
let minval = minint * 10;
return minval;
}
var data1 = [59357.9, 52789.77, 24837.98, 14345.02, 2291.93],
data2 = [12108.81, 701.43, 1280.75, 2109.83, 18693.95],
data3 = [10, 20, 52.95, 42.25, 84.02],
data4 = [30, 105.79, 82.59, 264.73, 786.04]
var Min1 = calMin([data1, data2]), Min2 = calMin([data3, data4]),
Max1 = calMax([data1, data2]), Max2 = calMax([data3, data4]);
var dom = document.getElementById('qipa_container');
var myChart = echarts.init(dom, null, {
renderer: 'canvas',
useDirtyRect: false
});
var app = {};
let option = {
grid: {left: '100', right: '100', bottom: '100', top: '100'},
color: ['#0698d6', '#fd8246', '#d773b4', '#41ac7c', '#e86367', '#aada9c'],
tooltip: {trigger: 'axis', axisPointer: {type: 'cross', crossStyle: {color: '#999'}}},
legend: {data: ['营业收入', '净利润', '营业收入同比增长率', '净利润同比增长率']},
xAxis: [{
type: 'category',
show: false,
lineWidth: 0,
axisPointer: {
type: 'shadow'
},
data: ["2013-12-31", "2014-12-31", "2015-12-31", "2016-12-31", "2017-12-31"]
}],
yAxis: [{
name: '单位:万元',
nameTextStyle: {color: '#999999'},
type: "value",
axisLine: {show: false},
axisTick: {show: false},
axisLabel: {verticalAlign: "bottom", color: "#999999"},
min: Min1,
max: Max1,
splitNumber: 5,
interval: (Max1 - Min1) / 5
}, {
name: '单位:%',
type: 'value',
nameTextStyle: {color: '#999999'},
axisLine: {show: false},
axisTick: {show: false},
axisLabel: {verticalAlign: "bottom", color: "#999999"},
min: Min2,
max: Max2,
splitNumber: 5,
interval: (Max2 - Min2) / 5
}],
series: [{name: '营业收入', type: 'line', data: data1},
{name: '净利润', type: 'line', data: data2},
{name: '营业收入同比增长率', type: 'line', yAxisIndex: 1, data: data3},
{name: '净利润同比增长率', type: 'line', yAxisIndex: 1, data: data4}
]
};
if (option && typeof option === 'object') {
myChart.setOption(option);
}
window.addEventListener('resize', myChart.resize);
</script>
</body>
</html>
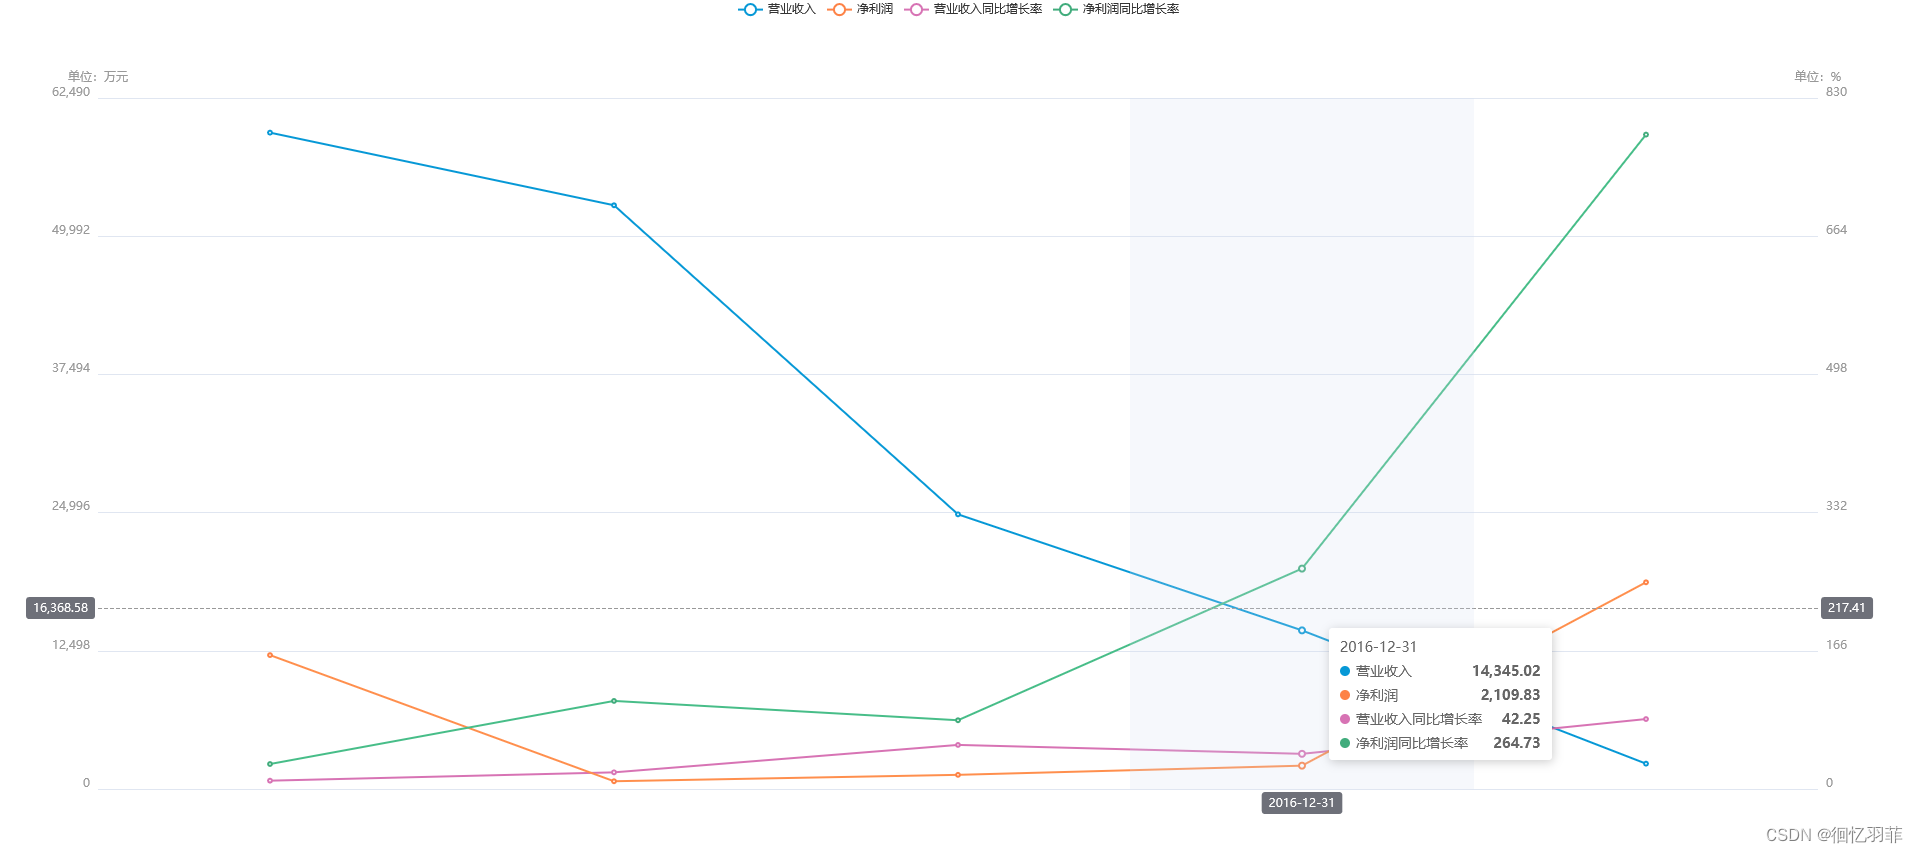
效果图


 784
784


 被折叠的 条评论
为什么被折叠?
被折叠的 条评论
为什么被折叠?
 到【灌水乐园】发言


