% 创建多组数据
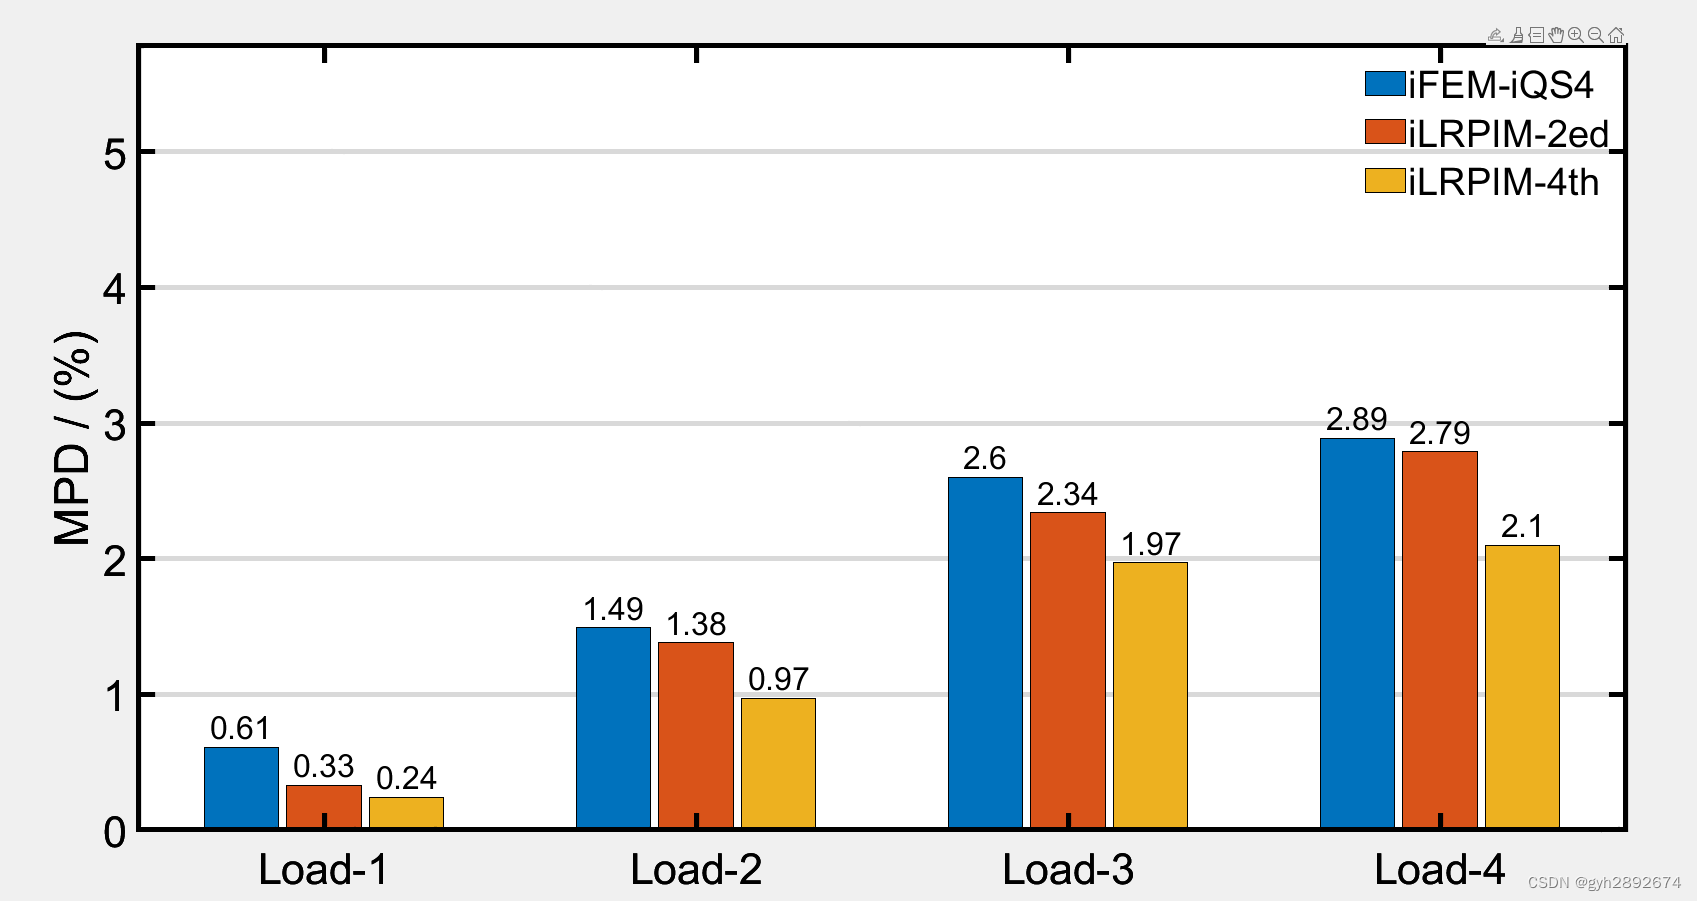
MPD = [0.61 0.33 0.24;1.49 1.38 0.97 ; 2.60 2.34 1.97 ; 2.89 2.79 2.10];
% 使用 bar 函数绘制多组柱状图
b=bar(MPD,'FaceColor','flat','BarWidth',0.9);
%% 使用 bar 函数绘制多组柱状图
% % % color = [216 208 143; 165 170 78; 172 71 101]/255;
% % % % b = bar(y,'FaceColor','flat');
% % % for k = 1:size(MPD,2)
% % % b(k).CData = color(k,:);
% % % end
% 添加标题和标签
% title('多组柱状图示例');
% xlabel('数据点');
ylabel('MPD / (%)');
% 设置 x 轴刻度标签
ab=32;
ac=24;
set(gca, 'XTickLabel', {'Load-1', 'Load-2','Load-3', 'Load-4'});
set(gca,'FontSize',ab);
%% 显示网格线
ax = gca; % current axes
ax.XGrid = 'off';
ax.YGrid = 'on';
set(ax,'XColor','black','LineWidth',4);
set(ax,'YColor','black','LineWidth',4);
%% 显示图例
legend('iFEM-iQS4', 'iLRPIM-2ed','iLRPIM-4th');
% 隐藏图例的边框
legend('box', 'off');
%% 添加柱状图顶的数字
xtips1 = b(1).XEndPoints;
ytips1 = b(1).YEndPoints;
labels1 = string(b(1).YData);
text(xtips1,ytips1,labels1,'HorizontalAlignment','center',...
'VerticalAlignment','bottom','FontSize',ac)
xtips2 = b(2).XEndPoints;
ytips2 = b(2).YEndPoints;
labels2 = string(b(2).YData);
text(xtips2,ytips2,labels2,'HorizontalAlignment','center',...
'VerticalAlignment','bottom','FontSize',ac)
xtips3 = b(3).XEndPoints;
ytips3 = b(3).YEndPoints;
labels3 = string(b(3).YData);
text(xtips3,ytips3,labels3,'HorizontalAlignment','center',...
'VerticalAlignment','bottom','FontSize',ac)
% 设置 y 轴范围为 0 到 70
ylim([0, 2*max(max(MPD))]);


 5865
5865

 被折叠的 条评论
为什么被折叠?
被折叠的 条评论
为什么被折叠?
 到【灌水乐园】发言


